
Traditionally, the diagnosis of acute rejection (AR) relies on invasive transbronchial biopsies (TBBs) to obtain histopathological samples. We aimed to evaluate the diagnostic yield of probe-based confocal laser endomicroscopy (pCLE) as a complementary and non-invasive tool for ACR screening, comparing its results with those obtained from TBBs.
MethodsBetween January 2015 and April 2022, we conducted a retrospective study of all lung transplant recipients aged over 18 years at Toulouse University Hospital (France). All patients who underwent bronchoscopies with both TBBs and pCLE imaging were included. Two experienced interpreters (TV and MS) reviewed the pCLE images independently, blinded to all clinical information and pathology results.
ResultsFrom 120 procedures in 85 patients, 34 abnormal histological samples were identified. Probe-based confocal laser endomicroscopy revealed significant associations between both alveolar (ALC) and perivascular (PVC) cellularities and abnormal histological samples (p<0.0001 and 0.003 respectively). Alveolar cellularity demonstrated a sensitivity (Se) of 85.3 %, specificity (Spe) of 43 %, positive predictive value (PPV) of 37.2 % and negative predictive value (NPV) of 88.1 %. For PVC, Se was 70.6 %, Spe 80.2 %, PPV 58.5 % and NPV 87.3 %. Intra-interpreter correlation (TV) was 88.3 % for the number of vessels (+/-1), 98.3 % for ALC and 90 % for PVC. Inter-interpreter correlation (TV and MS) was 80 % for vessels (+/-1), 97.5 % for ALC and 83.3 % for PVC.
ConclusionOur study demonstrates the feasibility of incorporating pCLE into clinical practice, demonstrating good diagnostic yield and reproducible outcomes in the screening of AR in lung transplant recipients.
Lung transplant recipients have the highest rate of acute rejection (AR) among commonly transplanted solid organs. 1 During the first post-transplant year, up to 53 % of patients experience at least one AR episode.2–4 The accurate diagnosis of AR remains pivotal for optimising post-transplant management.2 Clinical findings and non-invasive diagnostic methods, including computed tomography (CT) imaging and pulmonary function test (PFT) alone have proven poorly specific for the accurate identification of AR.5 Conventional diagnostic strategies for AR have predominantly relied on invasive transbronchial biopsies (TBBs) to procure histopathological samples with the identification of lymphocytic infiltrates distributed either in a perivascular manner (grade A) or around the bronchioles (grade B).6 The presence of common suboptimal sampling, notable variability in pathological interpretation 7 and the potential occurrence of life-threatening complications (including haemorrhage),8 collectively underscore the imperative to explore alternative diagnostic modalities for the identification of AR. Probe-based confocal laser endomicroscopy (pCLE) is an emerging technology which offers the promise of non-invasive and real-time microscopic insights into tissue cellular architecture.9 When inserted into the airways of the lungs, the probe emits a low-power LASER beam that interacts with the cellular structures of the lung tissue.10 This interaction generates real-time, high-resolution images of tissue cellular architecture during bronchoscopy procedures.10,11 The utilization of pCLE has enhanced the understanding, diagnosis and management of notable lung pathologies which include smoking-related diseases,10 lung cancer,12 interstitial lung disease13 and drug-related pneumonia.14 Prior investigations have suggested the existence of distinct pCLE characteristics in lung transplant recipients experiencing AR.15,16 In this study, we evaluate the pCLE procedure as a tool for detecting AR during the surveillance of lung transplant recipients.
MethodsPatients and data collectedAll lung transplant recipients who underwent bronchoscopies with both TBBs and pCLE between January 2015 and May 2022 were retrospectively enroled in the CELTICS (Confocal Endomicroscopy for Lung Transplant In Vivo Cellularity Sight) study. Patient demographics were collected. Forced expiratory volume in the first second (FEV1) before bronchoscopy was compared to the preceding one within 4 months. The decrease in FEV1 was graded as follows: < 5 %, 5 %−10 % and >10 %. The C-reactive protein level within a week before bronchoscopy was collected. The chest CT scan performed in the two weeks before the bronchoscopy was analysed by a Respiratory Radiologist (SC) and a Pulmonologist (TV). Bronchoscopy was performed under local or general anaesthesia. Real-time video sequences of the alveolar space were recorded using the pCLE system (Cellvizio™ with an AlveoFlex™ Confocal Miniprobe manufactured by Mauna Kea™ Technologies, Paris, France) which generates a blue LASER (488 nm) with a confocal depth of field of between 0 and 50 μm, a field of view of 600 µm and a spatial resolution of 3.5 μm. Broncho alveolar lavages (BALs) were carried out using 50–150 mL sterile 0.9 % saline solution in 3 several fractions within a single lung segment after pCLE sequences and before TBBs. The first aliquot of lavage material and tracheobronchial secretions were examined for conventional bacterial, viral and fungal pathogens. The BAL fraction was spun (105 cell/mL) in a cytocentrifuge and stained with May-Grünwald Giemsa for differential cell counts. Transbronchial biopsies (2–8 samples) were finally performed by forceps in the same segment as the pCLE sequences. All histopathological analyses were interpreted by the same Pulmonary Pathologist (M.C). The specimens were graded using the Lung Rejection Study Group criteria for acute rejection (Grade A) and airway inflammation (Grade B) as follows: A0 and B0 (none), A1 and B1 (minimal), A2 and B2 (mild). No grade higher than A2 or B2 was observed. C4d deposition assessed by immunohistochemistry was noted.
Evaluation of pCLE performanceAll pCLE videos were anonymised. Two experienced interpreters (TV and MS), blinded to all clinical information and pathology results, reviewed pCLE images independently. The number of vessels, alveolar and perivascular cellularities viewed during sequences were recorded. Intra-interpreter agreement (TV) and inter-interpreter agreement (between TV and MS) was calculated.
EthicsAccording to French Ethics Law and the Public Health Code, retrospective studies using standard healthcare data are exempt from Ethics Committee submission but must comply with the French Data Protection Commission's (CNIL) reference methodology (MR-004). Toulouse University Hospital commits to MR-004 compliance. After evaluation by the Data Protection Officer and in accordance with the General Data Protection Regulation (EU) 2016/679, a report confirmed the adherence of the study to all criteria. It is registered on the Toulouse University Hospital Retrospective Studies Register (RNIPH 2021–121) and covered by MR-004 (CNIL Number: 2,206,723 v 0). Toulouse University Hospital approved the study entitled "Confocal Endomicroscopy for Lung Transplant In Vivo Cellularity Sight" (Ref CHU: 22 414C) on 10th October 2022, affirming full compliance with ethics requirements in the mentioned report.
Statistical analysisQuantitative variables, expressed as median (interquartile range), were compared using Mann-Whitney tests. Qualitative variables, expressed as numbers (%), were compared with χ2 or Fisher's Exact test as appropriate. In all statistical analyses, significance was defined as a two-tailed p-value less than 0.05. The levels of significance were denoted as follows: *p < 0.05, **p < 0.01, ***p < 0.001, ****p < 0.0001. All statistical and graph analysis was performed using GraphPad version 8.
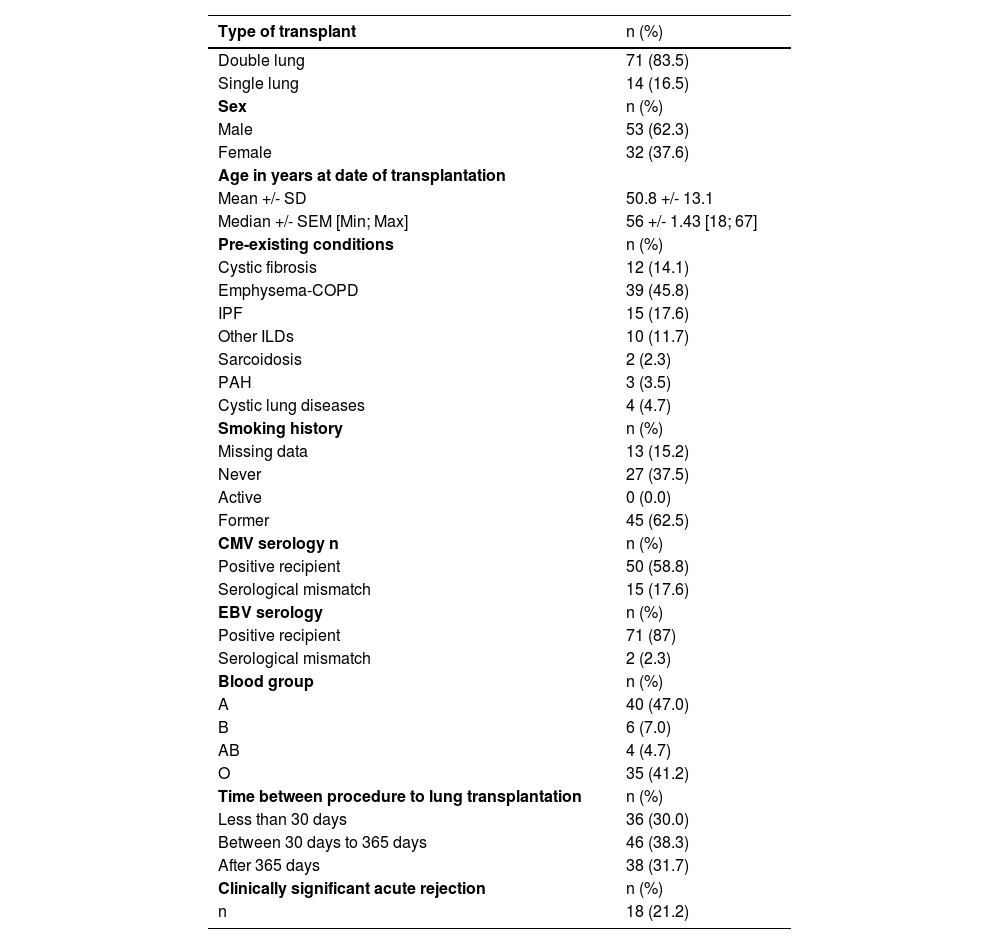
ResultsDemographic dataBetween January 2015 and April 2022, 85 patients who underwent bronchoscopies with both TBBs and pCLE imaging were screened. Population characteristics are summarised in Table 1. Among 85 total participants, 53 were men (62.3 %). The mean (+/-standard deviation) age at transplantation was 51(+/−13.1) years. The most common indications for lung transplantation were emphysema-COPD (45.9 %) followed by interstitial lung disease (29.4 %) and cystic fibrosis (14 %).
Population characteristics.
Data are reported as Mean +/- Standard Deviation and Median +/- Standard Error of the Mean [Minimum; Maximum] for continuous variables and as numbers (percentage) for categorical variables. Abbreviations: SD: Standard Deviation; Min: Minimum; Max: Maximum; SEM: Standard Error of the Mean; COPD: Chronic Obstructive Pulmonary Disease; IPF: Idiopathic Pulmonary Fibrosis; ILD: Interstitial Lung Disease; PAH: Pulmonary Arterial Hypertension.
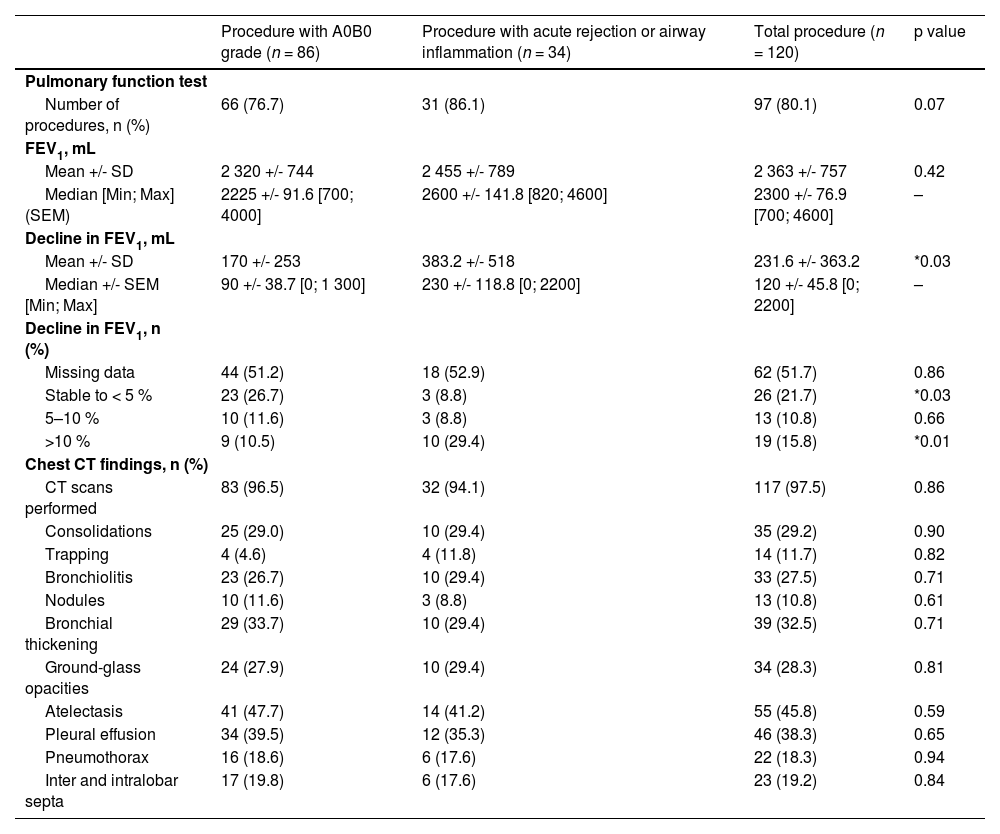
The results are set out in Table 2. Two FEV1 measurements (in the previous 4 months and just before the procedure (48 h)) were available for 97 procedures (80.8 %; Table 2). The decline in FEV1 between the two tests was greater in patients with abnormal histological samples than in other patients (−383 ml vs. −170 ml; p = 0.06) (Table 2). Computed tomography imaging was available for 111 procedures (97.5 %) two weeks prior to the bronchoscopy. None of the chest abnormalities were associated with abnormal histological findings (Table 2). The mean C-reactive protein level was 11.6(+/- 21.4) mg/l and no statistically significant difference was identified between patients with or without abnormal histological findings (p = 0.38).
Pulmonary function test and computed tomography imaging in lung transplant recipients before bronchoscopy.
Data are reported as Mean +/- Standard Deviation and Median +/- Standard Error of the Mean [Minimum; Maximum] for continuous variables and as numbers (percentage) for categorical variables. Quantitative variables, expressed as median were compared using Mann-Whitney tests. Qualitative variables, expressed as numbers (%), were compared with χ2 or Fisher's Exact test was used to weigh up each parameter (*p < 0.05, **p < 0.01, ***p < 0.001, ****p < 0.0001). Abbreviations: SD: Standard Deviation; Min: Minimum; Max: Maximum; SEM: Standard Error of the Mean; FEV1: Forced Expiratory Volume in the First Second; CT: Computed Tomography; mL: Millilitre.
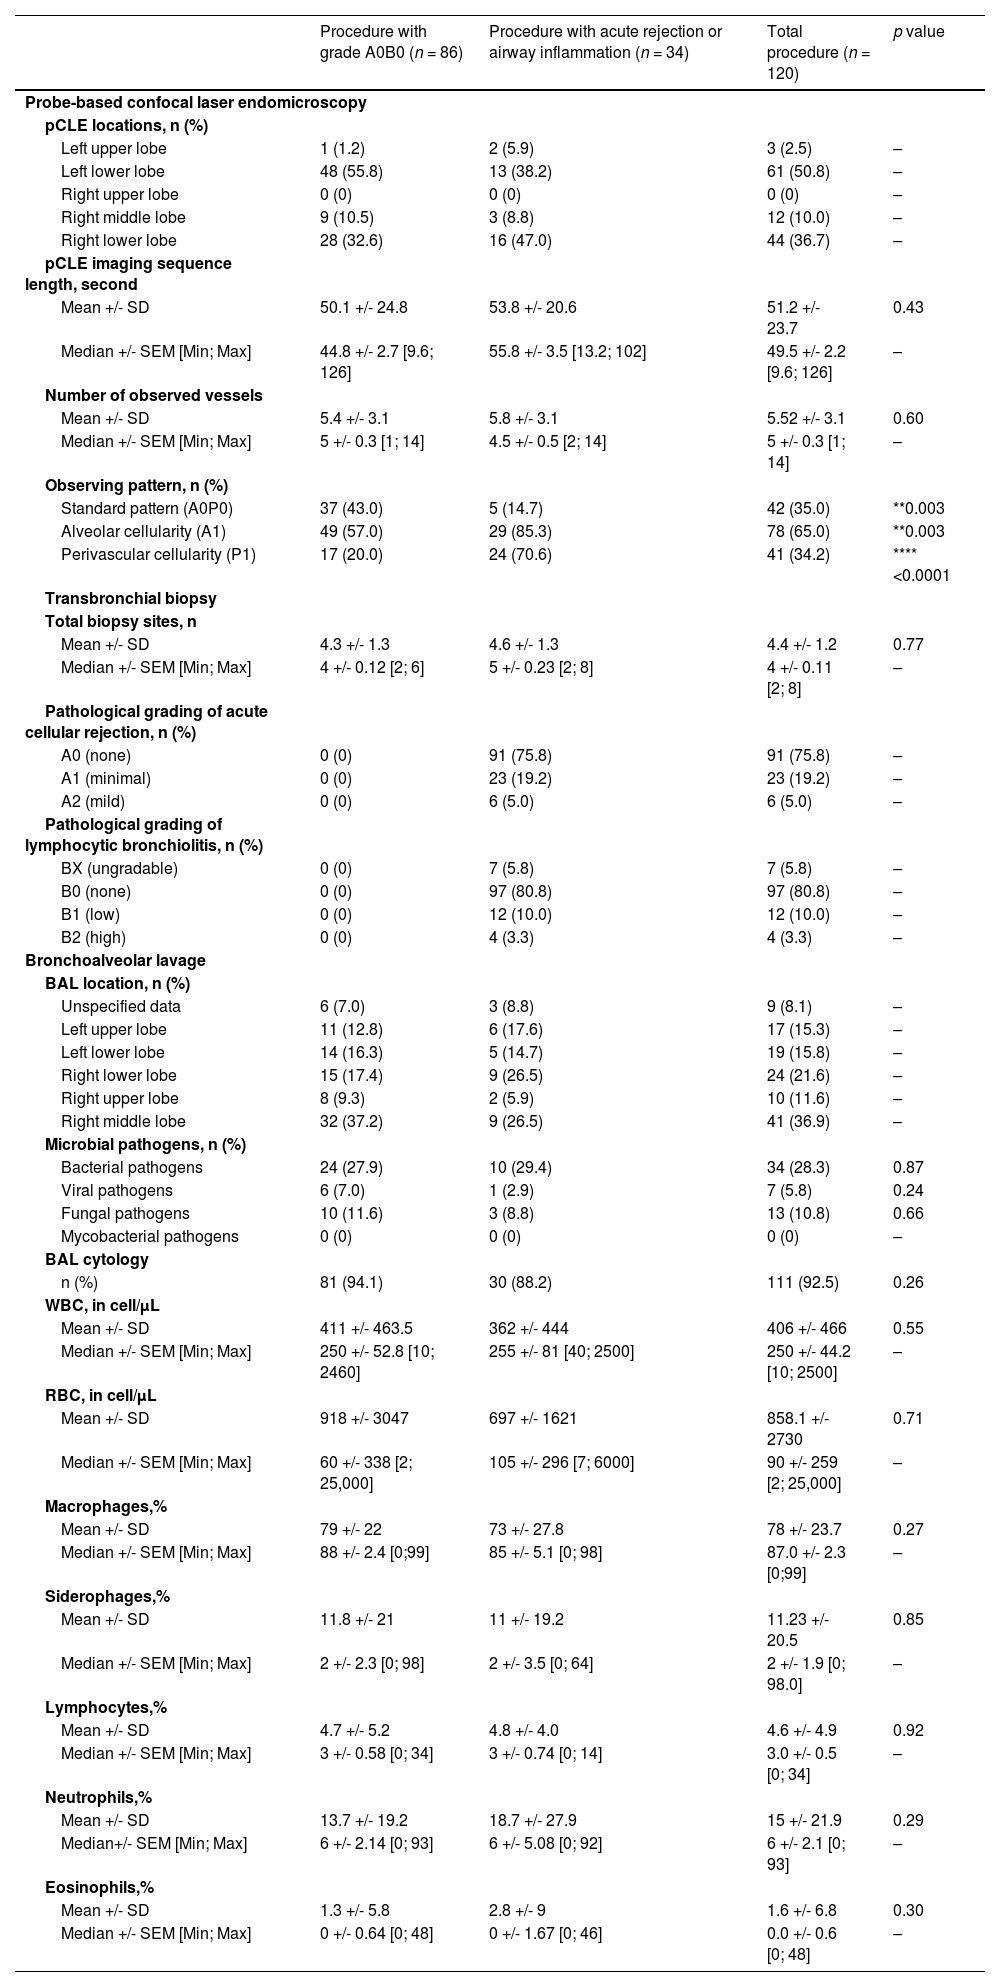
A total of 120 procedures in 85 patients with both TBBs and pCLE imaging were conducted (Table 3). Systematic bronchoscopies, constituting 68 % of the procedures, were primarily carried out during the initial year. Subsequent TBBs, performed during follow-up, were guided by pulmonologists relying on a combination of clinical assessments, functional evaluations and imaging results (see Fig. 1). Transbronchial biopsies were executed after pCLE sequences with a median of 4.4 biopsies per procedure (Table 3). Notably, the lower lobes were the most frequently sampled. A total of three serious adverse events were recorded, constituting 2.5 % of cases, including one alveolar haemorrhage necessitating blood transfusion and two pneumothoraxes. Grade A0B0 was observed in 86 TBBs (71.7 %), while 34 (28.3 %) showed histological abnormalities. C4d deposition was negative for all patients. Retrospectively, 18 patients received intravenous methylprednisolone pulse therapy for three days (10–15 mg kg-1 per day). Treatment was administered to all patients with histological grades A2 (n = 6) and B2 (n = 4) as well as 47.8 % (11 out of 23) with grade A1. Patients not receiving treatment included those with minimal rejection detected in control TBBs following prior therapy. Other individuals benefitted from active surveillance and controlled TBBs during the follow-up.
Bronchoscopy data.
Data are reported as Mean +/- Standard Deviation and Median +/- Standard Error of the Mean [Minimum; Maximum] for continuous variables and as numbers (percentage) for categorical variables. Quantitative variables, expressed as median, were compared using Mann-Whitney tests. Qualitative variables, expressed as numbers (%), were compared with χ2 or Fisher's Exact test was used to weigh up each parameter (*p < 0.05, **p < 0.01, ***p < 0.001, ****p < 0.0001). Abbreviations: pCLE: Probe-Based Confocal Laser Endomicroscopy; A0P0: absence of alveolar and perivascular cellularity, A1: presence of alveolar cellularity, P1: presence of perivascular cellularity, BAL: Bronchoalveolar Lavage; WBC: White Blood Cells; RBC: Red Blood Cells.
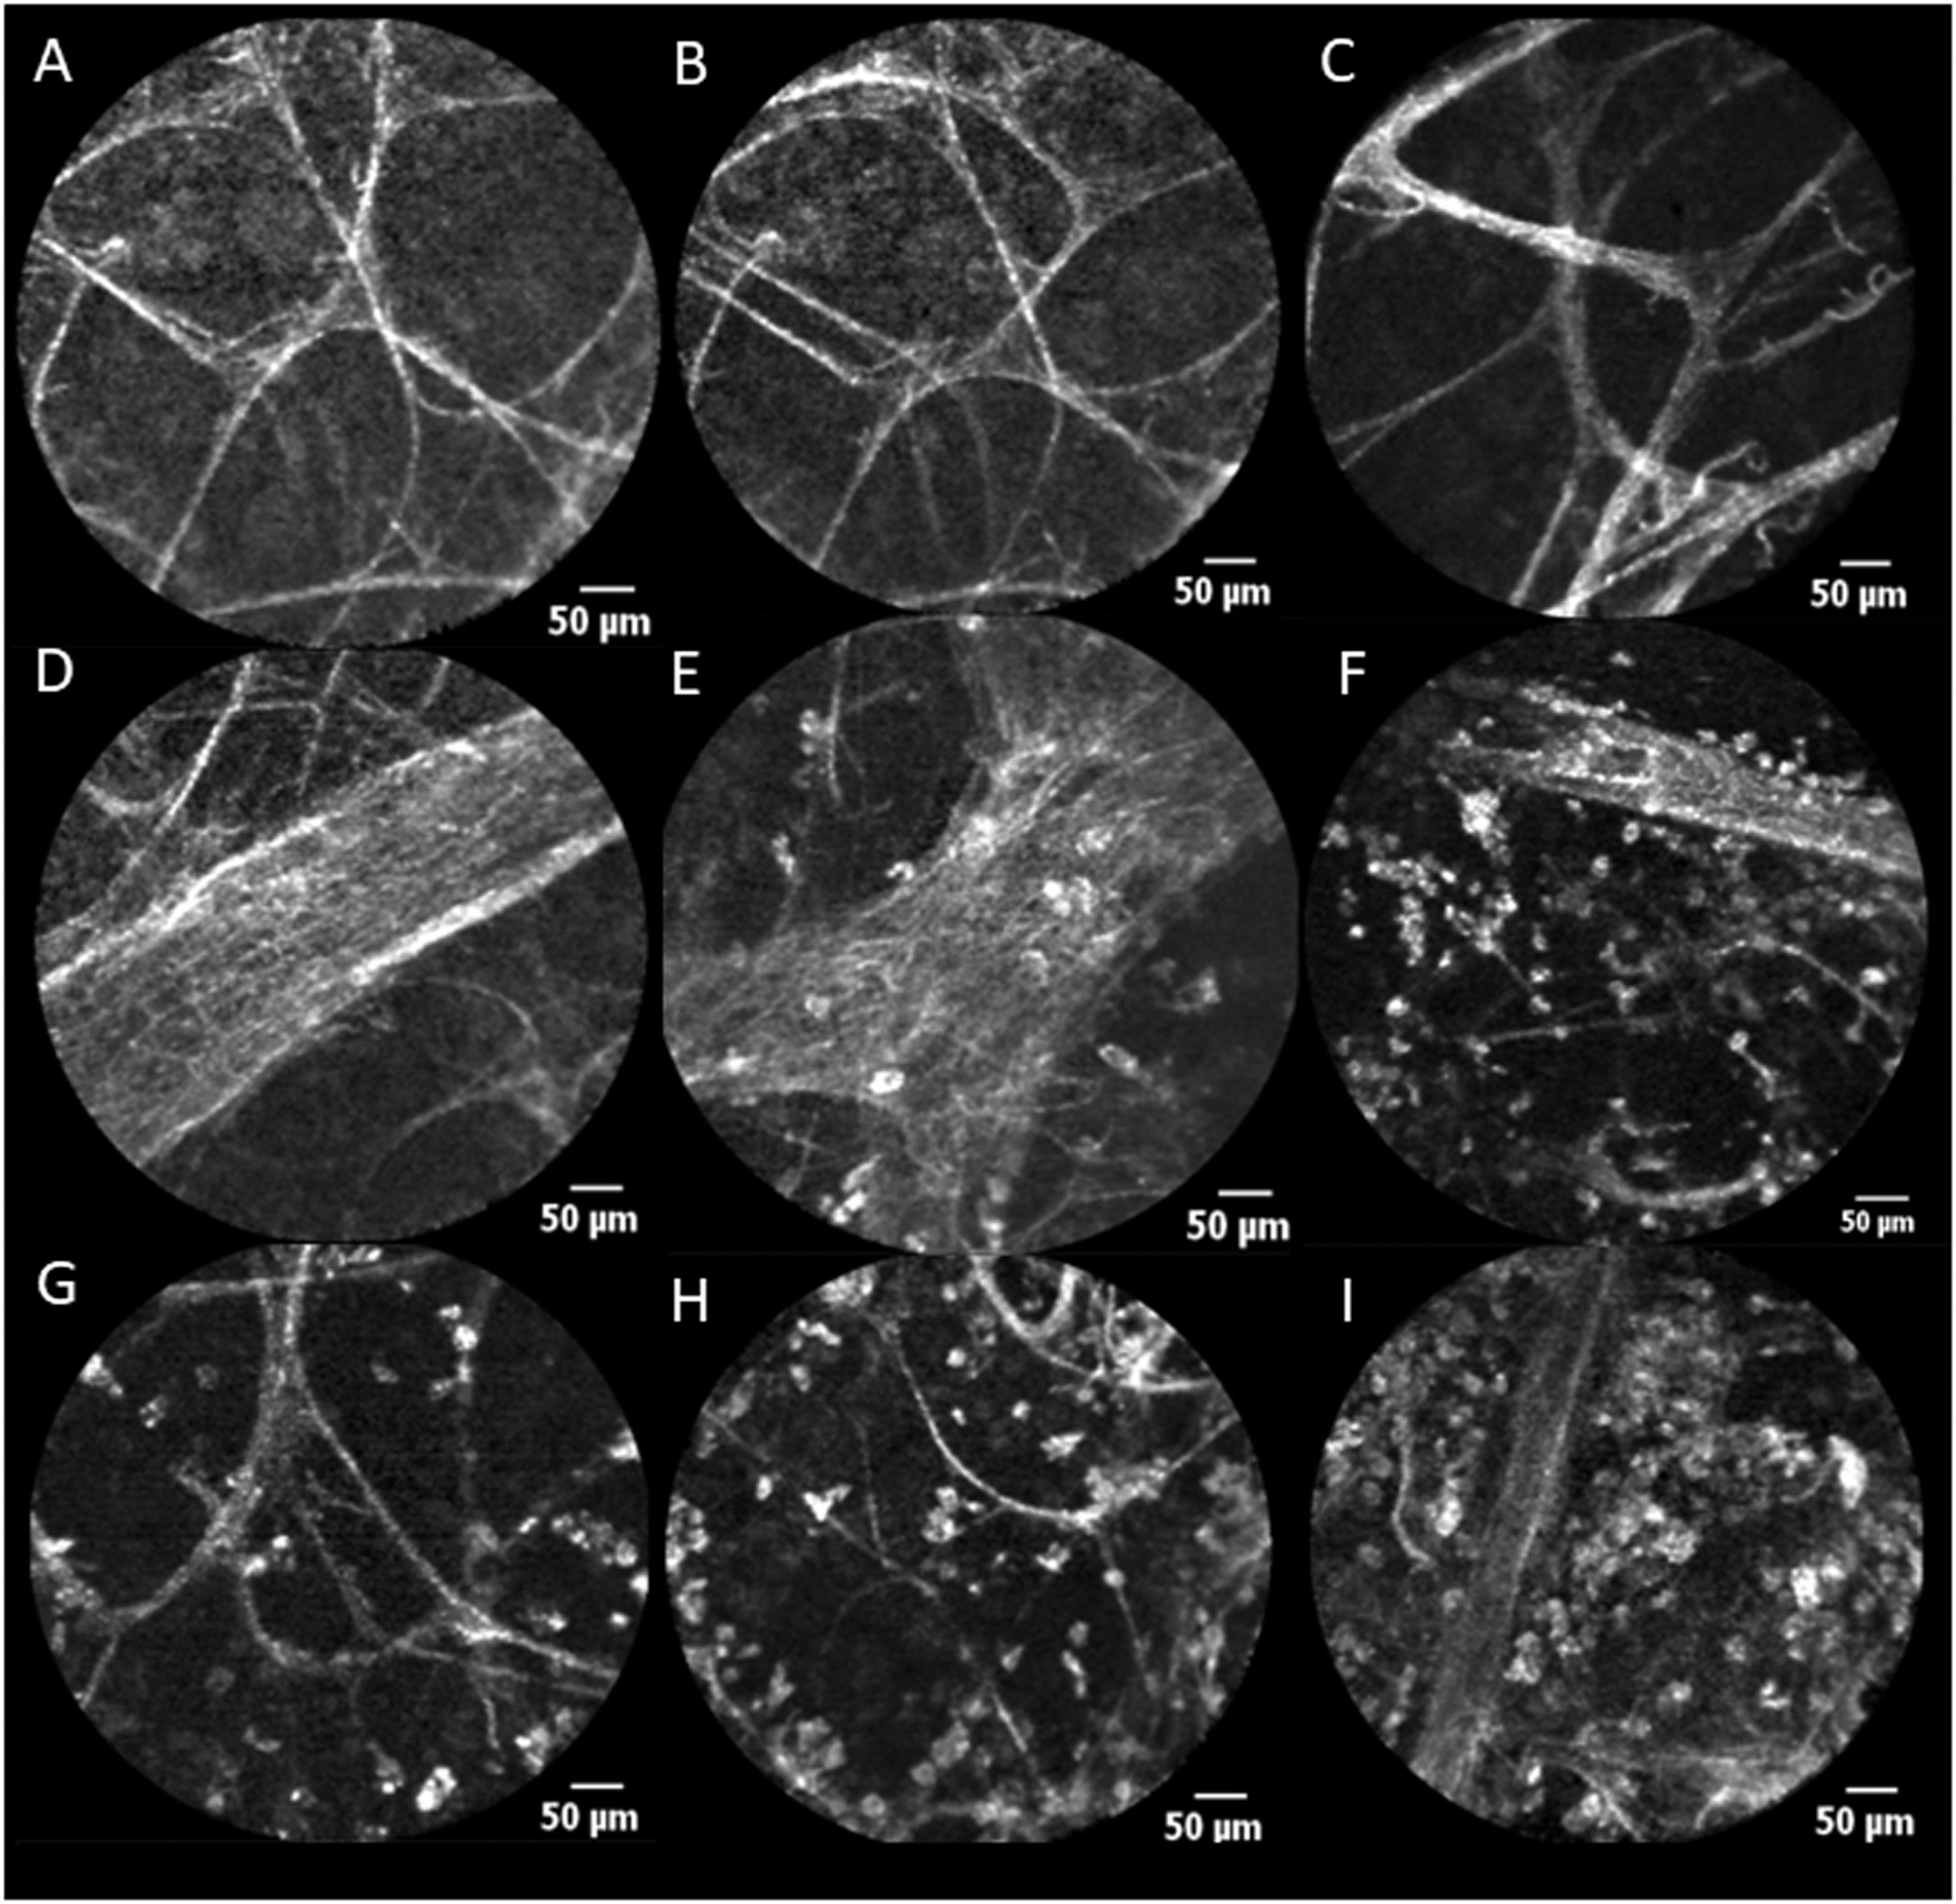
. A, B and C: Alveoli with alveolar cellularity absent (A0). D: Vessels with negative vascular cellularity: vascular structures observed without perivascular cellularity (P0). E, F: Vessels with positive perivascular cellularity: vascular structures with increased perivascular cellularity (A1P1). G, H: Alveolar cellularity: cells present within alveolar structures (A1). I: Alveolar cellularity without PVC (A1P0).")
pCLE Features (Scale=50 μ). A, B and C: Alveoli with alveolar cellularity absent (A0). D: Vessels with negative vascular cellularity: vascular structures observed without perivascular cellularity (P0). E, F: Vessels with positive perivascular cellularity: vascular structures with increased perivascular cellularity (A1P1). G, H: Alveolar cellularity: cells present within alveolar structures (A1). I: Alveolar cellularity without PVC (A1P0).
The mean duration of the pCLE “alveoloscopy” procedure was 51 s. Assessment of alveolar (ALC) and perivascular cellularity (PVC) is illustrated in Fig. 1. ALC and PVC ranged from absent (A0 and P0 respectively) to present (A1 and P1 respectively) within alveolar structures (Fig. 1). The mean number of vessels viewed was 5.5 per procedure (Table 3). For 48.3 % of the procedures where data are available, there was no correlation between abnormal pCLE pattern and a decline in lung function (p = 0.80). None of the 18 patients treated for AR exhibited a normal pCLE alveoloscopy (p = 0.003).
Comparison between pCLE imaging and histological findingsThe presence of PVC and ALC in pCLE imaging demonstrated statistically significant associations with abnormal histopathological findings (****p<0.0001 and **0.003 respectively). We evaluated the sensitivity (Se), specificity (Spe), positive predictive value (PPV) and negative predictive value (NPV) of ALC and PVC in pCLE against histological samples obtained via TBBs. For ALC, the Se, Spe, PPV and NPV were 85.3 %, 43 %, 37.2 % and 88.1 % respectively. The Se corresponded to 70.6 %, Spe 80.2 %, PPV 58.5 % and NPV 87.3 % for PVC. The intra-interpreter correlation (TV) was 88.3 % for the number of vessels (+/−1), 98.3 % for ALC and 90 % for PVC. In terms of inter-interpreter correlation between the two physicians (TV and MS), it was 80 % for the number of vessels (+/−1), 97.5 % for ALC and 83.3 % for PVC.
BAL and microbial and cellular analysisResults from BALs obtained during the procedure are detailed in Table 3. A lower respiratory tract microbial pathogen was identified in 49 patients (41 % of procedures). Viral (p = 0.39), bacterial (p = 0.87) and fungal (p = 0.24) pathogen levels found in BAL fluid as well as the rates of antibiotics delivered (p = 0.63) showed no significant differences between patients with and without abnormal histological findings. Additionally, the distribution of cell populations in BAL fluid demonstrated comparable patterns as detailed in Table 3.
DiscussionPreliminary observations using pCLE in lung transplant recipients have shown the potential of this technology to identify AR patterns.15,16 In spite of these intriguing data, the role played by pCLE in the routine diagnostic approach for AR is peripheral. By retrospectively analysing bronchoscopies with pCLE and TBBs, we assessed whether pCLE reliably identifies histopathological changes associated with AR in lung transplant recipients.
We describe the most prominent series of pCLE imaging in lung transplants with 85 patients and 120 procedures during the recruitment period (2015–2022). In lung transplant surveillance, pulmonary function assessment and CT imaging typically serve as supplementary components to the clinical evaluation process of AR. Consistent with findings in the existing literature, our study reveals that radiological indicators associated with AR lack specificity.17,18 The variations in FEV1, available for less than half of the procedures primarily due to post-operative conditions, were also not specific and are known to poorly discriminate infections from AR.19
Yserbyt et al proposed the utility of pCLE in diagnosing AR, showing a substantial difference in cellularity between AR and non-AR patients with a median cell count of 50 cells per pCLE field in AR versus 10 cells in controls.15 Their study also explored cellular autofluorescence, noting significantly higher levels in the AR group (73 % of frames) compared to controls (42 %).15 Observing these features, Yserbyt et al assessed the risk of AR, achieving a sensitivity of 93 %.15 In the study by Keller et al which analysed 30 pCLE procedures on 24 patients, 8 procedures showed AR in TBBs. They found that both alveolar and perivascular cellularities are reliable indicators for AR assessment.16 Notably, PVC outperformed ALC and the number of blood vessels identified with PVC correlated significantly with the histologic grade of AR.16
We suggest very simple pCLE criterion based on the presence or absence of ALC and PVC to assess the risk of AR during routine bronchoscopy. A less than one minute mean duration for pCLE sequences enables prompt but efficient evaluation of cellularity. Alveolar and perivascular cellularities in pCLE offer straightforward, real-time information that can assist users in determining the need for TBBs and may guide the sampling process.
Alveolar cellularity demonstrated favourable Se (85.3 %) and NPV (88.1 %) but lower Spe (43 %) and PPV (37.2 %). The lower Spe and PPV for ALC compared to PVC may be explained by the fact that alveolar fluorescent cells could be observed in other conditions such as smoking exposure 10,20 or infections.21 During the post-transplantation period, the estimated prevalence of smoking, whether assumed or actively practised, is approximately 10–15 %.22,23 Consequently, there is a likelihood of under-reporting tobacco consumption among our cohort with a potential for false positive identification of ALC and this could explain the lower Spe and PPV for ALC compared with PVC. PVC displayed notably higher specificity (80.2 % Spe) than ALC as explained earlier. Perivascular cellularity might function as a visible real-time in vivo marker for perivascular infiltration observed in high-grade rejection. However, its sensitivity (70.6 %) was somewhat reduced, possibly due to the importance of detecting multiple vessels during the procedures. Our analysis, which focuses on identifying cellularities, indicates that integrating the technique into routine practice is highly feasible and supported by strong intra and inter-interpreter agreement. To evaluate PVC, our experience and data suggest that a minimum observation of five vessels per procedure constitutes good specificity (80.2 %). Several notable findings emerged regarding the use of pCLE imaging to assess the risk of AR in lung transplant recipients.
A significant observation in our study is that all 18 patients treated for clinically significant AR demonstrated abnormal pCLE sequences. Consequently, when standard pCLE imaging (A0P0) is identified during extended follow-up (beyond the first-year post-transplantation where the risk of AR is less prominent), we suggest, with due consideration (from an experienced user and pCLE interpreter), that TBBs can be deferred in specific cases such as those involving single lung transplants. Finally and consistent with other authors in the literature, we report a low rate of adverse events with pCLE 15,16 which is notably less invasive than TBBs.8
The use of the standard histopathological criterion as the gold standard may be criticised, leading to potential misinterpretation of pCLE performance. Correlations between pCLE imaging and TBBs showed disparities due to imaged locations not precisely matching sampled tissue sites. Suboptimal sampling in our study, averaging 4.4 alveolate tissue samples instead of the recommended five, poses a risk of false-negative endoscopy results.6 An inherent variability in the interpretation of pathology has been highlighted in previous studies.24,25 Notably, pathological specimens in our study did not undergo evaluation through a double-blinded approach. With histological outcomes from TBBs established as the gold standard, false-negative TBB results may lead to a misinterpretation of pCLE performance wherein false negatives are incorrectly identified as true negatives and true positives are inaccurately classified as false positives. The fact that all patients who were treated for AR had abnormal pCLE images however plays in favour of the clinical relevance of pCLE as a non-invasive tool for AR screening. We envision the integration of pCLE imaging into the diagnostic algorithm for AR, complementing existing clinical, paraclinical and histological tools. The potential detection of microvessels, ALC and PVC facilitated by computer-assisted analysis during pCLE acquisition is an encouraging avenue. The implementation of standardised training programmes holds promise for improving pCLE interpretation among less-experienced users. Future investigations are needed to assess whether abnormal pCLE characteristics might also exhibit associations with chronic lung allograft dysfunction.
ConclusionOur study demonstrates the feasibility of incorporating pCLE into clinical practice, demonstrating good diagnostic yield and reproducible outcomes in the screening of AR in lung transplant recipients. Large randomised controlled trials are needed to confirm the data obtained in our retrospective study.


