
Invasive mechanical ventilation (IMV) is a common practice in pediatric intensive care unit (PICU). However, the role of oxygenation (OI) and ventilation (VI) indices regarding the time on IMV has not been fully understood.
Basic proceduresThe study was conducted with infants up to 24 months of age, hospitalized in PICU for two consecutive years. The values of ventilatory parameters, OI, VI, and blood gas of infants, collected in the first seven days in IMV, were associated with the time on IMV. IMV was classified into: short (≤seven days) and long time (>seven days). The comparison was made from the first to the seventh day. Alpha=0.05.
Main findingsOf 142 infants [mean age=7.51±6.33 months], 59 (41.5%) remained on IMV for a short time and 83 (58.5%) for a long time. Differences in PaO2 values were found on the second day, and PaO2/FiO2 ratio on the second, third and fourth days, with higher values in the short-term IMV. For FiO2 from the second to the fifth day; Pinsp from the first to the seventh day; PEEP from the second to the sixth day; mechanical respiratory frequency from the second to the seventh day, PaCO2 on the second day; Paw from the first to the seventh day, OI from the second to the sixth day, and VI from the first to the seventh day, the values were higher in the long-term IMV.
ConclusionsThe OI and VI can be considered as potential predictors of long-term IMV, along with other markers obtained during the IMV.
Lungs of infants and children are not miniature lungs of an adult; numerous changes and remodeling occur from birth to adulthood.
Tighter peripheral airways seem to be an important risk factor for respiratory disease in infancy. In the newborn period and even in the first years of life, corticosteroids, mechanical ventilation (MV), oxygen, malnutrition, and inflammation may interfere with alveolarization.1
Recently, MV has become a common practice in the pediatric intensive care unit (PICU). Lung disease is the main indication for ventilatory support in children; however, MV may be applied in numerous circunstances.2 In the PICU about 30% (20% to 64%) of patients are mechanically ventilated with an average of five to six days on invasive mechanical ventilation (IMV).3,4 Approximately, 17% to 41% of the patients require MV for periods longer than 12h.5
The time on MV is directly associated with infection in patients, upper airway trauma, longer hospital stay, more complications, stress, increase in the cost of treatment, and increased mortality.6–13 The negative results of delayed or premature extubation, such as increased morbidity, mortality and costs,4 led to efforts to improve the predictive factors for extubation outcome and time on IMV. The ability of the traditional indicators of weaning (respiratory rate, tidal volume, maximal inspiratory pressure, and frequency–tidal volume ratio) to discriminate children with successful extubation and those requiring reintubation are limited.3 The respiratory monitoring of critically ill patients is crucial to revealing the physiological variables that will predict the success or failure of weaning.13
Studies on the oxygenation (OI) and ventilation (VI) indices have shown positive correlation with the time on MV, aiding in the discovery of the patient's prognosis during the early stage of the disease, so the IMV is installed. The OI and VI can be measured at the bedside.
In this context, the study aimed at associating OI and VI values, other ventilatory markers, and blood gas with the time infants spend on IMV in a PICU.
Material and methodsA descriptive cross-sectional study was conducted in a PICU of a 20-bed Pediatric Therapy Unit of the Hospital de Clínicas – University of Campinas (Unicamp). In our data, 142 patients were included and submitted to IMV, from 28 days to 24 months, admitted during two consecutive (2014 and 2015) years. The Ventilador Inter™ 5 Plus (Intermed Equipamento Médico Hospitalar®, São Paulo, Brazil) was used in our study. The study was approved by the University Research Ethics Committee from University of Campinas (#226/2008). The informed consent form was obtained from the primary caregivers of the patients included in the study.
The inclusion criteria were: age between 28 days and 24 months; intubation and IMV initiated during the study period; extubation during the study period; and permanence on IMV for at least 24h.
The exclusion criteria were: transfer of the infant from the unit before extubation; transfer of the intubated infant from another hospital; subsequent intubation of infants already included; neonates and patients suffering conditions associated with venous admixture to arterial blood. In our data, there were no patients without a cuffless tube to be excluded.
All patients enrolled underwent endotracheal intubation (cuffed tube) prior to IMV initiation in synchronized intermittent mandatory ventilation (SIMV) mode, time-cycled and pressure-limited. In our service, at the time of the study, the patients were in SIMV mode for weaning. We did not use pressure support during weaning, and no patient used volume control ventilation nor had noninvasive ventilation prior to reintubation.
Indication for weaning and extubation were performed by interdisciplinary clinical decision. Although there is no specific weaning protocol in the referenced PICU, the conditions for extubation were: improvement or resolution of the underlying cause of acute respiratory failure; ability to perform gas exchange spontaneously, verified by oxygen saturation and blood gas, without respiratory distress; and achievement of hemodynamically stability. The ventilatory parameters considered appropriate for extubation were: fraction of inspired oxygen (FiO2)≤0.4, peak inspiratory pressure (PIP)≤25cm H2O, positive end-expiratory pressure (PEEP)≤5cm H2O, respiratory rate≤10 cycles per minute. The weaning was achieved gradually by reducing the mechanical respiratory frequency (FRmec) of SIMV concomitantly with the reduction of pressures of the same ventilatory mode, maintaining the values of gas exchange and pH within physiological limits. Extubation failure was defined as reintubation and need for IMV within 48h.
The clinical and laboratory markers collected from medical records were: age, gender, diagnosis, date and time of intubation, date and time of extubation, parameters of IMV [airway inspiratory pressure (Pinsp), FiO2, PEEP and FRmec] and variables of arterial blood gas [partial pressure of oxygen (PaO2) and carbon dioxide (PaCO2)]. Data on blood gas of the first seven days on IMV along with the data of the respective MV parameters were collected and used to calculate OI and VI. The first blood gas analysis values obtained 20min after intubation and initiation of positive pressure ventilation were used, and each day, during seven days, blood gas values were collected from IMV patients to calculate OI, VI and PaO2/FiO2 ratio. The arterial blood gas sample was collected every day, approximately 24h after the previous collection, and no arterial line was applied.
The measure of OI and VI was performed as follows: OI=[FiO2×Paw (mean airway pressure)×100]/PaO2 and VI=(PaCO2×PIP×FRmec)/1000. The Paw was calculated as follow: PEEP+(PIP-PEEP)/3. No normal values were found for OI and VI, since the indices are measured in sick, intubated and ventilated patients.
Statistical analysis was performed by the association within ventilatory parameters, OI, VI and blood gas variables collected from 142 infants throughout the first seven days of IMV with the time the patient remained on IMV divided into two groups: ≤seven days or >seven days. Moreover, the OI and VI data were compared between the group of patients who died during the study and the others, relating to the seven days analyzed. IMV indication was compared with the time on IMV and the OI and VI values, over the seven days analyzed. Finally, the failed extubation was compared with the OI and VI values in all days analyzed.
Statistical analysis was performed by Statistical Package for Social Sciences version 21 (SPSS Inc., Chicago, IL, USA). For statistical analysis, the groups of patients, of less and more than seven days on IMV, were compared by the nonparametric Mann–Whitney U test. The difference between the days for OI and VI was calculated by the Friedman's Two-Way Analysis of Variance test. The association between time on IMV and IMV indication was performed by the χ2 test. We adopted α (alpha)=0.05. The nonparametric distribution was analyzed by the Shapiro–Wilk test and Kolmogorov–Smirnov test.
ResultsThe study enrolled 142 infants, where 83 (58.5%) were male, with mean age of 7.51±6.33 months and mean weight of 6.18±3.38kg. The rate of IMV for short (≤7 days) and long time (>7 days) in the sample enrolled was, respectively, 41.5% (59 infants) and 58.5% (83 infants). The rate of failed extubation was 26 (18.3%), and there were 24 deaths (16.9%). No difference was found between the sex of the patient on IMV for short (≤7 days, males=33/59) and long time (>7 days, males=49/83) (p-value=0.73).
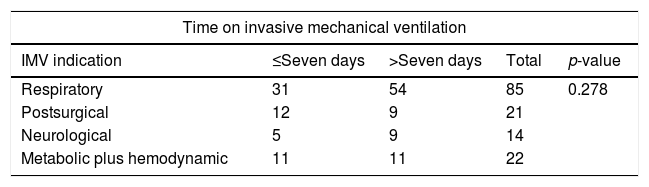
Table 1 shows the patients’ distribution per indication for IMV. No difference was observed between IMV indication for short (≤7 days) and long time (>7 days) (p-value=0.278). Regarding the IMV indication and presence of failed extubation, no association was achieved (p-value=0.929). However, we observed a higher odds ratio of death in patients with IMV indication due to Metabolic plus hemodynamic problem (OR=4.846; 95%CI=1.77–13.27; p-value=0.018).
Distribution of infants per invasive mechanical ventilation indication.
| Time on invasive mechanical ventilation | ||||
|---|---|---|---|---|
| IMV indication | ≤Seven days | >Seven days | Total | p-value |
| Respiratory | 31 | 54 | 85 | 0.278 |
| Postsurgical | 12 | 9 | 21 | |
| Neurological | 5 | 9 | 14 | |
| Metabolic plus hemodynamic | 11 | 11 | 22 | |
| Progression to death | ||||
|---|---|---|---|---|
| IMV indication | Yes | No | Total | p-value |
| Respiratory | 10a | 75 | 85 | 0.018 |
| Postsurgical | 4b | 17 | 21 | |
| Neurological | 1c | 13 | 14 | |
| Metabolic plus hemodynamic | 9d | 13 | 22 | |
| Extubation failure | ||||
|---|---|---|---|---|
| IMV indication | Yes | No | Total | p-value |
| Respiratory | 16 | 69 | 85 | 0.929 |
| Postsurgical | 4 | 17 | 21 | |
| Neurological | 3 | 11 | 14 | |
| Metabolic plus hemodynamic | 3 | 19 | 22 | |
IMV, invasive mechanical ventilation; N, number of patients. The statistical analysis was performed by the χ2 test. The positive p-value is set in bold. Alpha=0.05.
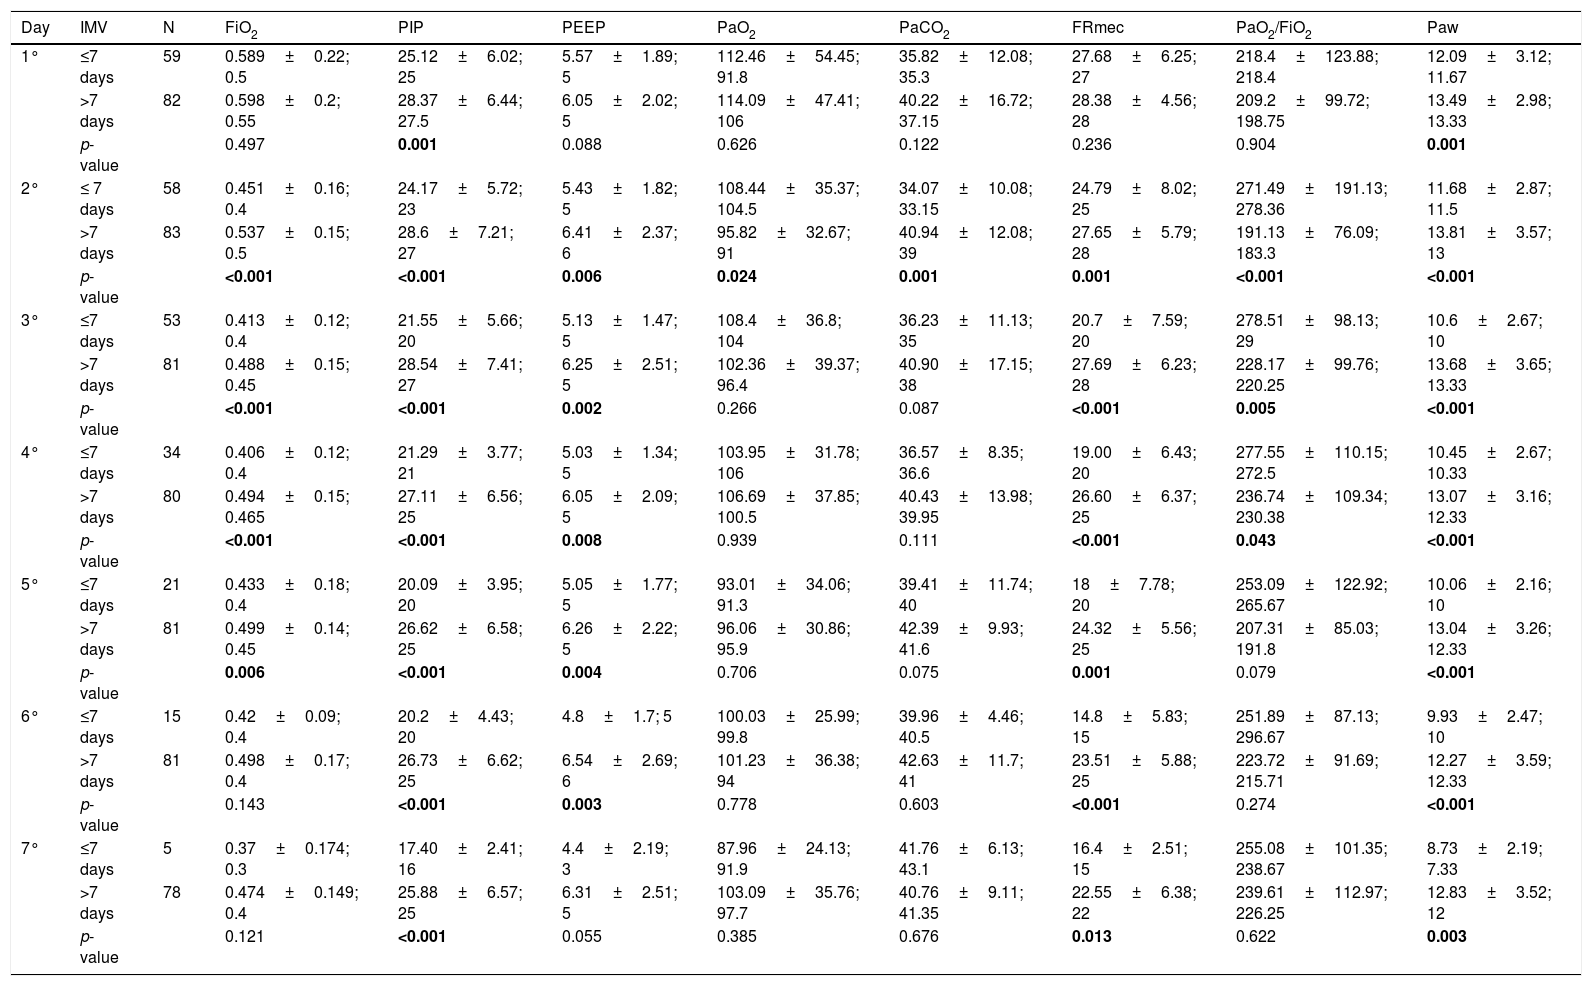
Table 2 shows the variables that were analyzed in the first seven days of IMV, comparing infants who remained on IMV for short and long time. There were differences in mean values of FiO2 from the second to the fifth day; PIP from the first to the seventh day; PEEP from the second to the sixth day; PaO2 on the second day; PaO2/FiO2 on the second, third and fourth days, and Paw from the first to the seventh day (p-value<0.05). Moreover, the pH values were the same between the groups evaluated (p-value>0.05), except for the second day (p-value=0.006); ≤7 days, median=7.42 (minimum to maximum=7–7.64); >7 days=7.36 (minimum to maximum=7.11–7.64).
The invasive mechanical ventilation variables of infants who were ≤7 days and >7 days on invasive mechanical ventilation.a
| Day | IMV | N | FiO2 | PIP | PEEP | PaO2 | PaCO2 | FRmec | PaO2/FiO2 | Paw |
|---|---|---|---|---|---|---|---|---|---|---|
| 1° | ≤7 days | 59 | 0.589±0.22; 0.5 | 25.12±6.02; 25 | 5.57±1.89; 5 | 112.46±54.45; 91.8 | 35.82±12.08; 35.3 | 27.68±6.25; 27 | 218.4±123.88; 218.4 | 12.09±3.12; 11.67 |
| >7 days | 82 | 0.598±0.2; 0.55 | 28.37±6.44; 27.5 | 6.05±2.02; 5 | 114.09±47.41; 106 | 40.22±16.72; 37.15 | 28.38±4.56; 28 | 209.2±99.72; 198.75 | 13.49±2.98; 13.33 | |
| p-value | 0.497 | 0.001 | 0.088 | 0.626 | 0.122 | 0.236 | 0.904 | 0.001 | ||
| 2° | ≤ 7 days | 58 | 0.451±0.16; 0.4 | 24.17±5.72; 23 | 5.43±1.82; 5 | 108.44±35.37; 104.5 | 34.07±10.08; 33.15 | 24.79±8.02; 25 | 271.49±191.13; 278.36 | 11.68±2.87; 11.5 |
| >7 days | 83 | 0.537±0.15; 0.5 | 28.6±7.21; 27 | 6.41±2.37; 6 | 95.82±32.67; 91 | 40.94±12.08; 39 | 27.65±5.79; 28 | 191.13±76.09; 183.3 | 13.81±3.57; 13 | |
| p-value | <0.001 | <0.001 | 0.006 | 0.024 | 0.001 | 0.001 | <0.001 | <0.001 | ||
| 3° | ≤7 days | 53 | 0.413±0.12; 0.4 | 21.55±5.66; 20 | 5.13±1.47; 5 | 108.4±36.8; 104 | 36.23±11.13; 35 | 20.7±7.59; 20 | 278.51±98.13; 29 | 10.6±2.67; 10 |
| >7 days | 81 | 0.488±0.15; 0.45 | 28.54±7.41; 27 | 6.25±2.51; 5 | 102.36±39.37; 96.4 | 40.90±17.15; 38 | 27.69±6.23; 28 | 228.17±99.76; 220.25 | 13.68±3.65; 13.33 | |
| p-value | <0.001 | <0.001 | 0.002 | 0.266 | 0.087 | <0.001 | 0.005 | <0.001 | ||
| 4° | ≤7 days | 34 | 0.406±0.12; 0.4 | 21.29±3.77; 21 | 5.03±1.34; 5 | 103.95±31.78; 106 | 36.57±8.35; 36.6 | 19.00±6.43; 20 | 277.55±110.15; 272.5 | 10.45±2.67; 10.33 |
| >7 days | 80 | 0.494±0.15; 0.465 | 27.11±6.56; 25 | 6.05±2.09; 5 | 106.69±37.85; 100.5 | 40.43±13.98; 39.95 | 26.60±6.37; 25 | 236.74±109.34; 230.38 | 13.07±3.16; 12.33 | |
| p-value | <0.001 | <0.001 | 0.008 | 0.939 | 0.111 | <0.001 | 0.043 | <0.001 | ||
| 5° | ≤7 days | 21 | 0.433±0.18; 0.4 | 20.09±3.95; 20 | 5.05±1.77; 5 | 93.01±34.06; 91.3 | 39.41±11.74; 40 | 18±7.78; 20 | 253.09±122.92; 265.67 | 10.06±2.16; 10 |
| >7 days | 81 | 0.499±0.14; 0.45 | 26.62±6.58; 25 | 6.26±2.22; 5 | 96.06±30.86; 95.9 | 42.39±9.93; 41.6 | 24.32±5.56; 25 | 207.31±85.03; 191.8 | 13.04±3.26; 12.33 | |
| p-value | 0.006 | <0.001 | 0.004 | 0.706 | 0.075 | 0.001 | 0.079 | <0.001 | ||
| 6° | ≤7 days | 15 | 0.42±0.09; 0.4 | 20.2±4.43; 20 | 4.8±1.7; 5 | 100.03±25.99; 99.8 | 39.96±4.46; 40.5 | 14.8±5.83; 15 | 251.89±87.13; 296.67 | 9.93±2.47; 10 |
| >7 days | 81 | 0.498±0.17; 0.4 | 26.73±6.62; 25 | 6.54±2.69; 6 | 101.23±36.38; 94 | 42.63±11.7; 41 | 23.51±5.88; 25 | 223.72±91.69; 215.71 | 12.27±3.59; 12.33 | |
| p-value | 0.143 | <0.001 | 0.003 | 0.778 | 0.603 | <0.001 | 0.274 | <0.001 | ||
| 7° | ≤7 days | 5 | 0.37±0.174; 0.3 | 17.40±2.41; 16 | 4.4±2.19; 3 | 87.96±24.13; 91.9 | 41.76±6.13; 43.1 | 16.4±2.51; 15 | 255.08±101.35; 238.67 | 8.73±2.19; 7.33 |
| >7 days | 78 | 0.474±0.149; 0.4 | 25.88±6.57; 25 | 6.31±2.51; 5 | 103.09±35.76; 97.7 | 40.76±9.11; 41.35 | 22.55±6.38; 22 | 239.61±112.97; 226.25 | 12.83±3.52; 12 | |
| p-value | 0.121 | <0.001 | 0.055 | 0.385 | 0.676 | 0.013 | 0.622 | 0.003 |
N, number of patients; IMV, invasive mechanical ventilation; FiO2, fraction of inspired oxygen; PIP, peak inspiratory pressure; PEEP, positive end-expiratory pressure; PaO2, partial pressure of oxygen; PaCO2, partial pressure of carbon dioxide; FRmec, mechanical respiratory frequency; PAW, mean airway pressure. The statistical analysis was performed by the Mann–Whitney U test. The positive p-value is set in bold. Alpha=0.05.
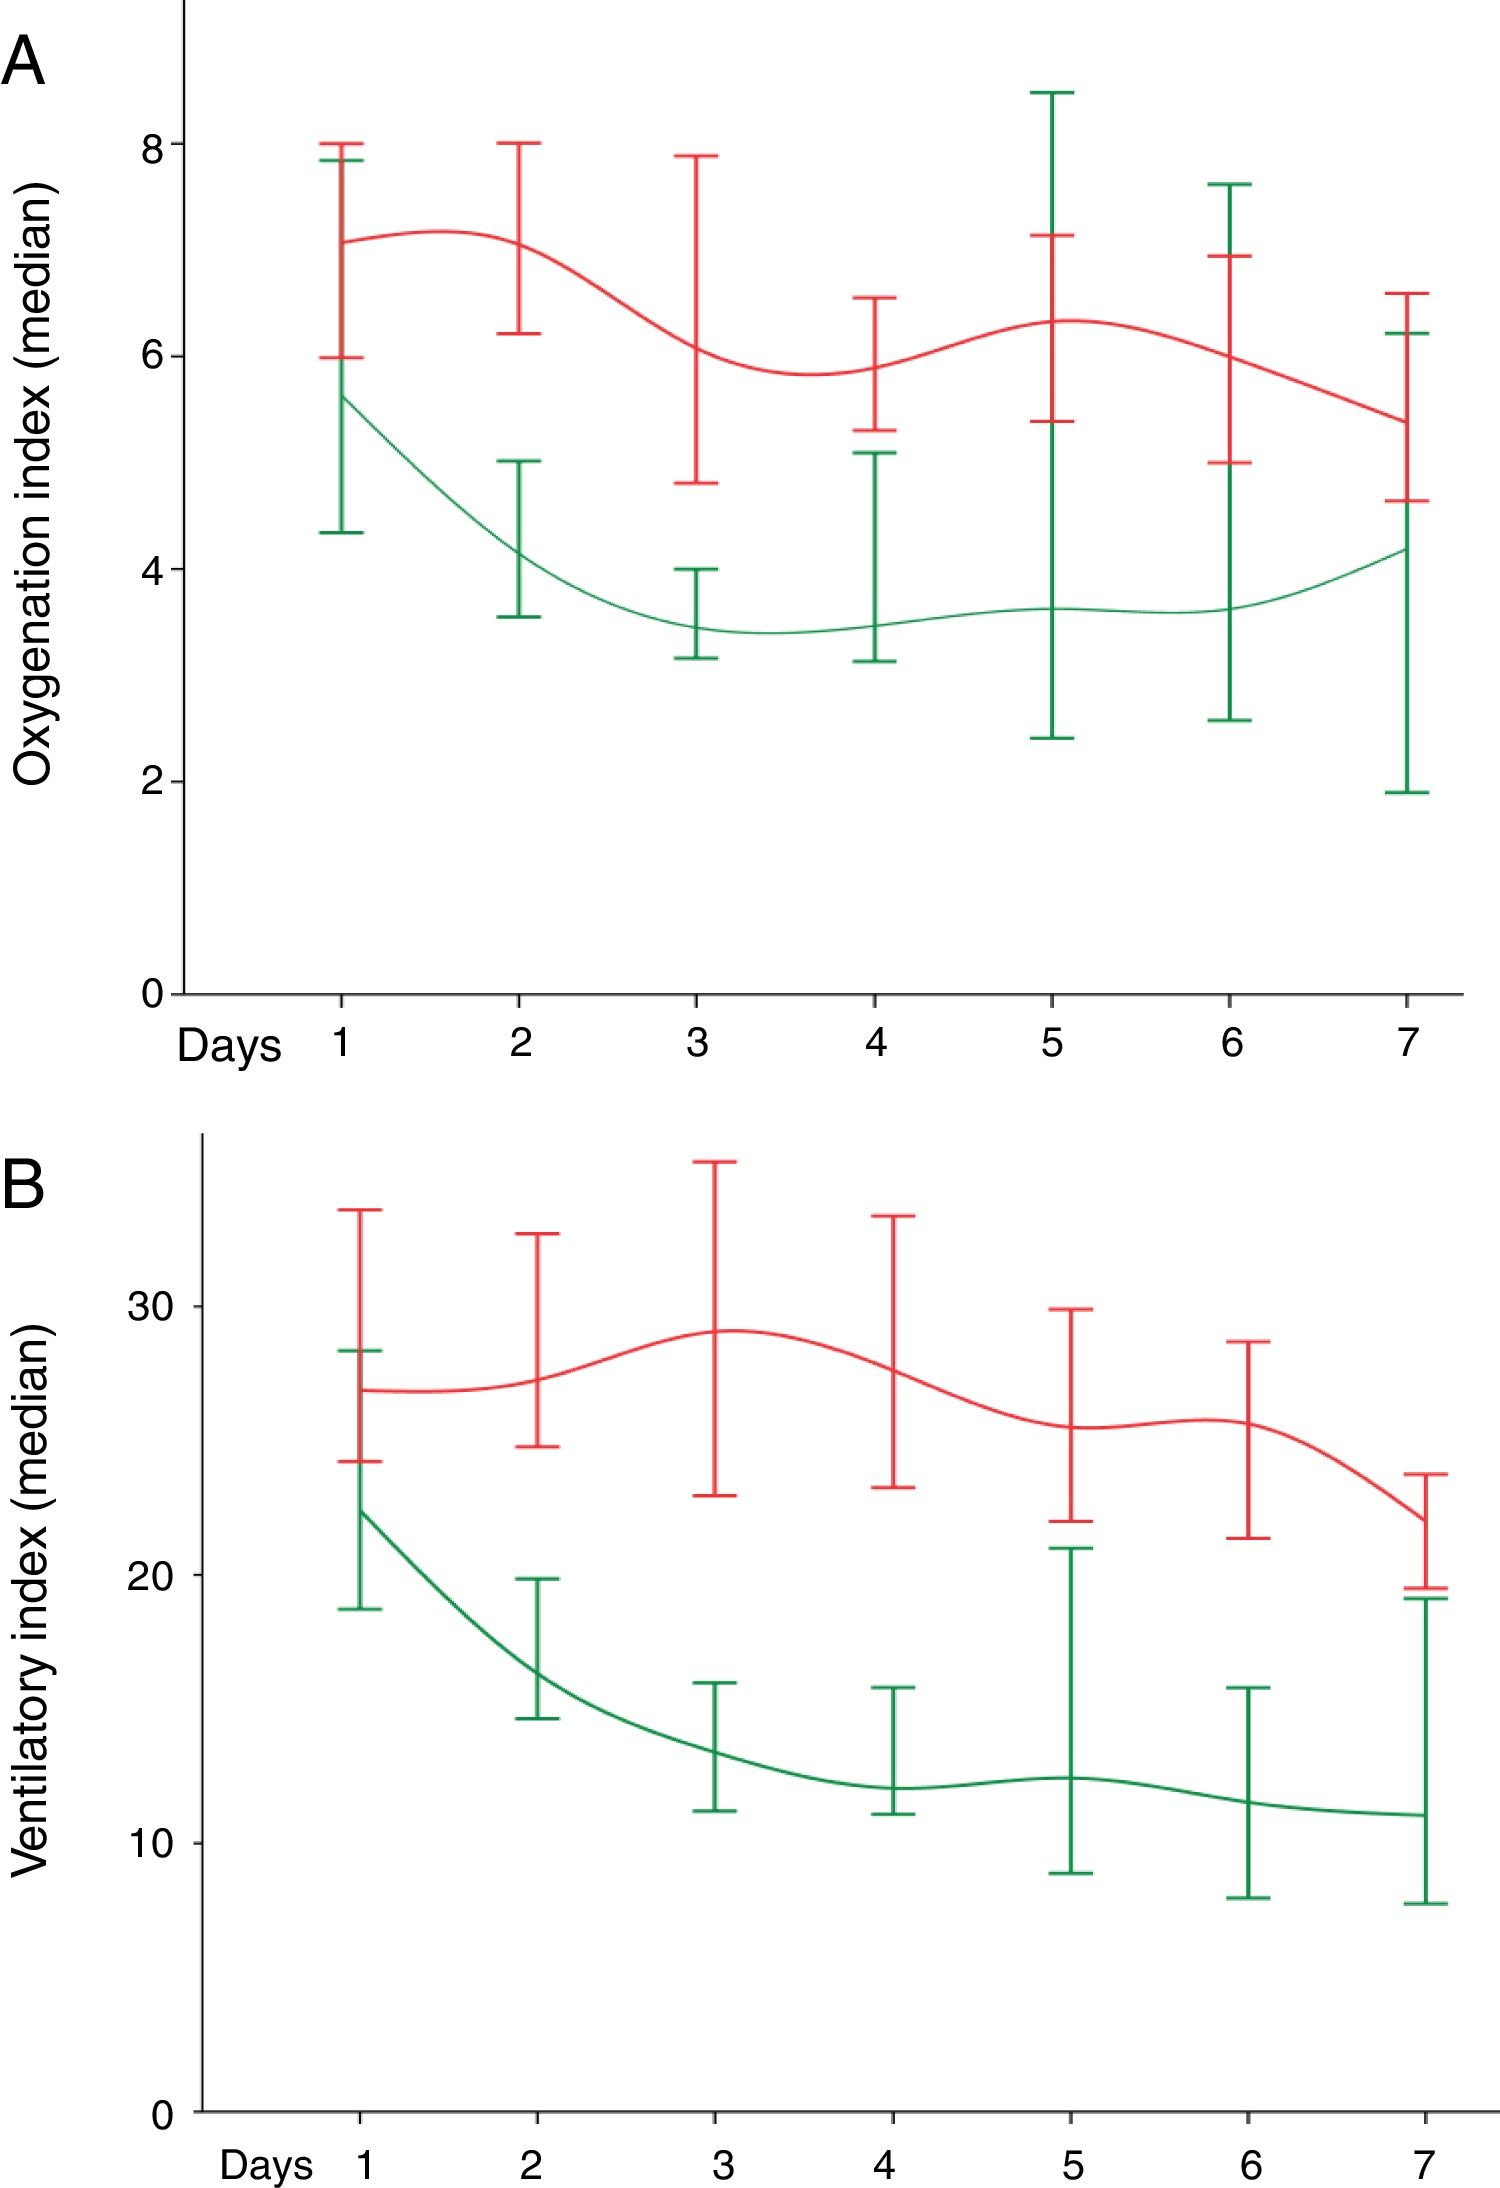
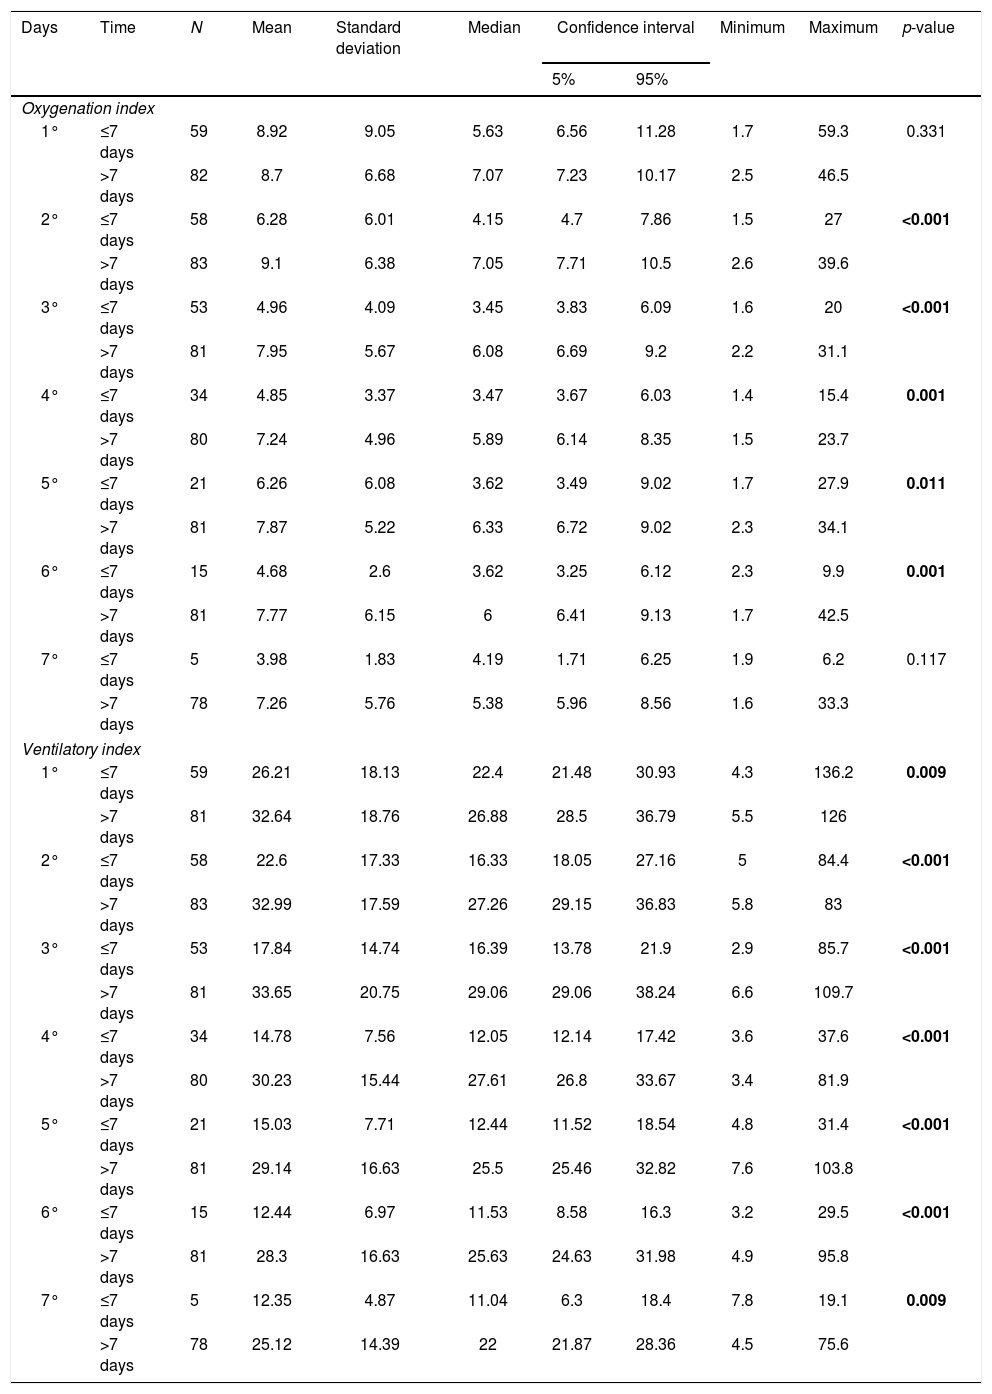
Difference was found in OI values from the second to the sixth day, and in VI values from the first to the seventh day, which were higher in the long-term IMV group (p-value≤0.05). OI and VI values are shown respectively in Table 3.
Oxygenation index and ventilatory index in infants in short and long-term invasive mechanical ventilation in the first seven days of invasive mechanical ventilation.
| Days | Time | N | Mean | Standard deviation | Median | Confidence interval | Minimum | Maximum | p-value | |
|---|---|---|---|---|---|---|---|---|---|---|
| 5% | 95% | |||||||||
| Oxygenation index | ||||||||||
| 1° | ≤7 days | 59 | 8.92 | 9.05 | 5.63 | 6.56 | 11.28 | 1.7 | 59.3 | 0.331 |
| >7 days | 82 | 8.7 | 6.68 | 7.07 | 7.23 | 10.17 | 2.5 | 46.5 | ||
| 2° | ≤7 days | 58 | 6.28 | 6.01 | 4.15 | 4.7 | 7.86 | 1.5 | 27 | <0.001 |
| >7 days | 83 | 9.1 | 6.38 | 7.05 | 7.71 | 10.5 | 2.6 | 39.6 | ||
| 3° | ≤7 days | 53 | 4.96 | 4.09 | 3.45 | 3.83 | 6.09 | 1.6 | 20 | <0.001 |
| >7 days | 81 | 7.95 | 5.67 | 6.08 | 6.69 | 9.2 | 2.2 | 31.1 | ||
| 4° | ≤7 days | 34 | 4.85 | 3.37 | 3.47 | 3.67 | 6.03 | 1.4 | 15.4 | 0.001 |
| >7 days | 80 | 7.24 | 4.96 | 5.89 | 6.14 | 8.35 | 1.5 | 23.7 | ||
| 5° | ≤7 days | 21 | 6.26 | 6.08 | 3.62 | 3.49 | 9.02 | 1.7 | 27.9 | 0.011 |
| >7 days | 81 | 7.87 | 5.22 | 6.33 | 6.72 | 9.02 | 2.3 | 34.1 | ||
| 6° | ≤7 days | 15 | 4.68 | 2.6 | 3.62 | 3.25 | 6.12 | 2.3 | 9.9 | 0.001 |
| >7 days | 81 | 7.77 | 6.15 | 6 | 6.41 | 9.13 | 1.7 | 42.5 | ||
| 7° | ≤7 days | 5 | 3.98 | 1.83 | 4.19 | 1.71 | 6.25 | 1.9 | 6.2 | 0.117 |
| >7 days | 78 | 7.26 | 5.76 | 5.38 | 5.96 | 8.56 | 1.6 | 33.3 | ||
| Ventilatory index | ||||||||||
| 1° | ≤7 days | 59 | 26.21 | 18.13 | 22.4 | 21.48 | 30.93 | 4.3 | 136.2 | 0.009 |
| >7 days | 81 | 32.64 | 18.76 | 26.88 | 28.5 | 36.79 | 5.5 | 126 | ||
| 2° | ≤7 days | 58 | 22.6 | 17.33 | 16.33 | 18.05 | 27.16 | 5 | 84.4 | <0.001 |
| >7 days | 83 | 32.99 | 17.59 | 27.26 | 29.15 | 36.83 | 5.8 | 83 | ||
| 3° | ≤7 days | 53 | 17.84 | 14.74 | 16.39 | 13.78 | 21.9 | 2.9 | 85.7 | <0.001 |
| >7 days | 81 | 33.65 | 20.75 | 29.06 | 29.06 | 38.24 | 6.6 | 109.7 | ||
| 4° | ≤7 days | 34 | 14.78 | 7.56 | 12.05 | 12.14 | 17.42 | 3.6 | 37.6 | <0.001 |
| >7 days | 80 | 30.23 | 15.44 | 27.61 | 26.8 | 33.67 | 3.4 | 81.9 | ||
| 5° | ≤7 days | 21 | 15.03 | 7.71 | 12.44 | 11.52 | 18.54 | 4.8 | 31.4 | <0.001 |
| >7 days | 81 | 29.14 | 16.63 | 25.5 | 25.46 | 32.82 | 7.6 | 103.8 | ||
| 6° | ≤7 days | 15 | 12.44 | 6.97 | 11.53 | 8.58 | 16.3 | 3.2 | 29.5 | <0.001 |
| >7 days | 81 | 28.3 | 16.63 | 25.63 | 24.63 | 31.98 | 4.9 | 95.8 | ||
| 7° | ≤7 days | 5 | 12.35 | 4.87 | 11.04 | 6.3 | 18.4 | 7.8 | 19.1 | 0.009 |
| >7 days | 78 | 25.12 | 14.39 | 22 | 21.87 | 28.36 | 4.5 | 75.6 | ||
OI, oxygenation index; VI, ventilatory index; N, number of patients. The statistical analysis was performed by the Mann–Whitney U test. The positive p-value is set in bold. Alpha=0.05.
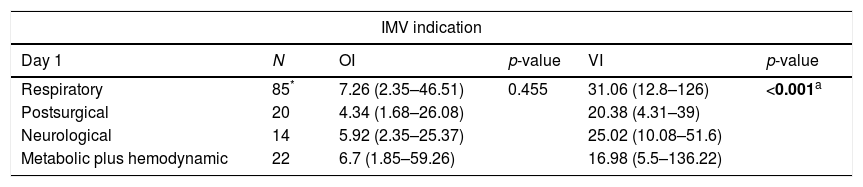
In addition, we compared the OI and VI values among the IMV indication. In our data, the IMV indication was associated with the values achieved from indices analyzed, mainly for VI values. The indication due to respiratory symptoms showed values higher than the other possibilities in all days analyzed (p-value<0.01) (Table 4). Finally, for the failed extubation, we observed only association with IV in the first day [presence of failed extubation, mean=31.68±19.94, median=26.37 (minimum=4.31 and maximum=136.22); absence of failed extubation, mean=22.25±8.57, median=21.61 (minimum=7.45 and maximum=44.63)] (p-value=0.014).
Distribution of infants per invasive mechanical ventilation indication regarding oxygenation (OI) and ventilation indices (VI).#
| IMV indication | |||||
|---|---|---|---|---|---|
| Day 1 | N | OI | p-value | VI | p-value |
| Respiratory | 85* | 7.26 (2.35–46.51) | 0.455 | 31.06 (12.8–126) | <0.001a |
| Postsurgical | 20 | 4.34 (1.68–26.08) | 20.38 (4.31–39) | ||
| Neurological | 14 | 5.92 (2.35–25.37) | 25.02 (10.08–51.6) | ||
| Metabolic plus hemodynamic | 22 | 6.7 (1.85–59.26) | 16.98 (5.5–136.22) | ||
| Day 2 | N | OI | p-value | VI | p-value |
|---|---|---|---|---|---|
| Respiratory | 85 | 6.41 (1.53–39.56) | 0.04b | 30.91 (8.52–82.95) | <0.001c,d |
| Postsurgical | 21 | 5.24 (1.9–30.86) | 14.96 (5.02–38.13) | ||
| Neurological | 13 | 5.49 (1.81–9.92) | 23.76 (8.89–58.43) | ||
| Metabolic plus hemodynamic | 22 | 3.99 (2.06–26.25) | 17.54 (5.8–84.37) |
| Day 3 | N | OI | p-value | VI | p-value |
|---|---|---|---|---|---|
| Respiratory | 82 | 5.15 (2.21–23.87) | 0.046b | 30.74 (3.29–109.71) | <0.001c |
| Postsurgical | 20 | 4.12 (1.61–22.77) | 14.78 (2.94–26.18) | ||
| Neurological | 13 | 3.35 (2.6–10.64) | 17.85 (6.61–45.81) | ||
| Metabolic plus hemodynamic | 19 | 3.45 (2.02–31.06) | 14 (6.6–94.5) |
| Day 4 | N | OI | p-value | VI | p-value |
|---|---|---|---|---|---|
| Respiratory | 71 | 5.66 (1.88–23.68) | 0.077 | 28.13 (5.68–81.88) | <0.001a,d |
| Postsurgical | 16 | 4.34 (1.35–17.07) | 15.34 (3.6–26.42) | ||
| Neurological | 9 | 5.44 (2.22–11.07) | 22.13 (12.1–43.39) | ||
| Metabolic plus hemodynamic | 18 | 3.24 (1.51–15.38) | 13.8 (3.38–33) |
| Day 5 | N | OI | p-value | VI | p-value |
|---|---|---|---|---|---|
| Respiratory | 61 | 6.24 (2.11–34.07) | 0.069 | 26.49 (8.34–103.8) | <0.001c |
| Postsurgical | 14 | 7.33 (1.67–27.94) | 15.86 (7.83–31.42) | ||
| Neurological | 10 | 4.43 (2.27–10.53) | 16.82 (7.63–37.25) | ||
| Metabolic plus hemodynamic | 17 | 4.08 (2.1–17.84) | 14.26 (4.79–41.44) |
| Day 6 | N | OI | p-value | VI | p-value |
|---|---|---|---|---|---|
| Respiratory | 61 | 5.86 (1.68–42.46) | 0.841 | 27.88 (4.87–95.76) | <0.001a |
| Postsurgical | 13 | 5.22 (2.28–15.16) | 14.3 (3.22–26.88) | ||
| Neurological | 9 | 6.83 (2.99–14.29) | 21.36 (7.3–36.86) | ||
| Metabolic plus hemodynamic | 13 | 3.8 (2.36–18.06) | 16.63 (4.92–77.28) |
| Day 7 | N | OI | p-value | VI | p-value |
|---|---|---|---|---|---|
| Respiratory | 55 | 5.01 (2.36–33.33) | 0.973 | 23.28 (4.5–75.64) | 0.004a |
| Postsurgical | 11 | 5.41 (1.9–10.14) | 16 (7.75–22.93) | ||
| Neurological | 8 | 5.57 (3.09–9.56) | 19.38 (9.72–34.61) | ||
| Metabolic plus hemodynamic | 9 | 5.78 (1.57–19.9) | 18.35 (7.62–30.72) |
Fig. 1 shows the values of OI (Fig. 1A) and VI (Fig. 1B) of the 142 infants in the first seven days on IMV, comparing short and long time on IMV.
![(A) Oxygenation index in the first seven days of invasive mechanical ventilation (IMV). The p-value [mean to ≤7days ± standard deviation; median (green line) and mean to > 7 days±standard deviation; median (red line)] was shown in sequence to oxygenation index. Day 1 (141 patients): p-value=0.331 (8.92±9.05; 5.63 and 8.7±6.68; 7.07). Day 2 (141 patients): p-value < 0.001 (6.28±6.01; 4.15 and 9.1±6.38; 7.05). Day 3 (134 patients): p-value=0.001 (4.96±4.09; 3.45 and 7.95±5.67; 6.08). Day 4 (114 patients): p-value=0.001 (4.85±3.37; 3.47 and 7.24±4.96; 5.89). Day 5 (102 patients): p-value=0.011 (6.25±6.08; 3.62 and 7.87±5.22; 6.33). Day 6 (96 patients): p-value=0.01 (4.68±2.6; 3.62 and 7.77±6.15; 6). Day 7 (83 patients): p-value=0.117 (3.98±1.83; 4.19 and 7.25±5.76; 5.38). Differences were found in oxygenation index from the second to the sixth day, the values were higher in the long-term IMV. Also, we compared the evolution of oxygenation index among IMV days according to ≤ short time (p-value=0.033) and long time (p-value < 0.001). (B) Ventilatory index in the first seven days of IMV. The p-value [mean to ≤7days±standard deviation; median (green line) and mean to >7 days±standard deviation; median (red line)] was shown in sequence to the oxygenation index. Day 1 (140 patients): p-value=0.009 (26.21±18.13; 22.4 and 32.64±18.76; 26.88). Day 2 (141 patients): p-value < 0.001 (22.6±17.33; 16.33 and 32.99±15.59; 27.26). Day 3 (134 patients): p-value < 0.001 (17.84±14.74; 16.39 and 33.65±20.75; 29.06). Day 4 (114 patients): p-value < 0.001 (14.78±7.56; 12.05 and 30.23±15.44; 27.61). Day 5 (102 patients): p-value < 0.001 (15.03±7.71; 12.44 and 29.14±16.63; 25.5). Day 6 (96 patients): p-value<0.001 (12.44±6.97; 11.53 and 28.3±16.63; 25.63). Day 7 (83 patients): p-value=0.009 (12.35±4.87; 11.04 and 25.12±14.39; 22). Differences were found in ventilation index from the first to the seventh day, the values were higher in the long-term IMV. Also, we compared the evolution of ventilation index among IMV days according to ≤ short time (p-value<0.001) and long time (p-value<0.001). We adopted the alpha=0.05 for all statistical tests performed. Data were analyzed by the Mann–Whitney U test and Friedman's test Two-Way Analysis of Variance test.](https://static.elsevier.es/multimedia/25310437/0000002400000004/v2_201810040624/S217351151730180X/v2_201810040624/en/main.assets/gr1.jpeg?xkr=ue/ImdikoIMrsJoerZ+w94UphxYc+GPca8Z7OggvdfJaI9Nqk/wRF1/+NWFHb4fN6mfVWw7pAxCYjkEJMZ+P9ESw6bRMqd7Xr/Cf5Iag1sWYGX5+ASS+vfXzAii3I1fdgcYCRAACxNAi1NKn5/ppwv4DLVmQVLKvj8o5d4KW9I5CGnekwQTvZsuBTlBLVNU9K2PMO+xidifbDgFTXSx0dzHFb+liu6nPjI7FXG+kfCz2vHXP25hXfgP4Q+K4lUAWrcyyjvaQIsYj8osUF6I84YOer3Wgkcm5Wn4KxvLzHcQ= "(A) Oxygenation index in the first seven days of invasive mechanical ventilation (IMV). The p-value [mean to ≤7days ± standard deviation; median (green line) and mean to > 7 days±standard deviation; median (red line)] was shown in sequence to oxygenation index. Day 1 (141 patients): p-value=0.331 (8.92±9.05; 5.63 and 8.7±6.68; 7.07). Day 2 (141 patients): p-value < 0.001 (6.28±6.01; 4.15 and 9.1±6.38; 7.05). Day 3 (134 patients): p-value=0.001 (4.96±4.09; 3.45 and 7.95±5.67; 6.08). Day 4 (114 patients): p-value=0.001 (4.85±3.37; 3.47 and 7.24±4.96; 5.89). Day 5 (102 patients): p-value=0.011 (6.25±6.08; 3.62 and 7.87±5.22; 6.33). Day 6 (96 patients): p-value=0.01 (4.68±2.6; 3.62 and 7.77±6.15; 6). Day 7 (83 patients): p-value=0.117 (3.98±1.83; 4.19 and 7.25±5.76; 5.38). Differences were found in oxygenation index from the second to the sixth day, the values were higher in the long-term IMV. Also, we compared the evolution of oxygenation index among IMV days according to ≤ short time (p-value=0.033) and long time (p-value < 0.001). (B) Ventilatory index in the first seven days of IMV. The p-value [mean to ≤7days±standard deviation; median (green line) and mean to >7 days±standard deviation; median (red line)] was shown in sequence to the oxygenation index. Day 1 (140 patients): p-value=0.009 (26.21±18.13; 22.4 and 32.64±18.76; 26.88). Day 2 (141 patients): p-value < 0.001 (22.6±17.33; 16.33 and 32.99±15.59; 27.26). Day 3 (134 patients): p-value < 0.001 (17.84±14.74; 16.39 and 33.65±20.75; 29.06). Day 4 (114 patients): p-value < 0.001 (14.78±7.56; 12.05 and 30.23±15.44; 27.61). Day 5 (102 patients): p-value < 0.001 (15.03±7.71; 12.44 and 29.14±16.63; 25.5). Day 6 (96 patients): p-value<0.001 (12.44±6.97; 11.53 and 28.3±16.63; 25.63). Day 7 (83 patients): p-value=0.009 (12.35±4.87; 11.04 and 25.12±14.39; 22). Differences were found in ventilation index from the first to the seventh day, the values were higher in the long-term IMV. Also, we compared the evolution of ventilation index among IMV days according to ≤ short time (p-value<0.001) and long time (p-value<0.001). We adopted the alpha=0.05 for all statistical tests performed. Data were analyzed by the Mann–Whitney U test and Friedman's test Two-Way Analysis of Variance test.")
(A) Oxygenation index in the first seven days of invasive mechanical ventilation (IMV). The p-value [mean to ≤7days ± standard deviation; median (green line) and mean to > 7 days±standard deviation; median (red line)] was shown in sequence to oxygenation index. Day 1 (141 patients): p-value=0.331 (8.92±9.05; 5.63 and 8.7±6.68; 7.07). Day 2 (141 patients): p-value < 0.001 (6.28±6.01; 4.15 and 9.1±6.38; 7.05). Day 3 (134 patients): p-value=0.001 (4.96±4.09; 3.45 and 7.95±5.67; 6.08). Day 4 (114 patients): p-value=0.001 (4.85±3.37; 3.47 and 7.24±4.96; 5.89). Day 5 (102 patients): p-value=0.011 (6.25±6.08; 3.62 and 7.87±5.22; 6.33). Day 6 (96 patients): p-value=0.01 (4.68±2.6; 3.62 and 7.77±6.15; 6). Day 7 (83 patients): p-value=0.117 (3.98±1.83; 4.19 and 7.25±5.76; 5.38). Differences were found in oxygenation index from the second to the sixth day, the values were higher in the long-term IMV. Also, we compared the evolution of oxygenation index among IMV days according to ≤ short time (p-value=0.033) and long time (p-value < 0.001). (B) Ventilatory index in the first seven days of IMV. The p-value [mean to ≤7days±standard deviation; median (green line) and mean to >7 days±standard deviation; median (red line)] was shown in sequence to the oxygenation index. Day 1 (140 patients): p-value=0.009 (26.21±18.13; 22.4 and 32.64±18.76; 26.88). Day 2 (141 patients): p-value < 0.001 (22.6±17.33; 16.33 and 32.99±15.59; 27.26). Day 3 (134 patients): p-value < 0.001 (17.84±14.74; 16.39 and 33.65±20.75; 29.06). Day 4 (114 patients): p-value < 0.001 (14.78±7.56; 12.05 and 30.23±15.44; 27.61). Day 5 (102 patients): p-value < 0.001 (15.03±7.71; 12.44 and 29.14±16.63; 25.5). Day 6 (96 patients): p-value<0.001 (12.44±6.97; 11.53 and 28.3±16.63; 25.63). Day 7 (83 patients): p-value=0.009 (12.35±4.87; 11.04 and 25.12±14.39; 22). Differences were found in ventilation index from the first to the seventh day, the values were higher in the long-term IMV. Also, we compared the evolution of ventilation index among IMV days according to ≤ short time (p-value<0.001) and long time (p-value<0.001). We adopted the alpha=0.05 for all statistical tests performed. Data were analyzed by the Mann–Whitney U test and Friedman's test Two-Way Analysis of Variance test.
In our data, 24/142 (16.9%) showed progression to death. However, no positive association between patient death and the variables included, mainly for OI and VI, was described in our data (p>0.05).
DiscussionIn this study, the OI and VI values were associated with time infant patients spent on IMV.
Due to calculation of the OI included in its formula, FiO2/PaO2 ratio and Paw could be considered an effective index to determine the price to be paid for an inadequate oxygenation.2,14,15 Recent studies on OI were published with the purpose of using OI as parameter to assess therapeutic interventions in mechanically ventilated neonates and children.16–21 Studies using OI as a predictor of extubation failure were initiated by Khan et al. (1996), who enrolled 208 children and found that OI>4.5, immediately before extubation, was a risk marker for reintubation. The same study evaluated the compliance, respiratory rate, oxygenation, and pressure indices, widely used in adults to predict extubation success and failure, but it was not effective in pediatrics.14 Some studies examined other indices used in adults to predict successful extubation in children, e.g., rapid shallow breathing index and maximal inspiratory pressure; however, the exact cutoff points for these indices to predict successful extubation in children were not identified.9,22 Khan et al. (2000) conducted another study including 312 patients to study the predictors previously analyzed, and it was found that despite changes in clinical practice, the OI remained a good predictor and was able to determine points of low and high risk for extubation failure in infants and children.15 In studies involving the OI and VI on IMV, association was found on the second day after initiation of IMV.6,8,23 In this case, the first 24h after initiation of IMV are considered an adjustment period for the ventilatory parameters and patient stabilization. In our study, the OI showed difference when comparing patients who remained on IMV for short and long time from the second to the sixth day and for VI from the first to the seventh day.
The VI is a measure of respiratory disorder that considers both changes in the management of ventilator, by incorporating the FRmec and Pinsp parameters into its formula, and the patient response to therapy established by PaCO2.
Paret et al. (1998) conducted the first study that evaluated the correlation of VI with time on IMV and found the predictive value for VI from the third to the fifth day, regarding prognosis of acute respiratory distress syndrome. Sorting the survivors and non-survivors, the value of VI was higher in non-survivors, determining VI>65 as a predictor of mortality.24 Bont et al. (2000) showed that the mean of the VI calculated from three measurements from the early 24h after the IMV initiation in acute viral bronchiolitis in infants, corresponded to the time spent on IMV.25
In the study by Barros et al. (2011), the OI and VI in the first five days of IMV in pediatric patients were analyzed and an association between the OI on the third and fifth days and VI on the third, fourth and fifth days with the time on IMV was found. However, considering the time spent on IMV [short time (<7 days) and long time (≥7 days)], difference was found for the VI from the second to the fifth day, and for the pH on the fourth and fifth days. For the OI, no statistical difference was observed.6 In our study, we identified differences in the OI from the second to the sixth day. The OI values, on these days, were higher in the long-term IMV, indicating greater patient severity. This difference can be observed in Barros et al. (2011), with a smaller and heterogeneous sample, including pediatric patients from different age groups.6 Almeida et al. (2005) found association between time spent on IMV and VI from the second to the fifth day in infants with acute viral bronchiolitis, and a cutoff value of 37 for the VI was stipulated, reflecting a progressive increase in the risk of long-term IMV.8
In our data, no positive association was found between OI and VI and mortality. Peters et al. (1998) did not find difference for the OI, VI and for other markers analyzed between the group of survivors and non-survivors when analyzing 118 patients with acute hypoxemic respiratory failure (AHRF).26
Traschel et al. (2005) included 131 children with AHRF and found that the OI was predictive of the AHRF severity and risk of death; however, low accuracy was observed.23 Ghuman et al. (2012) analyzed 95 children mechanically ventilated in AHRF to identify the relationship between oxygenation markers and mortality. Association was found between OI and other markers with high risk of death.5 Silva et al. (2009) used the indices: Pinsp, pH, PaO2/FiO2 ratio, OI and VI in 48h of IMV to assess the risk of mortality, and long-term MV in 49 children in PICU. In the study, values of Pinsp>25cm H2O was a predictor of mortality and long-term MV; and PaO2/FiO2 ratio, pH, OI and VI in 48h were predictors of mortality.27 The studies that identified association between mortality and OI and VI were made with children, and more studies should be conducted to verify possible association between these variables in infants.
In our study, other variables showed association with the IMV in infants. The most significant variables were: Pisnp from the first to the seventh day, FRmec from the second to the seventh day, and Paw from the first to the seventh day on IMV. However, we cannot affirm that these variables are effective in predicting long-term IMV, because the results demonstrate that patients who remained in long-term IMV required higher parameters from the beginning of ventilatory support. All the parameters cited, including Paw, represent parameters of the MV and do not consider the response of the patient at the time of examination. The PaO2/FiO2 ratio contains the FiO2 and considers the patient response at the time of assessment, represented by PaO2, showing a difference between patients in short and long-term IMV from the second to the fourth day. The OI considers in its formula the oxygenation parameters and the PaO2. The OI showed differences from the second to the sixth day, which may be because it is the most complete index that considers the PaO2/FiO2 ratio and the Paw. Moreover, the PaCO2 was significant in assessing the patient on IMV only on the second day, while the evaluation by VI, which includes PaCO2 along ventilatory parameters, FRmec and Pinsp, showed difference among patients who remained on IMV for short and long-term from the first to the seventh day.
In our data, the low initial values of PCO2, in some patients, were obtained in the blood gas analysis, showing the need for decreasing the ventilation parameters. The parameters were altered after the assessment of the value by gasometry.
A limitation of the study is the heterogeneity of the population, which does not allow for inference of a cutoff value for VI and OI from which longer IMV, extubation failure, among other markers. Weaning and extubation protocol were limiting factors for generalizing our findings. In our unit, there is not a standard protocol, and in this case, the extubation was defined by the interdisciplinary team. Further studies are needed to define weaning and extubation protocols in pediatrics, and predictive indices of long-term MV and extubation failure in order to assist the therapist at this moment, that is, the withdrawal from IMV without harm to the patient.
ConclusionsThe OI and VI showed association with the time on IMV in infants and maybe considered possible predictors of long-term IMV. It may be important to assess the conditions of the patient who undergoes intubation at the onset of the process, to adjust the ventilation parameters correctly according to the evolution of the patient, as well as to establish changes in therapeutic approaches when needed, reducing the risk of injury induced by MV, oxygen toxicity, and mortality.
Authors’ contributionsDACBR: has made substantial contributions to the conception and design of the study, acquisition, analysis and interpretation of data; manuscript drafting and critical revision for important intellectual content. FALM: has made substantial contribution to analysis and interpretation of data; manuscript drafting and critical revision for important intellectual content. CCBA/AAAJ: has made substantial contributions to acquisition of data. JDR: has made substantial contributions to the conception and design of the study, contributed to acquisition, analysis and interpretation of data; manuscript drafting and critical revision for important intellectual content, in addition to giving his final approval of the version to be published. All the authors have read, reviewed, and approved the final manuscript.
Ethical approvalAll procedures performed in studies involving human participants were in accordance with the ethical standards of the institutional and/or national research committee and with the 1964 Helsinki declaration and its later amendments or comparable ethical standards.
FundingFALM: São Paulo Research Foundation (FAPESP), for sponsoring the research #2011/12939-4; #2015/12183-8 and #2015/12858-5; Fund for the Support of Education, Research and Extension of the University of Campinas (FAEPEX), for sponsoring the research #0648/2015; JDR: FAPESP, for sponsoring the research #2011/18845-1 and #2015/12183-8.
Conflict of interestThe authors declare no conflict of interest.
The authors thank the hospital staff from University of Campinas – Unicamp for the medical files that provided patients records; the Center for Investigation in Pediatrics (CIPED) for making the laboratory available for data collection; the Laboratory of Medical Genetics (http://laboratoriomultiusuario.com.br/) for the statistical analysis. The authors also thank Espaço da Escrita/Coordenadoria Geral da Universidade – Unicamp – for providing the translation of the manuscript.
- Assisted mobilisation in critical patients with COVID-19
- Two years of COVID-19: Trends in rehabilitation
- Comparison of different field tests to assess the physical capacity of post-COVID-19 patients
- New insights in circulating peptidome to differentiate mild to severe COVID-19 patients: Preliminary report
articles


