

Unbiased cluster analysis using clinical parameters has identified asthma phenotypes. Adding inflammatory biomarkers to this analysis provided a better insight into the disease mechanisms. This approach has not yet been applied to asthmatic Portuguese patients.
AimTo identify phenotypes of asthma using cluster analysis in a Portuguese asthmatic population treated in secondary medical care.
MethodsConsecutive patients with asthma were recruited from the outpatient clinic. Patients were optimally treated according to GINA guidelines and enrolled in the study. Procedures were performed according to a standard evaluation of asthma. Phenotypes were identified by cluster analysis using Ward's clustering method.
ResultsOf the 72 patients enrolled, 57 had full data and were included for cluster analysis. Distribution was set in 5 clusters described as follows: cluster (C) 1, early onset mild allergic asthma; C2, moderate allergic asthma, with long evolution, female prevalence and mixed inflammation; C3, allergic brittle asthma in young females with early disease onset and no evidence of inflammation; C4, severe asthma in obese females with late disease onset, highly symptomatic despite low Th2 inflammation; C5, severe asthma with chronic airflow obstruction, late disease onset and eosinophilic inflammation.
ConclusionsIn our study population, the identified clusters were mainly coincident with other larger-scale cluster analysis. Variables such as age at disease onset, obesity, lung function, FeNO (Th2 biomarker) and disease severity were important for cluster distinction.
Asthma is heterogeneous and cluster approaches have been developed to better define phenotypes.1, 2, 3 Although variable selection and analysis methodology differ, some studies have reached comparable results. Identification of each corresponding endotype requires the definition of their clinical characteristics, biomarkers, lung physiology, genetic aspects, disease history and therapeutic response.4 According to Wenzel, the first step to better understand asthma is to define phenotypes by cluster analysis.5
The objective of this observational study was to cluster an asthmatic Portuguese population, treated in secondary medical care, combining clinical, inflammatory, lung function and severity parameters.
MethodsStudy designConsecutive patients with asthma were recruited from the outpatient clinic, using written informative material. They were included if aged between 18 and 79 years and excluded in the presence of any of the following: cystic fibrosis, interstitial lung disease, auto-immune disease, neoplastic disease, untreated cardiac failure.
Asthma was defined on the basis of a relevant symptom history, plus one or more of the following: history of airway reversibility to salbutamol according to GINA guidelines,6 positive test for airway hyperresponsiveness using methacholine.7
Asthma control was measured under optimized treatment, with validated asthma questionnaires (asthma control test (ACT), control asthma and allergic rhinitis test (CARAT), asthma life quality (ALQ), and severity of asthma score (SOA)).
Severe exacerbations were defined as events requiring urgent action to prevent a serious outcome and at least one of the following: use of systemic corticosteroids or an increase from a stable maintenance dose, for at least 3 days, and/or hospitalization or emergency room visit due to asthma requiring systemic corticosteroid treatment.8
The risk of future adverse events was evaluated considering loss of control, number of exacerbations in the previous year, number of systemic corticosteroids in the previous year, accelerated decline in lung function, and side-effects of treatment. A low basal FEV1 (% predicted value) and low reversibility were also taken into account.
Lung function was assessed with spirometry and plethysmography according to ATS criteria;9, 10 skin prick tests (SPT) were performed using standardized allergens and/or specific serum IgE, FeNO measurement was done using a CLD 88 SP (EcoMedics®) analyzer before any forced expiratory manoeuvers11 and sputum induction and collection was performed using hypertonic saline 4.5% if stable asthma, delivered via an ultrasonic nebulizer.12 Induced sputum was collected by a trained nurse, stored on ice and processed within two hours after expectoration. Sputum processing and immunophenotypical analysis of sputum cells was performed according to laboratory procedures.
If the need to exclude other diagnoses occurred, specific procedures were scheduled (Table E1).
Data processingVariables were selected according to previous studies1, 2 and included demographic data; comorbidities; evaluation of disease control, quality of life and risk assessment; lung function and blood biomarkers (Table 1). Patients with missing data were excluded. Summary statistics were reported as mean and standard deviation values for continuous variables and as percentages and counts for categorical variables. Geometric mean was reported for total serum IgE.
Table 1. Variables selected for cluster analysis (continuous, binary and composed).
| Number | Variable name | Type of data | Key |
| Demographic and comorbidities – Questionnaire data | |||
| 1 | Gender | Binary | 0 – Female/1 – Male |
| 2 | Age | Continuous | |
| 3 | BMI | Continuous | |
| 4 | Onset under 12 y | Binary | 0 – Yes/1 – No |
| 5 | Years of disease | Continuous | |
| 6 | Comorbidities | Composite: atopy; rhinitis; polyposis; sinusitis; any smoke exposure; pneumonia history; NSAID's HS; GERD; α1-AT deficit; Bronchiectasic; COPD; Other obstructive disease; Aspergillus (IgEpos) | Presence: 1 Absence: 0 Minimum: 0 Maximum: 13 |
| Control and severity of disease, risk of adverse events, and quality of life | |||
| 7 | Control of disease and patient at risk | Composite: hospitalization (in previous year); Severe exacerbation (in previousyear); Disease control; % patients at risk; OCS | Presence: 1 Absence: 0 Minimum: 0 Maximum: 5 |
| Demographic and comorbidities – Questionnaire data | |||
| 8 | Medication used | Composite: Imunotherapy; ICS dose; LABA; Tiotropium; Montelukast; Omalizumab; Aminophylline; nasal CS | Presence: 1 Absence: 0 Minimum: 0 Maximum: 8 |
| 9 | No. of allergies | Composite: Mites; Pollens; Fungus; Cockroach; Cat | Presence: 1 Absence: 0 Minimum: 0 Maximum: 5 |
| 10 | Risk of adverse events | Composite: hospitalizations >0 (previous year); OCS≥2 (previous year); FEV1<80%; ΔFEV1 after BD<200 ml; adverse effects (1 = yes) | Minimum: 0 Maximum: 5 |
| 11 | SOA | Continuous | |
| 12 | ACT | Continuous | |
| 13 | CARAT (Rhinitis) | Continuous | |
| 14 | CARAT (Asthma) | Continuous | |
| 15 | ALQ | Continuous | |
| Lung function | |||
| 16 | Bronchial lability | Composite: fixed obstruction; bronchial reversibility; fixed obstruction despite BD response | Presence: 1 Absence: 0 Minimum: 0 Maximum: 3 |
| 17 | Basal FEV1 (%predicted) | Continuous | |
| 18 | Basal FEV1/CVF (%predicted) | Continuous | |
| 19 | Basal FEV25%–75% (%predicted) | Continuous | |
| 20 | Basal RV (%predicted) | Continuous | |
| Biomarkers | |||
| 21 | Blood eosinophils (%): | Continuous | Log scale |
| 22 | Seric IgE (mmol/L): | Continuous | Log scale |
ACT: asthma control test; ALQ: asthma life quality; CARAT: Control of Allergic Rhinitis and Asthma Test; CS: corticosteroids;; ICS: inhaled corticosteroids; LABA: long-acting b-agonists; SOA: severity asthma score; OCS: oral corticosteroids.
Clinically redundant variables (or with correlation values above 0.9 in module) were reduced. Binary questionnaire data and data with a spectrum of responses were transformed into “composite variables” (Table 1) to capture multiple questions in a ranked ordinal scale.2, 13, 14
A cluster analysis of 22 variables (Table 1) was applied to identify groups of patients with the same characteristics. Ward's minimum-variance hierarchical clustering method was performed using an agglomerative approach, and the linkage measure was the squared Euclidean distance with standardization in z scores, according to Moore et al.1 By visual inspection of dendrogram, no single member, small clusters or observations with large distances from all other observations were observed. Therefore, no formal method for outliers’ detection was used. Analysis of variance (ANOVA or Kruskal–Wallis) or contingency table tests (Person chi-square or Fisher) were used to compare differences between clusters. All statistical analyses were performed using SPSS® Software, version 20.0 (SPSS, Inc., Chicago, IL), and p-values under 0.05 were considered significant.
ResultsOf the 72 patients enrolled, 57 had completed data for the considered variables (79.2% of total sample).
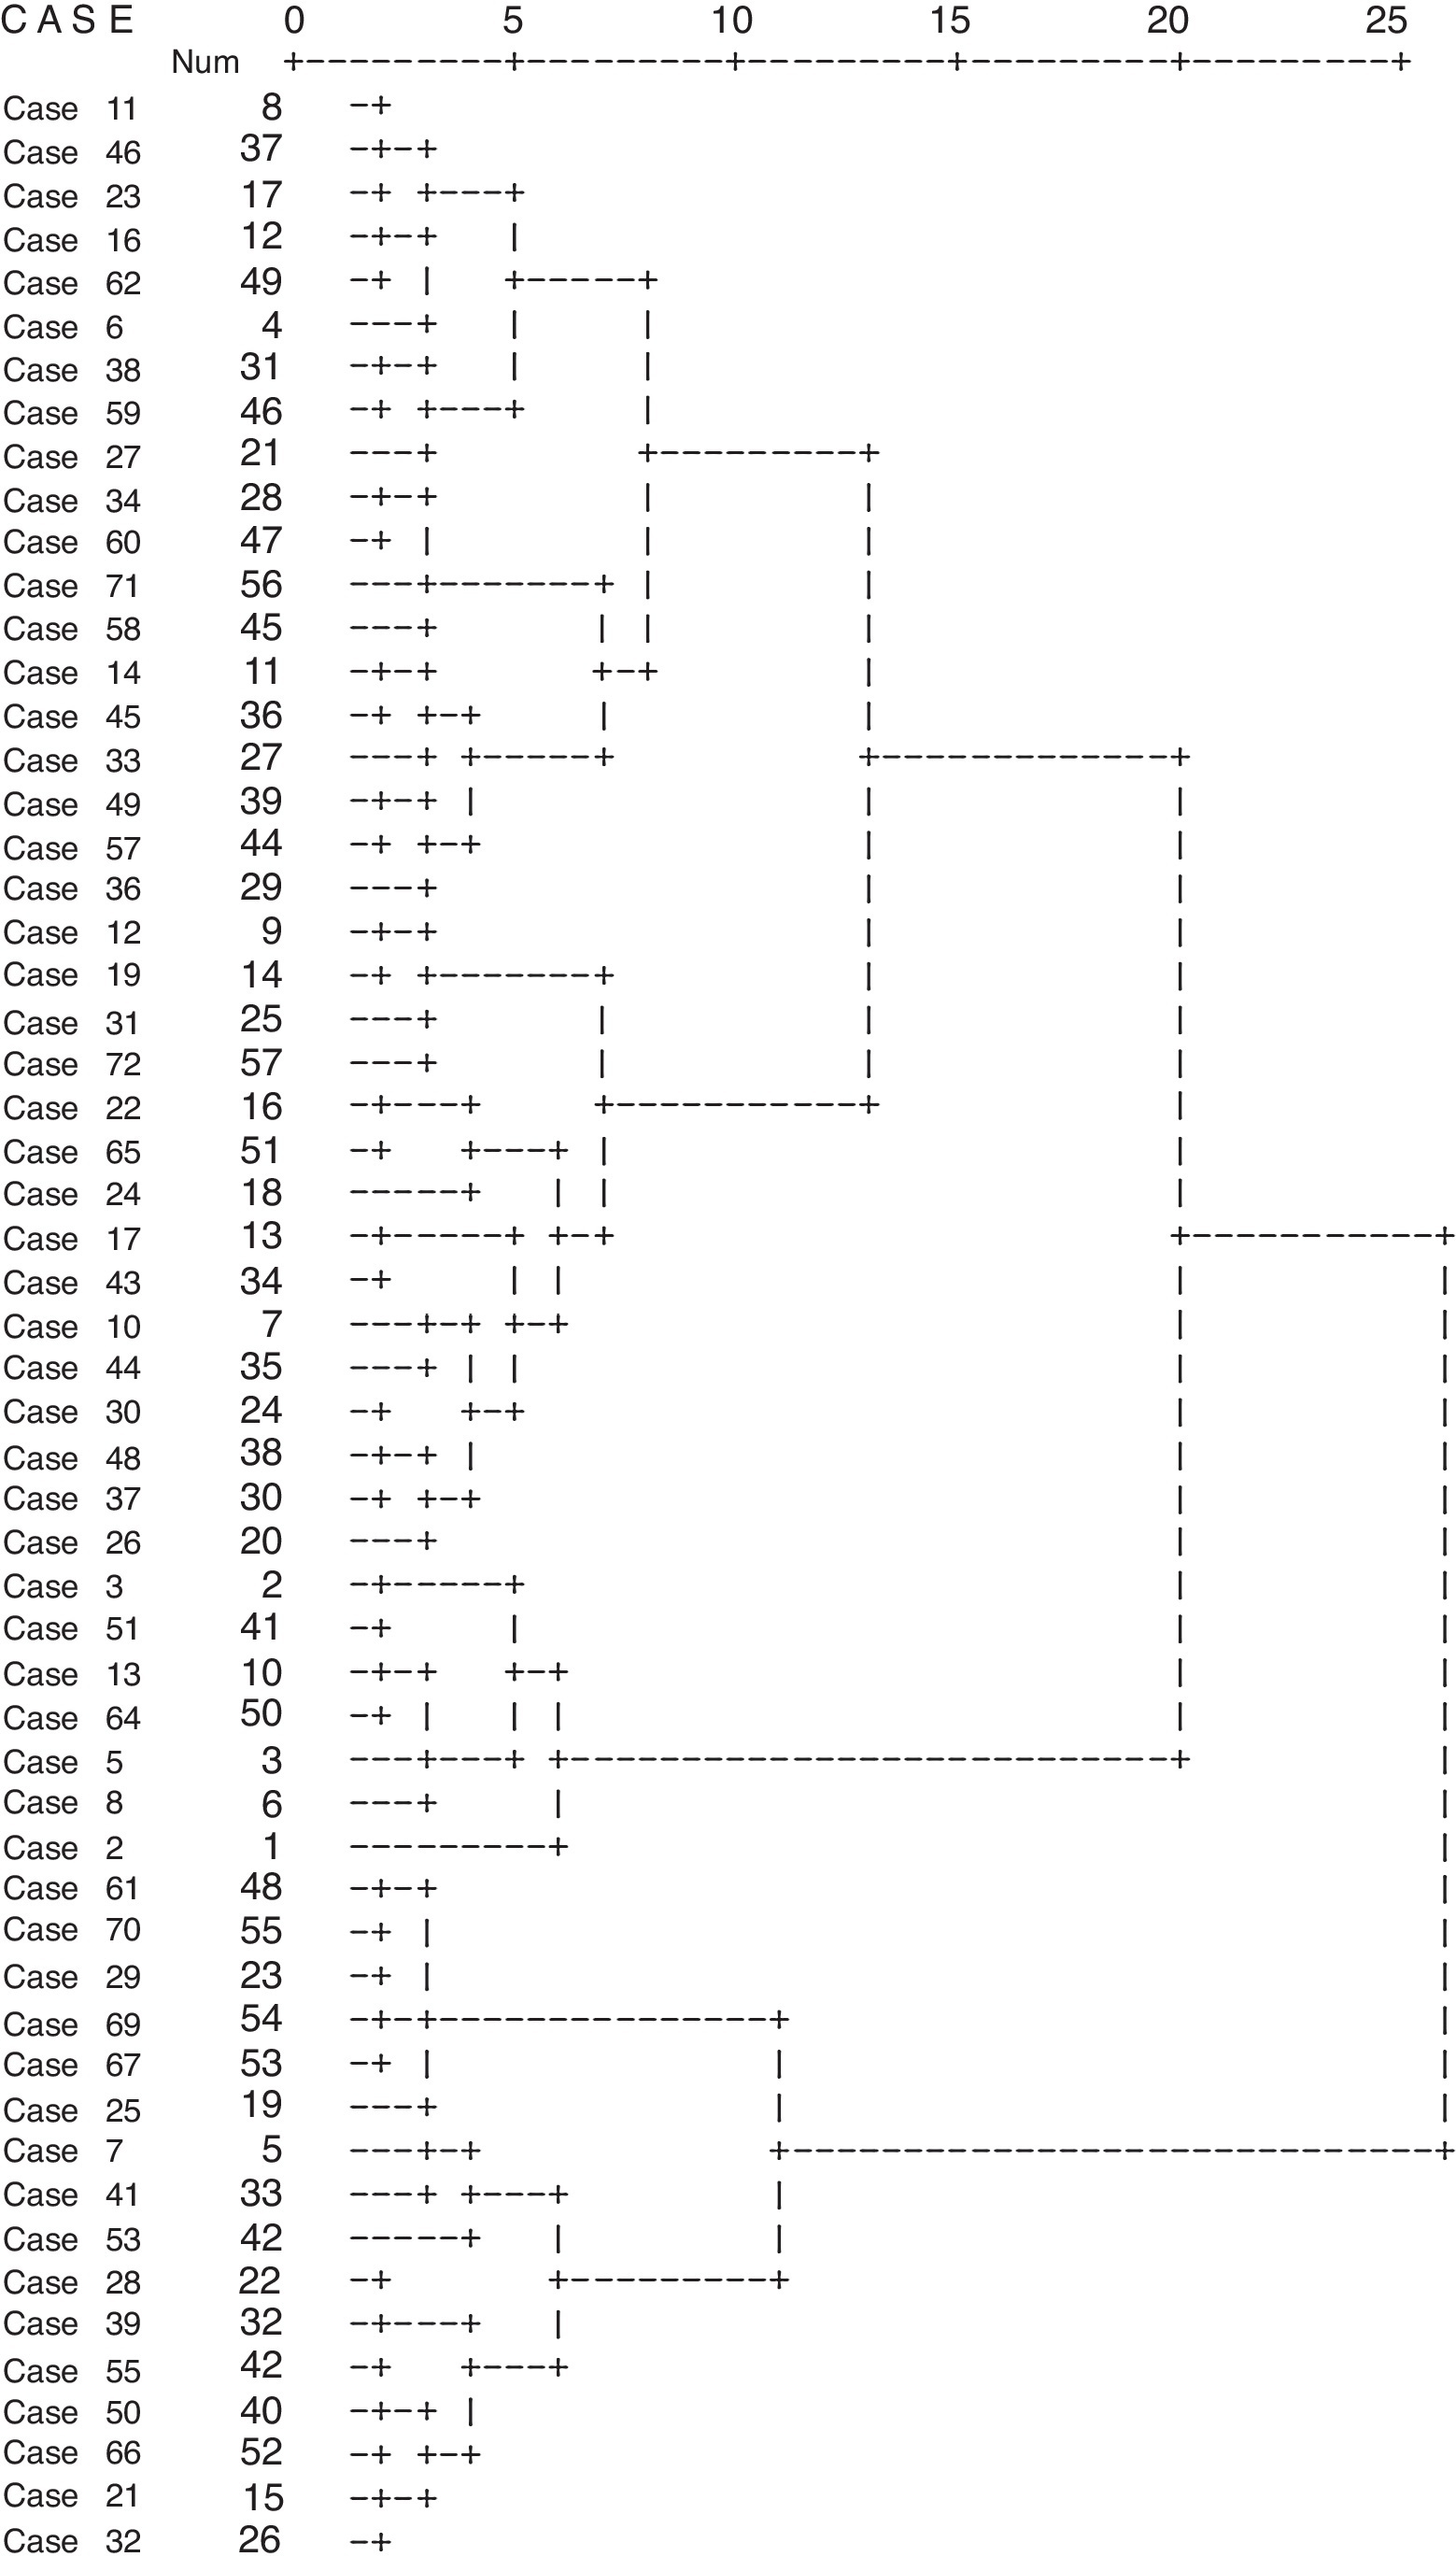
The optimum number of clusters was estimated by visual inspection of the dendrogram (Figure 1) and by representation of the difference between consecutive clusters (Fig. E1). A second cluster method was used (two-step cluster approach) to ensure that Ward's cluster solutions were not bias due to small sample size or by the measurement level of the considerable variables. For both clustering methods, the five cluster solution was the one that, from a clinical perspective, best explained the results.

Figure 1. Dendrogram obtained using Ward's method.
Elements were then distributed in five clusters. From variables that showed significance in distribution the following stand out: gender, age, BMI, number of exacerbations in previous year, disease severity, disease control, scores in ACT, CARAT, ALQ, SOA, ICS dose, fixed obstruction, basal FEV1, blood eosinophils (Table 2).
Table 2. Main characteristics obtained for total sample and each of five clusters.
| Variables Qualitative (n, %) Quantitative (M ± SD) | Total (n = 57) | C1 (n = 6) | C2 (n = 15) | C3 (n = 10) | C4 (n = 19) | C5 (n = 7) | Statistical analysis |
| Gender | |||||||
| Female | 42 (73.7) | 2 (4.8) | 12 (28.6) | 10 (23.8) | 18 (42.9) | 0 (0.0) | Fisher = 29.5 |
| Male | 15 (26.3) | 4 (26.7) | 3 (20.0) | 0 (20.0) | 1 (6.7) | 7 (46.7) | p < 0.001 |
| Age (years) | 45.6 ± 18.0 | 23.0 ± 6.8 | 53.7 ± 15.9 | 25.9 ± 8.4 | 49.9 ± 11.9 | 64.3 ± 8.3 | F(4,52) = 19.0 p < 0.001 |
| BMI (kg/m2) | 27.8 ± 6.0 | 21.2 ± 1.8 | 28.1 ± 4.7 | 26.9 ± 7.0 | 30.3 ± 6.8 | 27.3 ± 1.4 | F(4,52) = 3.2 p = 0.020 |
| Years of disease (years) | 24.0 ± 14.0 | 12.8 ± 8.7 | 31.8 ± 18.5 | 14.3 ± 7.4 | 24.4 ± 13.0 | 29.7 ± 13.8 | F(4,52) = 3.8 p = 0.009 |
| Disease onset under age 12 Y | |||||||
| No | 27 (47.4) | 2 (7.4) | 6 (22.2) | 1 (3.7) | 11 (40.7) | 7 (25.9) | Fisher = 15.4 |
| Yes | 30 (52.6) | 4 (13.3) | 9 (30.0) | 9 (30.0) | 8 (26.7) | 0 (0.0) | p = 0.003 |
| IgE sensitization | |||||||
| No | 18 (31.6) | 0 (0.0) | 5 (27.8) | 2 (11.1) | 9 (50.0) | 2 (11.1) | Fisher = 5.3 |
| Yes | 39 (68.4) | 6 (15.4) | 10 (25.6) | 8 (20.5) | 10 (25.6) | 5 (12.8) | p = 0.255 |
| Any smoke exposure | |||||||
| No | 36 (63.2) | 4 (11.1) | 10 (27.8) | 7 (19.4) | 13 (36.1) | 2 (5.6) | Fisher = 3.9 |
| Yes | 21 (36.8) | 2 (9.5) | 5 (23.8) | 3 (14.3) | 6 (28.6) | 5 (23.8) | p = 0.432 |
| Pneumonia history | |||||||
| No | 36 (63.2) | 5 (13.9) | 10 (27.8) | 6 (16.7) | 11 (30.6) | 4 (11.1) | Fisher = 1.6 |
| Yes | 21 (36.8) | 1 (4.8) | 5 (23.8) | 4 (19.0) | 8 (38.1) | 3 (14.3) | p = 0.857 |
| Rhinitis | |||||||
| No | 10 (17.5) | 0 (0.0) | 5 (10.0) | 1 (10.0) | 4 (40.0) | 0 (0.0) | Fisher = 4.6 |
| Yes | 47 (82.5) | 6 (12.8) | 10 (21.3) | 9 (19.1) | 15 (31.9) | 7 (14.9) | p = 0.282 |
| Anxiety (yes) | 13 (22.8) | 2 (15.4) | 5 (38.5) | 1 (7.7) | 5 (38.5) | 0 (0.0) | Fisher = 4.3 p = 0.361 |
| Depression (yes) | 6 (10.5) | 0 (0.0) | 3 (50.0) | 0 (0.0) | 3 (50.0) | 0 (0.0) | Fisher = 3.4 p = 0.482 |
| No. of comorbidities | 3.7 ± 1.8 | 3.5 ± 1.0 | 3.6 ± 1.4 | 3.6 ± 1.4 | 3.3 ± 1.4 | 5.6 ± 3.0 | F(4,52) = 2.6 p = 0.046 |
| Disease control | |||||||
| Yes | 10 (17.5) | 4 (40.0) | 5 (50.0) | 1 (10.0) | 0 (0.0) | 0 (0.0) | Fisher = 15.7 |
| No | 47 (82.5) | 2 (4.3) | 10 (21.3) | 9 (19.1) | 19 (40.4) | 7 (14.9) | p = 0.001 |
| Asthma control test (ACT) | 19.4 (4.35) | 23.5 ± 1.4 | 21.8 ± 2.1 | 19.6 ± 4.0 | 17.7 ± 3.2 | 14.8 ± 6.7 | F(4,52) = 7.6 p < 0.001 |
| CARAT (Rhinitis) | 6.7 (3.3) | 6.2 ± 1.8 | 9.3 ± 2.4 | 5.5 ± 2.1 | 6.0 ± 3.7 | 5.6 ± 4.0 | F(4,52) = 3.7 p = 0.010 |
| CARAT (Asthma) | 11.7 (4.5) | 15.7 ± 2.5 | 15.5 ± 3.4 | 11.1 ± 3.4 | 8.7 ± 3.1 | 9.4 ± 5.0 | F(4,52) = 9.5 p < 0.001 |
| Asthma life quality (ALQ) | 11.7 ± 3.8 | 7.7 ± 3.3 | 9.6 ± 2.9 | 11.7 ± 3.5 | 14.2 ± 2.7 | 12.9 ± 4.0 | F(4,52) = 7.5 p < 0.001 |
| Severe asthma score (SOA) | 10.3 ± 3.9 | 4.8 ± 2.5 | 8.7 ± 2.7 | 10.3 ± 4.0 | 11.6 ± 2.5 | 15.0 ± 2.8 | F(4,52) = 9.4 p < 0.001 |
| Therapeutics (GINA) | |||||||
| Until step3 | 3 (5.3) | 0 (0.0) | 2 (66.6) | 1 (33.3) | 0 (0.0) | 0 (0.0) | |
| Step3 | 14 (24.6) | 5 (35.7) | 1 (7.1) | 4 (28.6) | 4 (28.6) | 0 (0.0) | Fisher = 22.1 |
| Step4 | 37 (64.9) | 1 (2.7) | 12 (32.4) | 5 (13.5) | 14 (37.8) | 5 (13.5) | p = 0.003 |
| Step5 | 3 (5.3) | 0 (0.0) | 0 (0.0) | 0 (0.0) | 1 (33.3) | 2 (66.7) | |
| High-dose ICS | |||||||
| No | 35 (61.4) | 6 (17.1) | 13 (37.1) | 7 (20.0) | 9 (25.7) | 0 (0.0) | Fisher = 20.6 |
| Yes | 22 (38.6) | 0 (0.0) | 2 (9.1) | 3 (13.6) | 10 (45.5) | 7 (31.8) | p < 0.001 |
| OCS (last year) | |||||||
| 0 | 26 (45.6) | 5 (19.2) | 11 (42.3) | 4 (15.4) | 6 (23.1) | 0 (0.0) | Fisher = 20.9 |
| 1 | 18 (31.6) | 1 (5.6) | 3 (16.7) | 5 (27.8) | 7 (38.9) | 2 (11.1) | p = 0.013 |
| 2 | 6 (10.5) | 0 (0.0) | 0 (0.0) | 0 (0.0) | 4 (66.7) | 2 (33.3) | |
| ≥3 | 7 (12.3) | 0 (0.0) | 1 (14.3) | 1 (14.3) | 2 (28.6) | 3 (42.9) | |
| Severe exacerbation (previous year) | |||||||
| No | 27 (47.4) | 5 (18.5) | 11 (40.7) | 2 (7.4) | 8 (29.6) | 1 (3.7) | Fisher = 12.9 |
| Yes | 30 (52.6) | 1 (3.3) | 4 (13.3) | 8 (26.7) | 11 (36.7) | 6 (20.0) | p = 0.009 |
| FEV1 (%) | |||||||
| Baseline | 92.6 ± 26.4 | 114.0 ± 27.2 | 88.0 ± 24.0 | 114.7 ± 13.8 | 87.5 ± 24.3 | 66.1 ± 16.2 | F(4,52) = 6.7 p < 0.001 |
| FEV1/CVF (%) | |||||||
| Baseline | 76.7 ± 17.2 | 96.3 ± 5.7 | 71.1 ± 7.9 | 93.7 ± 15.4 | 73.4 ± 15.3 | 56.3 ± 6.6 | F(2,52) = 14.9 p < 0.001 |
| Fixed obstruction | |||||||
| No | 39 (68.4) | 6 (15.4) | 10 (25.6) | 10 (25.6) | 13 (33.3) | 0 (0.0) | Fisher = 21.4 |
| Yes | 18 (31.6) | 0 (0.0) | 5 (27.8) | 0 (0.0) | 6 (33.3) | 7 (38.9) | p < 0.001 |
| WHO | |||||||
| Non-severe | 24 (42.1) | 6 (25.0) | 7 (29.2) | 6 (25.0) | 5 (20.8) | 0 (0.0) | Fisher = 16.8 |
| Severe | 33 (57.9) | 0 (0.0) | 8 (24.2) | 4 (12.1) | 14 (42.4) | 7 (21.2) | p = 0.001 |
| FeNO (ppb): | |||||||
| <35 | 20 (60.6) | 2 (10.0) | 4 (20.0) | 5 (25.0) | 8 (40.0) | 1 (5.0) | Fisher = 4.8 |
| ≥35 | 13 (39.9) | 3 (23.1) | 3 (23.1) | 2 (15.4) | 2 (15.4) | 3 (23.1) | p = 0.320 |
| Serum IgE (log (mmol/L)) | 2.2 ± 0.6 | 2.7 ± 0.2 | 2.3 ± 0.7 | 2.1 ± 0.7 | 1.9 ± 0.4 | 2.5 ± 0.4 | F(4,52) = 3.2 p = 0.019 |
| Blood eosinophils (%): | 3.3 ± 3.3 | 3.3 ± 1.6 | 1.5 ± 1.3 | 1.8 ± 1.7 | 3.9 ± 1.7 | 7.7 ± 6.8 | F(4,52) = 7.0 p < 0.001 |
| Sputum eosinophils (%) | 24.0 ± 26.6 | 44.5 ± 48.8 (n = 2) | 21.3 ± 25.6 (n = 7) | 5.8 ± 6.3 (n = 4) | 24.3 ± 30.3 (n = 11) | 32.0 ± 21.4 (n = 6) | n.a. |
| Sputum neutrophils (%) | 50.8 ± 30.8 | 38.0 ± 53.7 (n = 2) | 59.4 ± 31.8 (n = 7) | 36.3 ± 32.1 (n = 4) | 50.6 ± 32.1 (n = 11) | 55.2 ± 25.7 (n = 6) | n.a. |
*p value from analysis of variance or Chi-square analysis between five clusters.
High-dose ICS: dose equivalent to over 750 μg fluticasone propionate daily.
Definition of abbreviations: BMI: body mass index; CARAT: control of allergic rhinitis and asthma test; CS: corticosteroids; FeNO: fractional concentration of nitric oxide in exhaled air; ICS: inhaled corticosteroids; LABA: long-acting b-agonists; NSAID HS: nonsteroidal anti-inflammatory drugs hypersensitivity; OCS: oral corticosteroids.
Sample characteristics obtained for total sample and each of five clusters are depicted in Table 2.
Cluster descriptionCluster1 (n = 6), early onset mild allergic asthma, with eosinophilic inflammation: it was the youngest and the least severe group, with a male prevalence. Subjects showed the lowest grade of obesity, the best lung function and disease control and the lowest health care recurrence, despite elevated FeNO values.
Cluster2 (n = 15), moderate allergic asthma, long evolution, female prevalence, mixed inflammation: although the older age and the high BMI, questionnaires showed good disease control, low impact of disease (both in life quality and lung function) and low severity.
Regarding biomarkers, there was no blood eosinophilia and sputum neutrophil percentage was the highest of all groups.
Cluster3 (n = 10), allergic brittle asthma, young females, early onset, no evidence of inflammation: mostly with disease onset before the age of 12, atopy was present in 80% of them. Mean BMI was lower, compared to C2. Lung function was normal in all evaluated parameters and disease was more frequently classified as non-severe. We found a good score in the ACT questionnaire, with normal lung function and no evidence of eosinophilic inflammation, despite high hospitalizations and severe exacerbation rates, suggesting a brittle phenotype.15
Cluster 4 (n = 19), severe asthma in obese females, late onset, mixed inflammation, highly symptomatic: this was the most prevalent and obese group, with a marked female prevalence, the majority having disease onset after the age of 12. Atopy was less frequent, compared with other groups, and depression-anxiety had more protagonists. None of these subjects showed disease control, reporting the worst quality of life of all groups.
Despite the high grade of symptoms and therapeutics, with frequent use of OCS and emergency care, lung function was not very impaired. There was a low grade of Th2 inflammation as we found a low percentage of blood eosinophils, with FeNO values frequently inferior to 35 ppb.
Cluster5 (n = 7), severe asthma with chronic airflow obstruction, late onset, long evolution, eosinophilic inflammation: subjects were all male, with age of disease onset above 12 years old, and presented a mean BMI of over 25 kg/m2. The mean age was the highest, with long disease evolution and more comorbidities (in particular IgE sensitization, smoke exposure and NSAID's HS). The ACT and CARAT scores were low, and ALQ and SOA were high, with frequent severe exacerbations, hospitalizations and use of OCS. Most of them showed CT scan abnormalities, air trapping being the most prevalent. Lung function evaluation showed the worst FEV1 out of all groups, with fixed obstruction in all patients (two with COPD overlap). The blood eosinophils count was the highest noted and FeNO was frequently over 35 ppb. Sputum analysis showed a mixed inflammation.
DiscussionAccording to Moore et al.,1 the algorithm approach using 5 clusters is sufficient for the classification of disease severity. We have here confirmed many results of Moore et al. but found other parameters of interest such as age, weight, disease control or severity, quality of life and blood eosinophilia. In other studies,2, 3 some of these characteristics were used in the cluster analysis, suggesting our data relevance.
Cluster discussionCluster1 (early onset mild allergic asthma, eosinophilic inflammation) overlapped with the less severe groups from other large-scale studies: C1 from Haldar et al.,2 C1 from Moore et al.1 and C1 from Wu et al.3
Cluster2 (moderate allergic asthma, long evolution, female prevalence, mixed inflammation), appears to overlap with some of the characteristics from C5 in Moore et al.1 (female prevalence, older age, high BMI). However there is differentiation in other variables (questionnaires showed good disease control, low impact of disease and low grade of severity).
Once asthmatic phenotypes are not static, with intrinsic and extrinsic factors acting as modifiers, it appears that C2 may be an evolution of mild allergic asthma, probably due to weight gain. This could modify the immunocellular response of early-onset allergic asthma into a mixed phenotype obesity related.
Cluster3 (allergic brittle asthma, young females, early onset, no evidence of inflammation) shared some of the characteristics with C3 from Haldar et al.2 (early onset asthma, symptom predominance) and with C1 from Moore et al.1 (mild allergic asthma). Despite the good score in the ACT questionnaire, a discordant score in CARAT (rhinitis) was noticed, showing a possible correlation to aeroallergen exacerbation triggers, responsible for the exacerbation rates, as described in the literature. The mean age of this group, as well as the female prevalence, may suggest some correlation of exacerbations to hormonal changes.
Cluster 4 (severe asthma in obese females, late onset, mixed inflammation, highly symptomatic) overlapped with C2 from Haldar et al.2 and C3 from Moore et al.1 (non-Th2 asthma-obesity related). The discordance between the high-intensity treatment, low disease control and relatively preserved lung function suggests a relation to factors, such as mechanics and psychogenics, and to concurrent comorbidities (like GERD or sedentary lifestyle). Another factor that might explain insensitivity to CS and better response to obesity-targeted treatment, already described in this phenotype,16 is the noticed low grade of Th2 inflammation. This gains importance as it points to a pathobiologic disease mechanism different from the Th2-eosinophilic phenotype.
Cluster5 (severe asthma with chronic airflow obstruction, late onset, long evolution, eosinophilic inflammation) presented the highest severity grade, corresponding to C5 of Moore et al.1 (severe patients with fixed obstruction) and C4 of Haldar et al.2 (asthma with predominant inflammation). Coincident with cluster results of a more recent study3 we verified blood eosinophilia and high FeNO values, most having eosinophilic or mixed sputum phenotype, with high blood eosinophils count, according to current data regarding severe patients.
This cluster also shares many of the characteristics found by the TENOR study17 for patients with asthma and chronic airway obstruction, being older, with frequent history of smoke exposure and many years of disease evolution, showing eosinophilic inflammation. Consistently, it is known that one of the mechanisms for persistent inflammation in asthmatics despite CS treatment is the reduction of HDAC2.18 Other pathobiologic mechanisms may be involved in this group as it had the highest prevalence of NSAID's HS.
According to Wenzel's questions regarding phenotype distinction5 (age of disease onset, eosinophilic inflammation and allergy), C4 and C5 (more severe groups) had disease onset after 12 years of age, and C3 and C2 before that age. C1 and C5 (less severe and most severe groups) showed an eosinophilic inflammation, and allergy was present in all groups.
We can then match our clusters to Wenzel endotypes:19 C1 is clearly associated with Th2 response; C4 with non-Th2 response; C2 and C5 with a mixed response with Th2 prevalence. Possible exogenous factors could be related with the mixed response in C5 (such as smoke exposure) and in C2 (weight could have modified the original endotype of these females) (Figure 2).
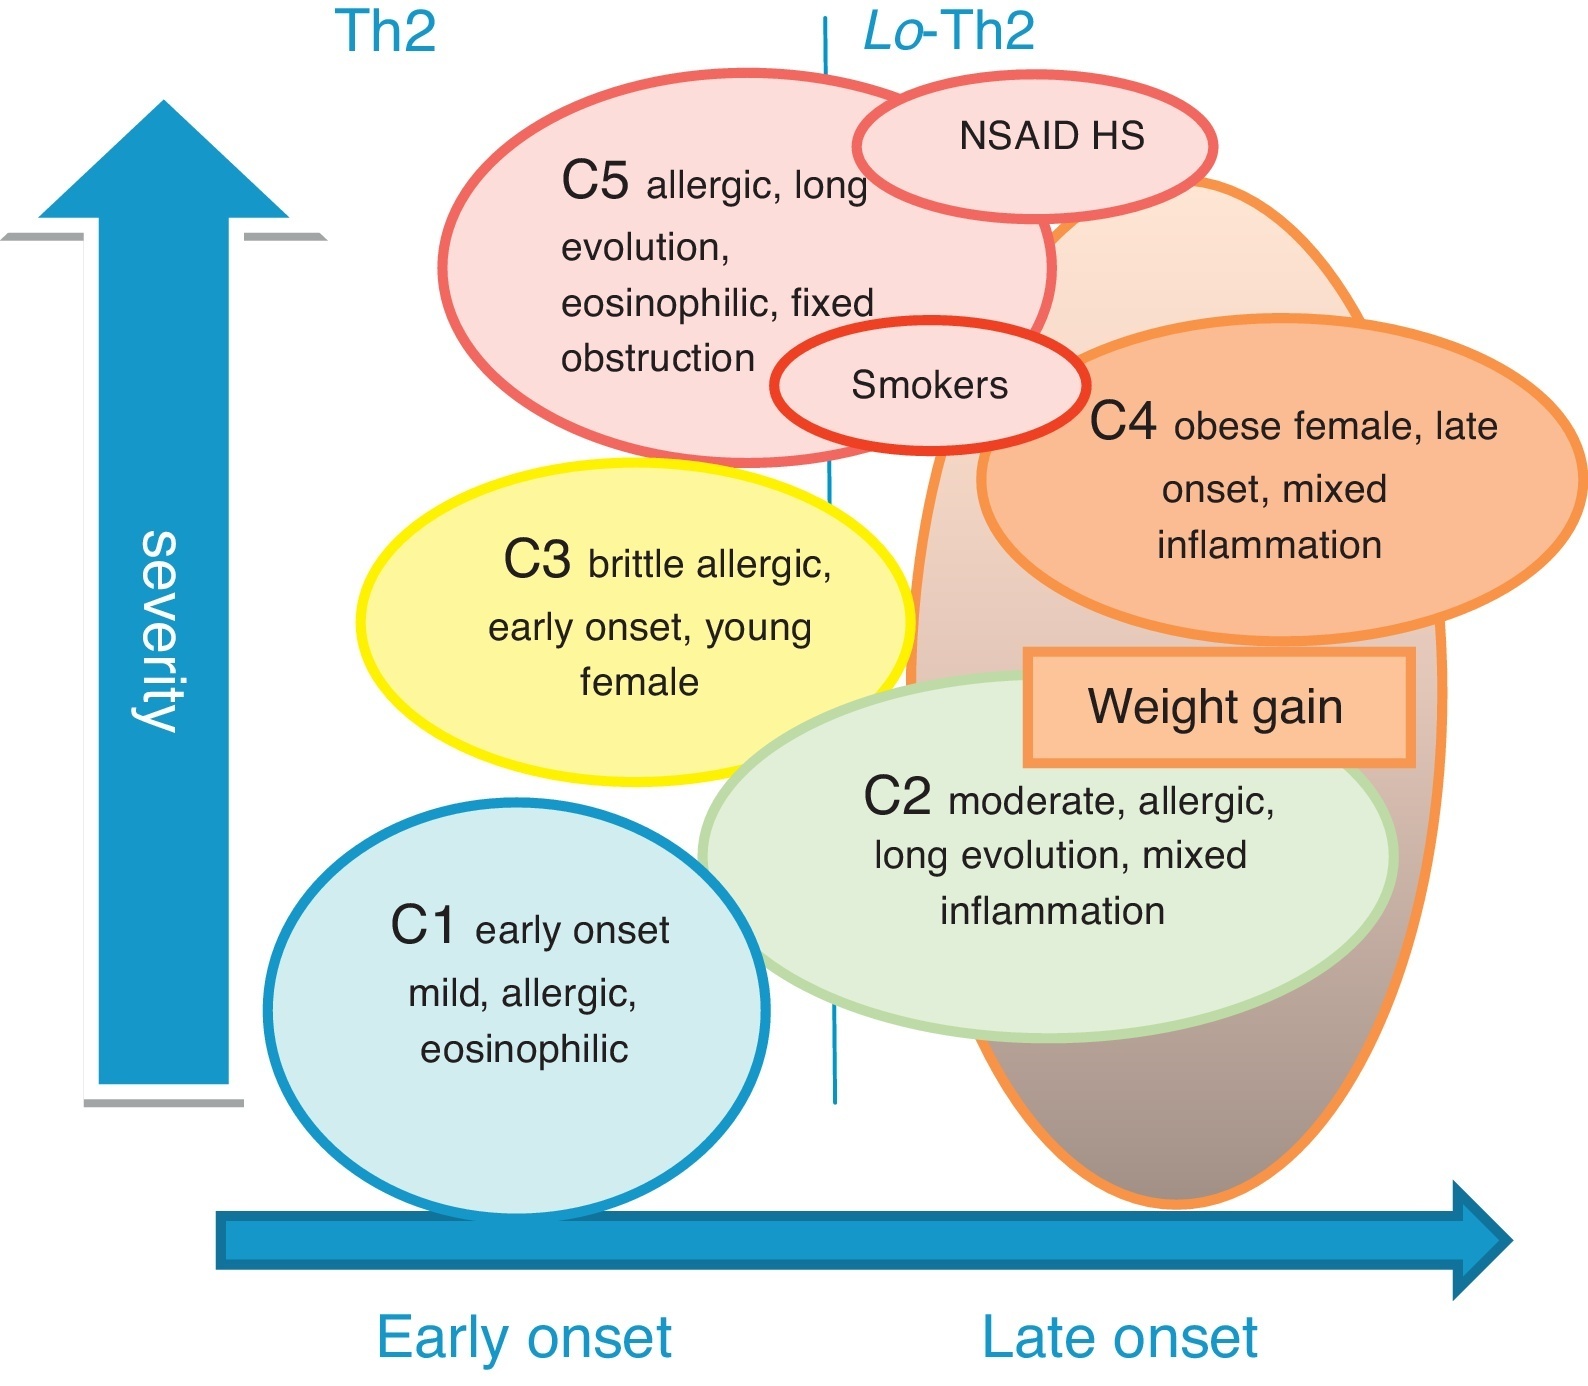
Figure 2. Adaptation of obtained clusters to Wenzel endotypes.
Limitations and strengthsCluster analysis requires a large number of patients and this study may give the impression of being underpowered. However, both methods used to assess cluster analysis (Ward method and two-step method) empirically validate our cluster results.
Another limitation is the applicability of our results to all clinical scenarios: our approach, applied to patients treated in a secondary health care unit, may not apply in primary health care.
ConclusionsThe results of this cluster analysis are consistent with those from other larger-scale studies. C1, early-onset mild allergic asthma, was recognized in previous Moore, Haldar and Wu clusters; C2 and C3, female clusters with symptom predominant early-onset disease in Haldar and Wu clusters; C4, a female obese cluster less allergic with late onset disease, in Moore clusters; C5, a late-onset eosinophilic cluster associated with nasal polyposis and mixed inflammatory cellular phenotype, in Moore, Haldar and Wu clusters.
Variables such as age at disease onset, obesity, lung function, FeNO (as Th2 biomarker) and severity were important for cluster characterization and distinction.
Authors’ contribution statementsCCL contributed to the study design, collected clinical data, contributed to the interpretation and global integration of the results, and wrote the manuscript draft; PSC performed the cluster analysis and statistical data analysis, and contributed to the interpretation of the results; ATB contributed to the study design and manuscript revision; JB contributed to the discussion on severe asthma and the writing of the paper.
Ethical disclosuresProtection of human and animal subjectsThe authors declare that no experiments were performed on humans or animals for this study.
Confidentiality of dataThe authors declare that no patient data appear in this article.
Right to privacy and informed consentThe authors declare that no patient data appear in this article.
Conflict of interestThe authors stated that there are no conflicts of interest regarding the publication of this article.
Acknowledgements
PSC's work was supported by Portuguese funds through the CIDMA – Center for Research and Development in Mathematics and Applications, and the FCT within the project UID/MAT/04106/2013.
We thank Anna Bedbrook for writing assistance.
Appendix A. Supplementary dataSupplementary material associated with this article can be found in the online version available at doi:10.1016/j.rppnen.2015.07.006.
Appendix A. Supplementary dataThe following are the supplementary data to this article:
Received 28 May 2015
Accepted 17 July 2015
Corresponding author. cchloureiro@gmail.com


