

In recent months two major fields of interest in pulmonary imaging have stood out: pulmonary fibrosis and pulmonary nodules. New guidelines have been released to define pulmonary fibrosis and subsequent studies have proved the value of these changes. In addition, new recommendations for classification of pulmonary nodules have been released. Radiological images are of major interest for automated and standardized analysis and so in both cases software tools using artificial intelligence were developed for visualization and quantification of the disease. These tools have been validated by human readers and demonstrated their capabilities. This review summarizes the new recommendations for classification of pulmonary fibrosis and nodules and reviews the capabilities of radiomics within these two entities.
Diagnosis of pulmonary diseases is based on different diagnostic tests including lung function tests, blood/sputum test, etc. Imaging is one of the pieces that make up the diagnostic puzzle to establish the correct diagnosis. Unlike other tests, imaging provides non-invasive, regional and high-resolution static or dynamic information on lung parenchyma. Therefore, imaging plays a major role in diagnosis and monitoring of pulmonary diseases. This is reflected in the huge and growing number of annual publications within this area.
This review focus on topics published within the last 18 months. A Pubmed® search resulted in approximately 6500 publications within this period, with a focus on two major topics which will be covered in detail. The largest field of research was associated with interstitial lung diseases. The second largest topic was identified as detection and classification of lung nodules/bronchial carcinoma combined with radiomics.
Imaging in pulmonary fibrosisInterstitial lung diseases (ILD) comprise a large and heterogeneous group of diseases, some with a significant reduced life expectancy. Correct diagnosis is crucial for early and optimal treatment, especially as new treatment options become available. In 2018 the revised European Respiratory Society (ERS) guidelines for diagnosis were published.1 These guidelines underline the importance of imaging, especially high-resolution computed tomography (HRCT), for evaluation of interstitial lung diseases. This is of great importance, because for a definite usual interstitial pneumonia (UIP) CT scan lung biopsy is obviated.
The 2011 guidelines used three classifications for CT based diagnosis: “UIP pattern”, “Possible UIP pattern” and “Inconsistent with UIP pattern”.2 In a large cohort of patients with UIP radiological and histological findings were compared. Among those with UIP on HRCT, 97% had histological definite or probable UIP. However, 95% of patients with “inconsistent” HRCT features had histological definite or probable UIP.3 The authors concluded, that subjects with CT findings “inconsistent with UIP” may have IPF, and suggests that this term is misleading.
In an earlier study even four categories of UIP diagnosis on CT scans were used: “inconsistent”, “indeterminate”, “probable” and “definite”.4 Even with this more tailored classification, the proportions of histological UIP diagnoses in those with probable vs. definite UIP on CT scan and in those with inconsistent vs. indeterminate UIP on CT scan were not statistically different. The proportions of UIP diagnoses on histology in probable UIP vs. indeterminate UIP on chest CT scan were statistically different. In those with probable UIP on CT scan, 82.4% of subjects had a probable or definite UIP diagnosis on histology compared with 54.2% of subjects with indeterminate UIP on CT scan.
These and other observations led to the revised guidelines published 2018. Currently four categories of HRCT patterns should be used: “UIP”, “probable UIP”, “indeterminate for UIP”, and “alternative diagnosis”.1 The HRCT imaging features were characterized as follows:
- •
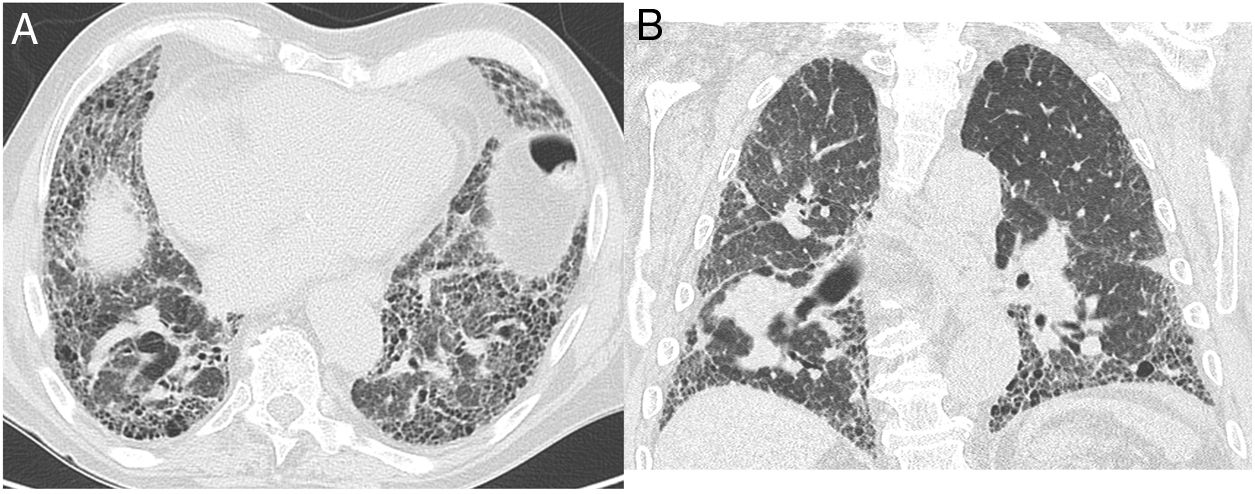
“UIP”: Honeycombing must be present; it can be seen with or without traction bronchiectasis (Fig. 1). The typical distribution of UIP is subpleural with basal predominance, although some upper lobe involvement is common. Mediastinal lymphadenopathy may be present in patients with UIP. Ground-glass opacification may be present, but it is not a dominant feature and is usually accompanied by a superimposed reticular pattern.
- •
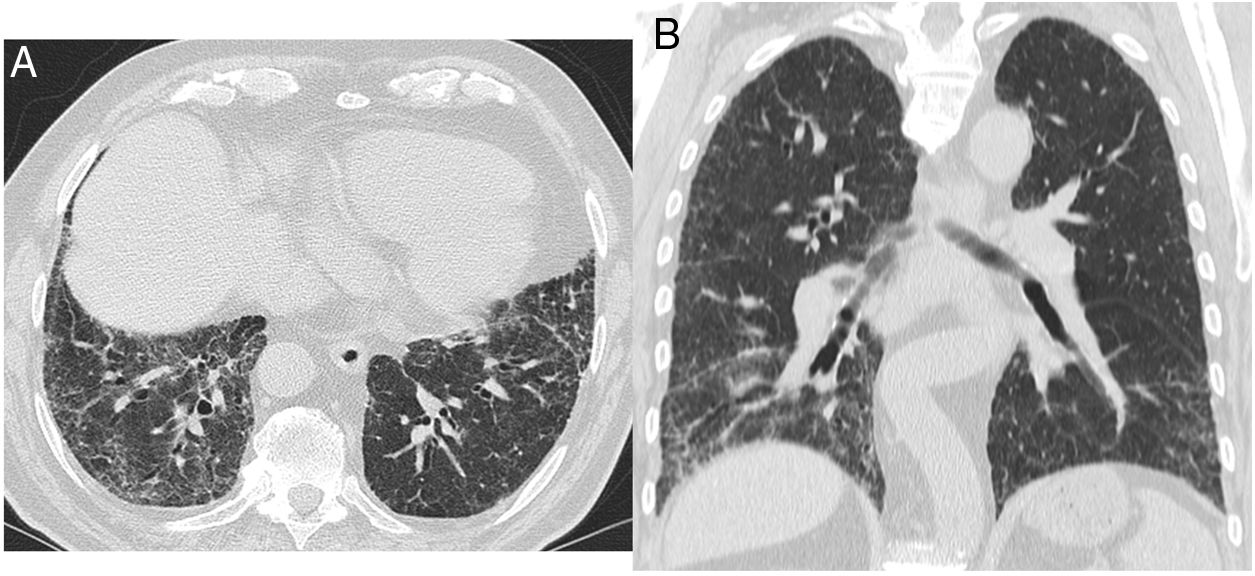
“Probable UIP”: Subpleural, basal-predominant reticular abnormalities with peripheral traction bronchiectasis or bronchiolectasis (Fig. 2). As with a UIP pattern, ground-glass opacification may be present in probable UIP, but it is not a dominant feature.
 displays subleural predominant interstitial changes without clear honeycombing. The coronal reformatted image (B) shows the apicobasal gradient of the pulmonary changes. Also traction bronchiectasis are present, also mild ground glass opacification.") Figure 2.
Figure 2.CT images with the features of probable UIP pattern. (A) displays subleural predominant interstitial changes without clear honeycombing. The coronal reformatted image (B) shows the apicobasal gradient of the pulmonary changes. Also traction bronchiectasis are present, also mild ground glass opacification.
(0.12MB). - •
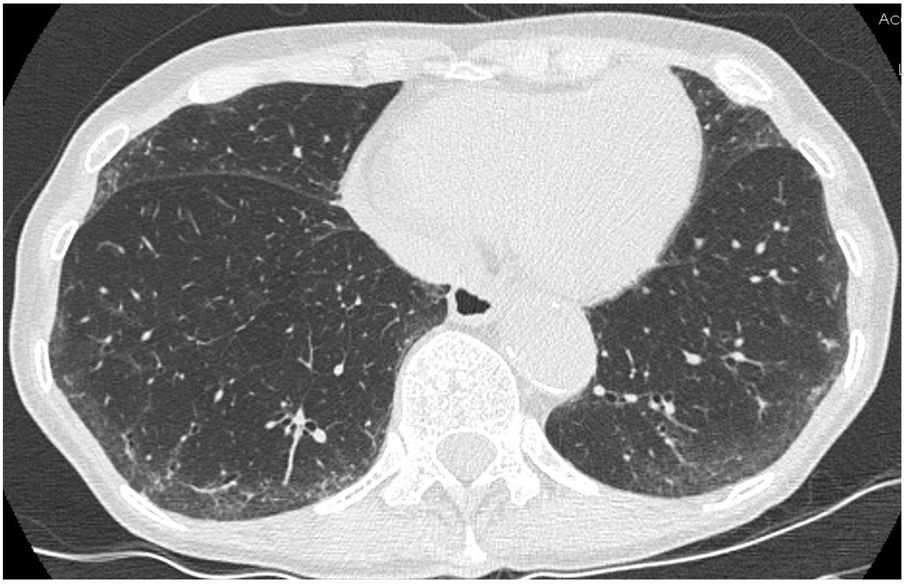
“Indeterminate for UIP”: Features of fibrosis are demonstrated but does not meet UIP or probable UIP criteria and does not explicitly suggest an alternative diagnosis (Fig. 3). This includes patients with very limited subpleural ground-glass opacification or reticulation without obvious CT features of fibrosis, for whom there is a suspicion that early UIP or probable UIP is present. In such cases, it should be confirmed with prone inspiratory views that the subpleural opacities do not represent dependent atelectasis.
 Figure 3.
This CT images shows only minor subpleural interstitial changes, to be classified as “indeterminate for UIP”. To exclude a gravity dependency prone images were acquired showing the same changes. These changes show no honeycombing. Mild peripheral bronchiectasis are being noted indicative for a fibrotic component.
(0.09MB). - •
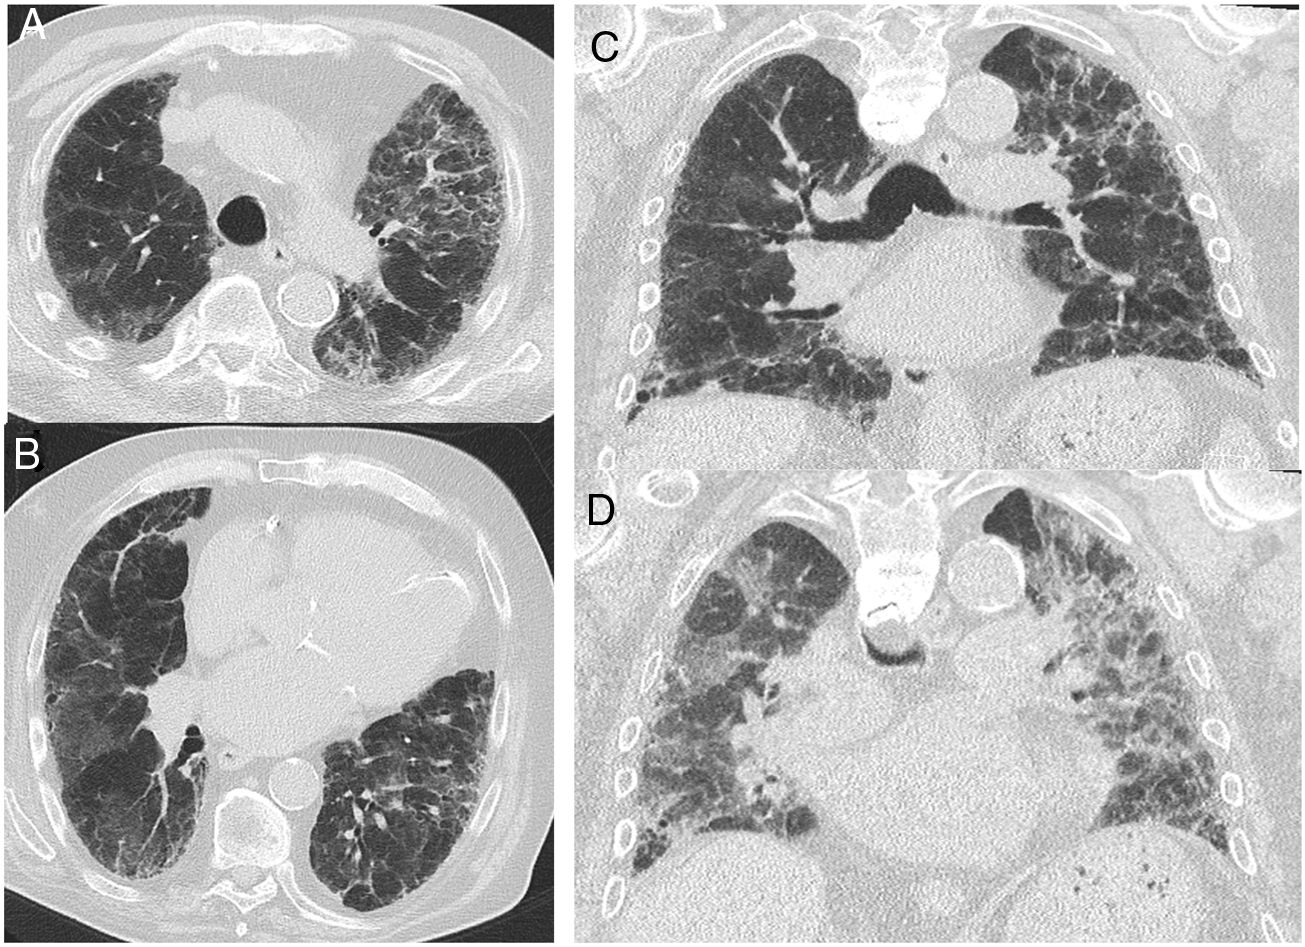
“Alternative diagnosis”: In some cases of fibrotic lung disease, there is clinical suspicion of IPF, but the HRCT pattern suggests an alternative diagnosis (Fig. 4). Examples include bronchocentric fibrosis in the upper lobes or profuse mosaic attenuation that suggest hypersensitivity pneumonitis, posterior fibrotic retraction of the hila in sarcoidosis, or extensive ground-glass opacification with subpleural sparing in fibrotic nonspecific interstitial pneumonia (NSIP).
 show axial slices with interstitial parenchymal changes, but no honeycombing and marked ground glass opacification. Coronal reformats (C) show the distribution of the disease being more uniformly distributed between upper and lower lung areas. (D) shows a coronal CT image in expiration with sharply demarcated areas of air trapping.") Figure 4.
Figure 4.CT images in a case with an alternative diagnosis — in this case fibrosing NSIP. (A + B) show axial slices with interstitial parenchymal changes, but no honeycombing and marked ground glass opacification. Coronal reformats (C) show the distribution of the disease being more uniformly distributed between upper and lower lung areas. (D) shows a coronal CT image in expiration with sharply demarcated areas of air trapping.
(0.26MB).
 clearly the subpleural honeycombing is visible as well as traction bronchiectasis. On the coronal reformat (B) the apicobasal gradient is noted.")
 displays subleural predominant interstitial changes without clear honeycombing. The coronal reformatted image (B) shows the apicobasal gradient of the pulmonary changes. Also traction bronchiectasis are present, also mild ground glass opacification.")

 show axial slices with interstitial parenchymal changes, but no honeycombing and marked ground glass opacification. Coronal reformats (C) show the distribution of the disease being more uniformly distributed between upper and lower lung areas. (D) shows a coronal CT image in expiration with sharply demarcated areas of air trapping.")
This was stressed in a White Paper of the Fleischner Society,5 which emphasized that a surgical lung biopsy should be considered when the CT pattern is indeterminate or inconsistent with UIP, or when there are clinical features to suggest an alternative diagnosis (e.g. exposures suggestive of HP). However, it should be noted this implies that honeycombing does not have to be present for a diagnosis of UIP.6
The importance of exact classification of disease is underlined by the results of the AGES-Reykjavik study.7 Within this large study out of 5320 participants 3167 had a second CT scan five years after the first one. The presence and/or progression of interstitial lung disease was matched with mortality. One hundred percent of patients with UIP pattern and 89% of patients with a probable UIP pattern had died. Sixty-six percent of patients with a CT pattern indeterminate for UIP had died and 68% of participants with a CT pattern consistent with a non-IPF diagnosis had died. Therefore, participants with either a CT pattern of UIP and probable for UIP had an increased risk of death when compared to participants indeterminate for UIP, (HR = 3.9, 95% CI 2.3–6.8, P < 0.0001) and (HR = 1.7, 95% CI 1.2–2.4, P = 0.001) respectively.
One risk factor for developing ILD was found to be smoking habit.8 In the Danish lung cancer screening trial 17% of smokers showed ILD. Smokers with ILD had an increased risk of death (hazard ratio 2.9).
To establish a definite diagnosis a multidisciplinary board is advised.1 However, there is not always one at hand and furthermore, the criteria for definition of idiopathic pulmonary fibrosis (IPF) are difficult to remember, especially, if not used on a daily basis. To optimize establishment of diagnosis a software tool was developed to guide a radiologist through the criteria of fibrosis.9 Using this tool, a sensitivity of 95.5% and specificity of 96.2% was reached. It should be mentioned, that this software tool cannot replace a dedicated fibrosis board, but it can help to bring the current guidelines into daily practice.
Recently, new treatment options have been developed to slow down the progression rate like Tyrosine kinase inhibitor or inhibition of TNF-beta production. The selective chitinase inhibitor OATD-01 reduced lung fibrosis in a mouse model and had an acceptable safety profile in healthy volunteers. The calcium-sensing receptor (CaSR) is upregulated in IPF lungs and CaSR antagonists reduced fibrotic markers in vitro.10 These therapeutic agents need further investigation regarding efficacy, thus requiring close (image based) monitoring.11 It requires experienced radiologists to gain a high inter-reader reproducibility (kappa 0.78) compared to inexperienced readers (kappa 0.37).12 Therefore, an automatic classification and grading system would be desirable for correct staging and longitudinal follow-up.13
One piece of software which provides a quantitative evaluation of typical fibrotic changes like ground glass opacification, reticulations, honeycombing, emphysema, and consolidations is called “Caliper” (Computer Aided Lung Informatics for Pathology Evaluation and Rating).14,15 In a clinical study 66 patients were evaluated by 2 experts in thoracic radiology and quantitatively at baseline and 1.1 years follow-up.16 The software showed a much smaller standard deviation of all parameters at follow-up. The largest discrepancy between visual and quantitative evaluation was seen in ground glass opacification (−1% versus 5.3%). The quantitative values correlated better with changes in pulmonary function test than the visual read-outs. It has to be pointed out that traction bronchiectasis — only assessable on visual readings — was the best indicator of clinical disease progression.
It might be important to use a fibrosis score for prediction of mortality risk. 144 IPF patients were examined by CT of the chest and evaluated by a texture-based quantification software. The fibrosis score was defined as the sum of the extent of honeycombing and reticular opacity. It was also shown, that the fibrosis score was a significant predictor of survival.17
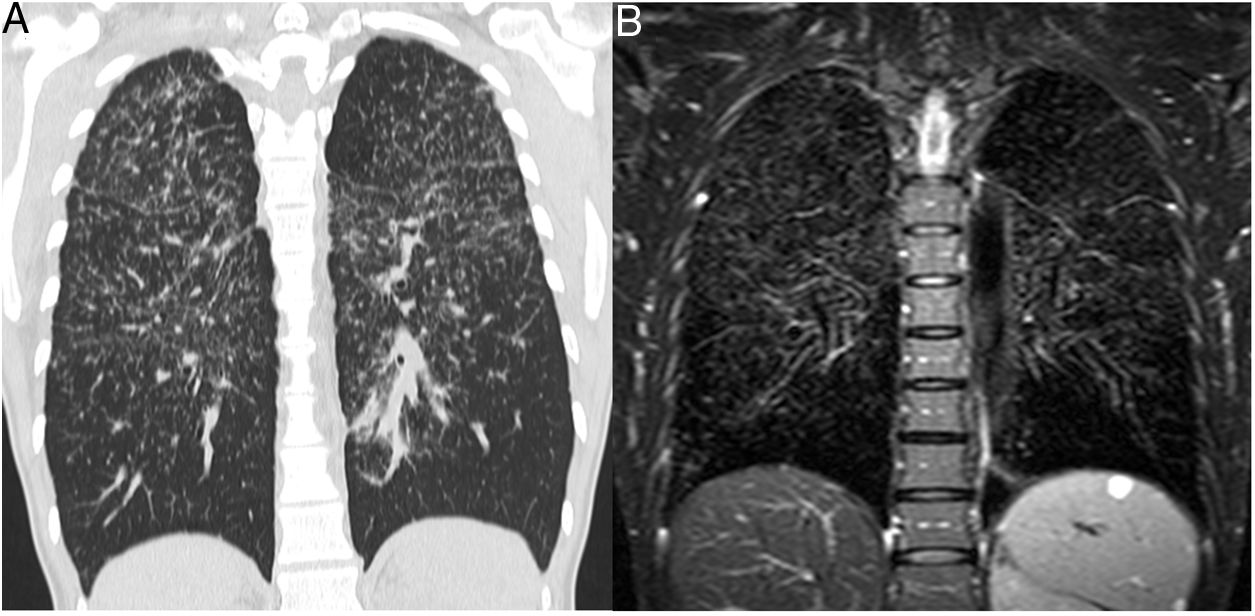
Besides CT imaging, magnetic resonance imaging (MRI) can be used for visualization of the lung parenchyma (Fig. 5).18 So far MRI is primarily used in studies with small number of patients as the dedicated sequences required are not broadly available.15 MRI techniques with ultrashort echo times (UTE) combined with free breathing acquisition and 3D technique showed a comparable diagnostic accuracy in ILD as CT.19 Application of intravenous contrast material can help to differentiate inflammation from fibrotic-predominant pathology. An early T1 enhancement is more likely to be associated with inflammation.15 Late contrast-enhanced MRI signal was significantly increased in the lungs of 20 patients with IPF compared with 12 healthy volunteers.20 There was a strong correlation between the degree of pulmonary fibrosis on late enhanced MRI and HRCT.
 The CT image shows the typical nodular and interstitial parenchymal changes. (B) The corresponding coronal T2w SPAIR image shows the same typical pattern of lung parenchymal changes as CT. The normal lung areas remain dark due to the normal amount of air included.")
Patient with sarcoidosis, stage 2. (A) The CT image shows the typical nodular and interstitial parenchymal changes. (B) The corresponding coronal T2w SPAIR image shows the same typical pattern of lung parenchymal changes as CT. The normal lung areas remain dark due to the normal amount of air included.
Pulmonary nodules are frequently found on thoracic CT examinations. For incidentally detected pulmonary nodules guidelines from the Fleischner Society can be used for recommendation of work-up.21,22 These guidelines suggest no routine CT follow-up for solid nodules with a volume <100 mm3 (or smaller than 6 mm diameter). This recommendation has been proposed for all patients, regardless of their clinical risk status. The threshold size of 100 mm3 was established to exclude from CT follow-up all solid nodules with a cancer risk less than 1%. However, the presence of a suspicious morphology (such as spiculation), an upper lobe location or both in nodules <100 mm3, increases the cancer risk by up to 5%. Thus, high-risk patients with solid nodules <100 mm3 with a suspicious morphology and/or an upper lobe location should undergo a CT scan after one year. A survey amongst Italian radiologists showed, that 58% of radiologists adhere to the Fleischner guidelines.23 Interestingly, more experienced radiologists (>20 years) adhered significantly less to the guidelines and favored their own experience. Fifty-six.six and 75.6% of respondents had a more cautious approach than that recommended by the guidelines and tended to use a shorter follow-up for both solid and ground-glass nodules, respectively.
In a retrospective analysis of coronary CT angiography for acute coronary syndrome (2066 patients), 438 pulmonary nodules were found (28% incidental pulmonary nodules).24 The 2017 guidelines reduced the number of individuals requiring follow-up by 64.5% when compared to prior guidelines. In other words, only 4.5% of all patients undergoing emergent coronary CT angiography would receive pulmonary nodules follow-up testing per 2017 guidelines versus 12.8% per prior guideline.24
Another retrospective analysis over 7 years included 27 patients with solitary pulmonary nodules ≤250 mm3 (≤8 mm diameter) and follow-up more than 2 years or histopathology.25 Five growing nodules were observed, all in the high risk group (smoking history or exposition to noxious inhalative agents). These nodules were surgically resected with a histological diagnosis of non-small cell lung cancer. Furthermore, it has to mentioned, that 4/5 malignant nodules were located in an upper lobe. Applying the new Fleischner Society guidelines, 24 all 5 malignant nodules would have been identified with significant less overall follow-up examinations in patients with incidental pulmonary nodules.
As size is a major discriminator within the guidelines, 107 chest radiologists from 25 countries were asked to evaluate 69 nodules.26 The results showed that variation in diameter was greatest at key thresholds (5 mm and 6 mm). Agreement for radiologists’ recommendations was poor (κ = 0.30); 21% disagreed with the majority. Measurement variation was not influenced by observer experience. Especially large variations were found for the solid component in part solid nodules with a median variation of 14 mm. An important ancillary finding of the study was the poor-to-moderate agreement for other morphological variables. These findings explain, that even though clear recommendations are present, the overall agreement for the choice for further management was only fair (κ = 0.296). In other words, 79% of radiologists agreed on the majority decision for further management.
As even expert radiologists have difficulties in agreeing over nodule sizes and morphological parameters, computer algorithms were used to define clinical relevance of specific imaging features of pulmonary nodules. 75 pulmonary nodules (42 malignant) were used to define the most significant features between malignant and benign lesions.27 The combination of 4 features resulted in accuracy for differentiation of 84%, sensitivity 93% and specificity 73%. Another team used low dose CT datasets from the Lung Image Data-base Consortium image collection to extract features from 72 pulmonary nodules.28 They extracted two features, anterior-posterior dimension and inhomogeneity, of a nodule allowing for an accuracy of 85% of prediction of malignancy compared to 72% based on Lung-RADS. This means that the smaller the nodule and the more homogeneous it is, the more likely it is to be benign. These studies demonstrated the positive impact of computer assisted analysis on lung cancer evaluation. However, the impact of different CT examination protocols onto quantitative nodule features remained unknown. To investigate the influence of slice thickness, reconstruction algorithm and radiation dose spherical lung nodule phantoms of known densities were inserted into an anthropomorphic thorax phantom.29 CT data were reconstructed using 12 different imaging settings. Slice thickness, radiation doses, and reconstruction algorithm had a significant impact on the quantitative image features. In clinical studies involving deep learning or radiomics, it should be noted that differences in values can occur when using computer features obtained from different CT scan parameters in combination. It is especially worth noting that most computer features showed significant difference between 30 and 120 mAs. Therefore, the current recommendation for low dose follow-up examinations needs to be critically discussed when it comes to automatic analysis.
Even within a screening setting for lung cancer radiation dose is always a concern. As radiation free technique MRI is a promising technology.30 Ultrashort echo time, which is used in conjunction with the PD-weighted 3D GRE sequence, showed a high agreement regarding nodule detection, characterization and interreader agreement compared to CT and low-dose CT.31 In a small lung cancer screening trial MRI showed an excellent sensitivity and specificity for nodule detection for nodules ≥6 mm, especially T2 Short-TI Inversion recovery imaging allowed for excellent differentiation between malignant and benign lesions.32,33
ConclusionThe newly released guidelines for classification of pulmonary fibrosis highlight the role of imaging for stratification of patients. Using CT imaging even makes lung biopsies obsolete. Also, imaging features allow for prediction of survival of IPF patients. Software-based analysis can be an important positive factor for standardization of reports and will allow for reliable quantification of disease severity.
For pulmonary nodules the same trend is noted, even more convincingly. The new recommendations for incidentally detected nodules are more relucted and allow larger diameters of nodules to be benign. However, human experts have difficulty in precise measuring and characterizing of nodules. Software tools offer more reliable measurements of volumes of nodules and are more in line with the guidelines than expert radiologists. However, radiomics has its difficulties with radiation reduced imaging.


