
Several studies have reported that computed tomography pulmonary angiography is the best method for diagnosing pulmonary embolism (PE). This study, however, aimed to predict or exclude PE using the end-tidal carbon dioxide (ETCO2) value and alveolar dead space fraction (AVDSf) together.
Methods and MaterialsOne-hundred patients were included in the present study. Patients with suspected PE were evaluated using clinical prediction rules proposed by the Wells and the Modified Geneva scoring systems. PE was ruled out in patients with normal d-dimer concentrations (< 0.55 mg/dl). Patient ETCO2 values were recorded using time versus waveform capnography before performing imaging studies. Capnography was performed for 2 min; however, the average ETCO2 values measured over the final 1 min were recorded in “full continuous” mode. Arterial puncture was performed simultaneously for arterial blood gas analysis. Additionally, AVDSf was calculated according to the Bohr equation.
ResultsPE was detected in 36 % of patients. Patients were classified into high-, moderate, and low-risk groups according to the Wells and Modified Geneva scores. PE was excluded in 95 % and 100 % of patients with low Wells and Modified Geneva system scores, respectively, when ETCO2 was > 28.5 mmHg. The diagnosis of PE was excluded in 100 % of patients with low Wells and Modified Geneva scoring system scores with AVDSf < 0.128. High wells and Modified Geneva system scores were helpful in diagnosing of PE (100 %) when AVDSf was > 0.128.
ConclusionIt was possible to exclude/predict PE based on ETCO2 and AVDSf values calculated using capnography when evaluated with clinical prediction rules and d-dimer test using an algorithm.
Pulmonary embolism (PE) is one of the most common thromboembolic disorders, with complications ranging from mild symptoms to severe clinical conditions such as life-threatening right heart failure. Due to the nonspecific clinical presentations of PE, an incorrect approach to the work-up may be harmful to the patient or may result in recurrent thromboembolic events, bleeding, or death.1
Age adjusted d-dimer concentration can rule out PE in patients with low risk scores according to the Wells criteria.2 The remaining patients often undergo computed tomography (CT), which is costly and time-consuming, and may yield a false-positive result and pose a risk for contrast-associated allergic reaction, nephropathy, and radiation-associated solid tumors.3
In recent years, the use of capnography—a simple, non-invasive, rapid, and practical technique based on simple physiopathology—for diagnosing PE has been investigated as a potentially useful method.4,6
Pulmonary vascular obstruction is indirectly reflected by the alveolar dead space fraction (AVDSf) and end-tidal carbon dioxide (ETCO2). Because capnography can be used to evaluate these parameters, it has been recommended as a valuable tool to exclude PE. In PE, the lung compartment is ventilated but non-perfused. The AVDSf prevents sufficient gaseous exchange and decreases the alveolar carbon dioxide (CO2) content, which can be measured using a bedside capnograph. Clinical presentation of conditions, such as angina, is similar to that of PE, but does not exhibit increased AVDSf. Conditions that increase AVDSf, such as chronic obstructive pulmonary disease, are easily distinguished from PE. AVDSf, which is estimated using the partial pressure of arterial CO2 (PaCO2) – ETCO2 gradient, reflects the proportion of the lung that is ventilated but not perfused.7
The aim of this study was to exclude or predict PE using an algorithm to evaluate capnographs, clinical prediction rules, Wells and/or Modified Geneva scores, and d-dimer assays without using advanced imaging modalities because patients may not always be suitable for these modalities and, moreover, they are not availabile in all centers.
MethodsEthics committee approval was obtained from XX University in May 2016 (GO 16/341-08). Written informed consent was obtained from all participants. A prospective observational study was performed between November 2016 and May 2017 in the Emergency Department of XX University, in Ankara, Turkey.
Patients with suspected pulmonary thromboembolism were included in the study. The 2014 European Society of Cardiology (ESC) PE guidelines were followed for investigating PE. Individuals < 18 years of age, those who refused or were unable to participate, and those with a contrast allergy according to the 2014 ESC guidelines were excluded. In addition, those with low-risk clinical prediction rules that met all the PE rule-out criteria (PERC) or negative d-dimer assay results and moderate-risk clinical prediction rules with negative d-dimer assay results, were also excluded.
A capnography device (Covidien, USA), provided by the scientific research project unit of the authors’ university, was used.
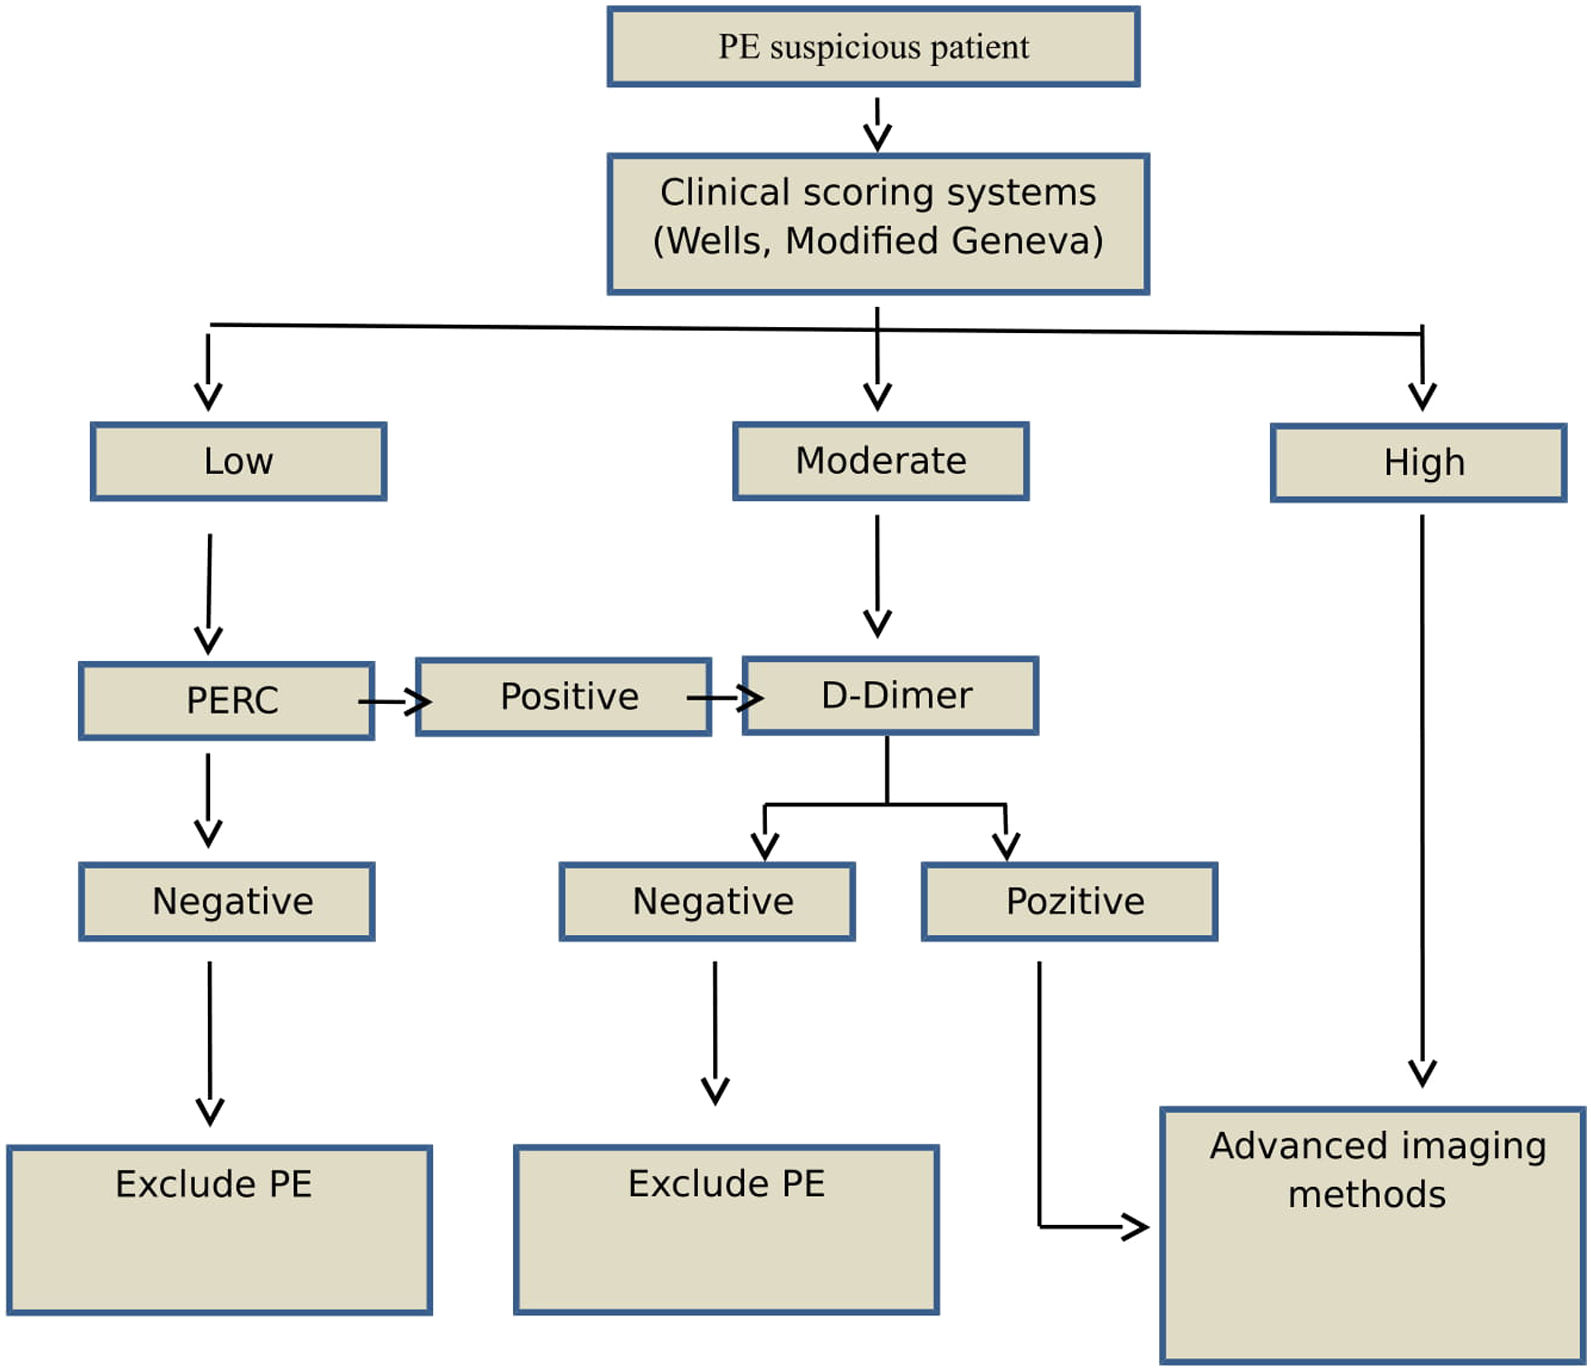
Study designAge, sex, and PE-associated symptoms (dyspnea, pleuritic chest pain, cough, substernal chest pain, fever, hemoptysis, syncope, unilateral leg pain, and deep venous thrombosis [DVT]) of each patient were recorded. Patients with suspected PE were evaluated using clinical prediction rules and the Wells and Modified Geneva scoring systems (low, moderate, or high risk) (Fig. 1). According to the 2014 ESC guidelines, patients classified as low-risk based on clinical prediction rules, but not PERC, underwent a rapid quantitative ELISA plasma d-dimer test. Moderate-risk patients underwent d-dimer testing, while high-risk patients underwent further evaluation using advanced imaging methods without the d-dimer test. PE was ruled out in patients with normal d-dimer concentrations (< 0.55); these patients were not included in the study.
.")
Capnographs and arterial blood gas samples were first evaluated in patients who were chosen to undergo advanced imaging. All high-risk patients identified based on positive d-dimer test results or clinical prediction rules were evaluated using advanced imaging methods. Patients requiring advanced imaging modalities underwent CT angiography, ventilation/perfusion (V/P) lung scintigraphy or echocardiography, and lower extremity venous doppler ultrasonography (USG). Based on the results of these advanced imaging examinations, patients were divided into two groups according to the presence of PE.
Diagnostic studiesCapnographic measurementsIn the present study, a side-stream capnograph (Covidien, USA) was used. The capnograph was calibrated before each use, as recommended by the manufacturer. Patients who were not intubated underwent slow and proper breathing training before the data were recorded using the capnograph. Data were recorded in “full continuous” mode. ETCO2 was recorded as a time waveform. A single-use O₂/CO₂ nasal filter line (Microstream) was used in patients who were not intubated, and a Microstream FilterLine Set was used in patients who were intubated during recordings. Capnography was performed for 2 min; however, the average ETCO2 values measured over the final 1 min were recorded. Arterial puncture was performed simultaneously for arterial blood gas analysis. Additionally, AVDSf was calculated using the following formula derived from the Bohr equation:
Advanced imaging methodsCT was the first choice in patients with suspected PE. CT angiography is performed only when a patient is not pregnant and exhibits normal renal function. A radiologist performed CT angiography. Based on the results of CT angiography, patients were divided into two groups according to the presence of PE. Patients with a glomerular filtration rate < 50 % were evaluated using V/P lung scintigraphy or echocardiography, and lower extremity venous doppler USG. A nuclear medicine specialist performed V/P lung scintigraphy and reported the presence or absence of high suspicion for PE. Patients who were pregnant first underwent echocardiography and lower extremity venous doppler USG. A cardiologist performed echocardiography and reported the corresponding results. Findings suggestive of PE (increased pulmonary artery pressure, septum flattening, septum paradoxical movement, findings of right ventricular loading, and McConnell’s sign) were recorded using echocardiography. Evidence of DVT was detected using bilateral lower extremity venous doppler USG by radiologists. Patients with DVT and exhibiting signs of PE based on echocardiography were considered to have PE.
Statistical analysisCategorical and numerical data were subjected to kikarke and t-test or Mann-Whitney test, respectively. Receiver operating characteristic (ROC) analysis was performed using software to determine optimal cut-off points, and P < 0.05 was considered to be statistically significant. Statistical analyses were performed using SPSS version 23.0 (IBM Corporation, Armonk, NY, USA).
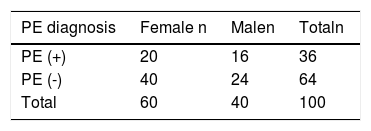
ResultsPatient characteristicsFrom the 200 patients with suspected PE, 100 were included in the study, of whom PE was detected in 36 % (n = 36).The mean age of patients diagnosed with PE (66 years) was older than that of those without PE (59 years) (P = 0.04). Sixty percent of the patients were female, and 56 % of those diagnosed with PE were female (P = 0.64).
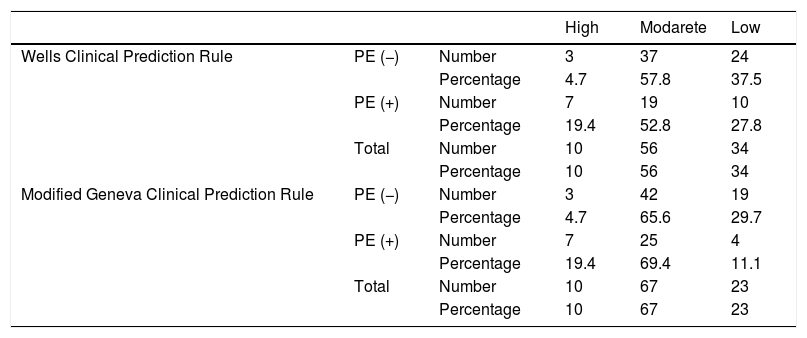
Clinical Prediction Rule: The distribution of patients according to clinical prediction rules and Wells and Modified Geneva scores is shown in Table 1. While Wells clinical prediction rule was not found to be significant in determining PE (P = 0.05), the Modified Geneva score was significant (P = 0.01)
Diagnosis of PEEighty percent of the patients (n = 80) underwent CT angiography, with PE detected in 32.5 % (n = 26). Seventeen percent (n = 17) of the patients underwent lung V/P scintigraphy, with PE detected in 58.8 % (n = 10). Three percent of the patients underwent echocardiography only and Doppler USG, and PE was not detected in this group.
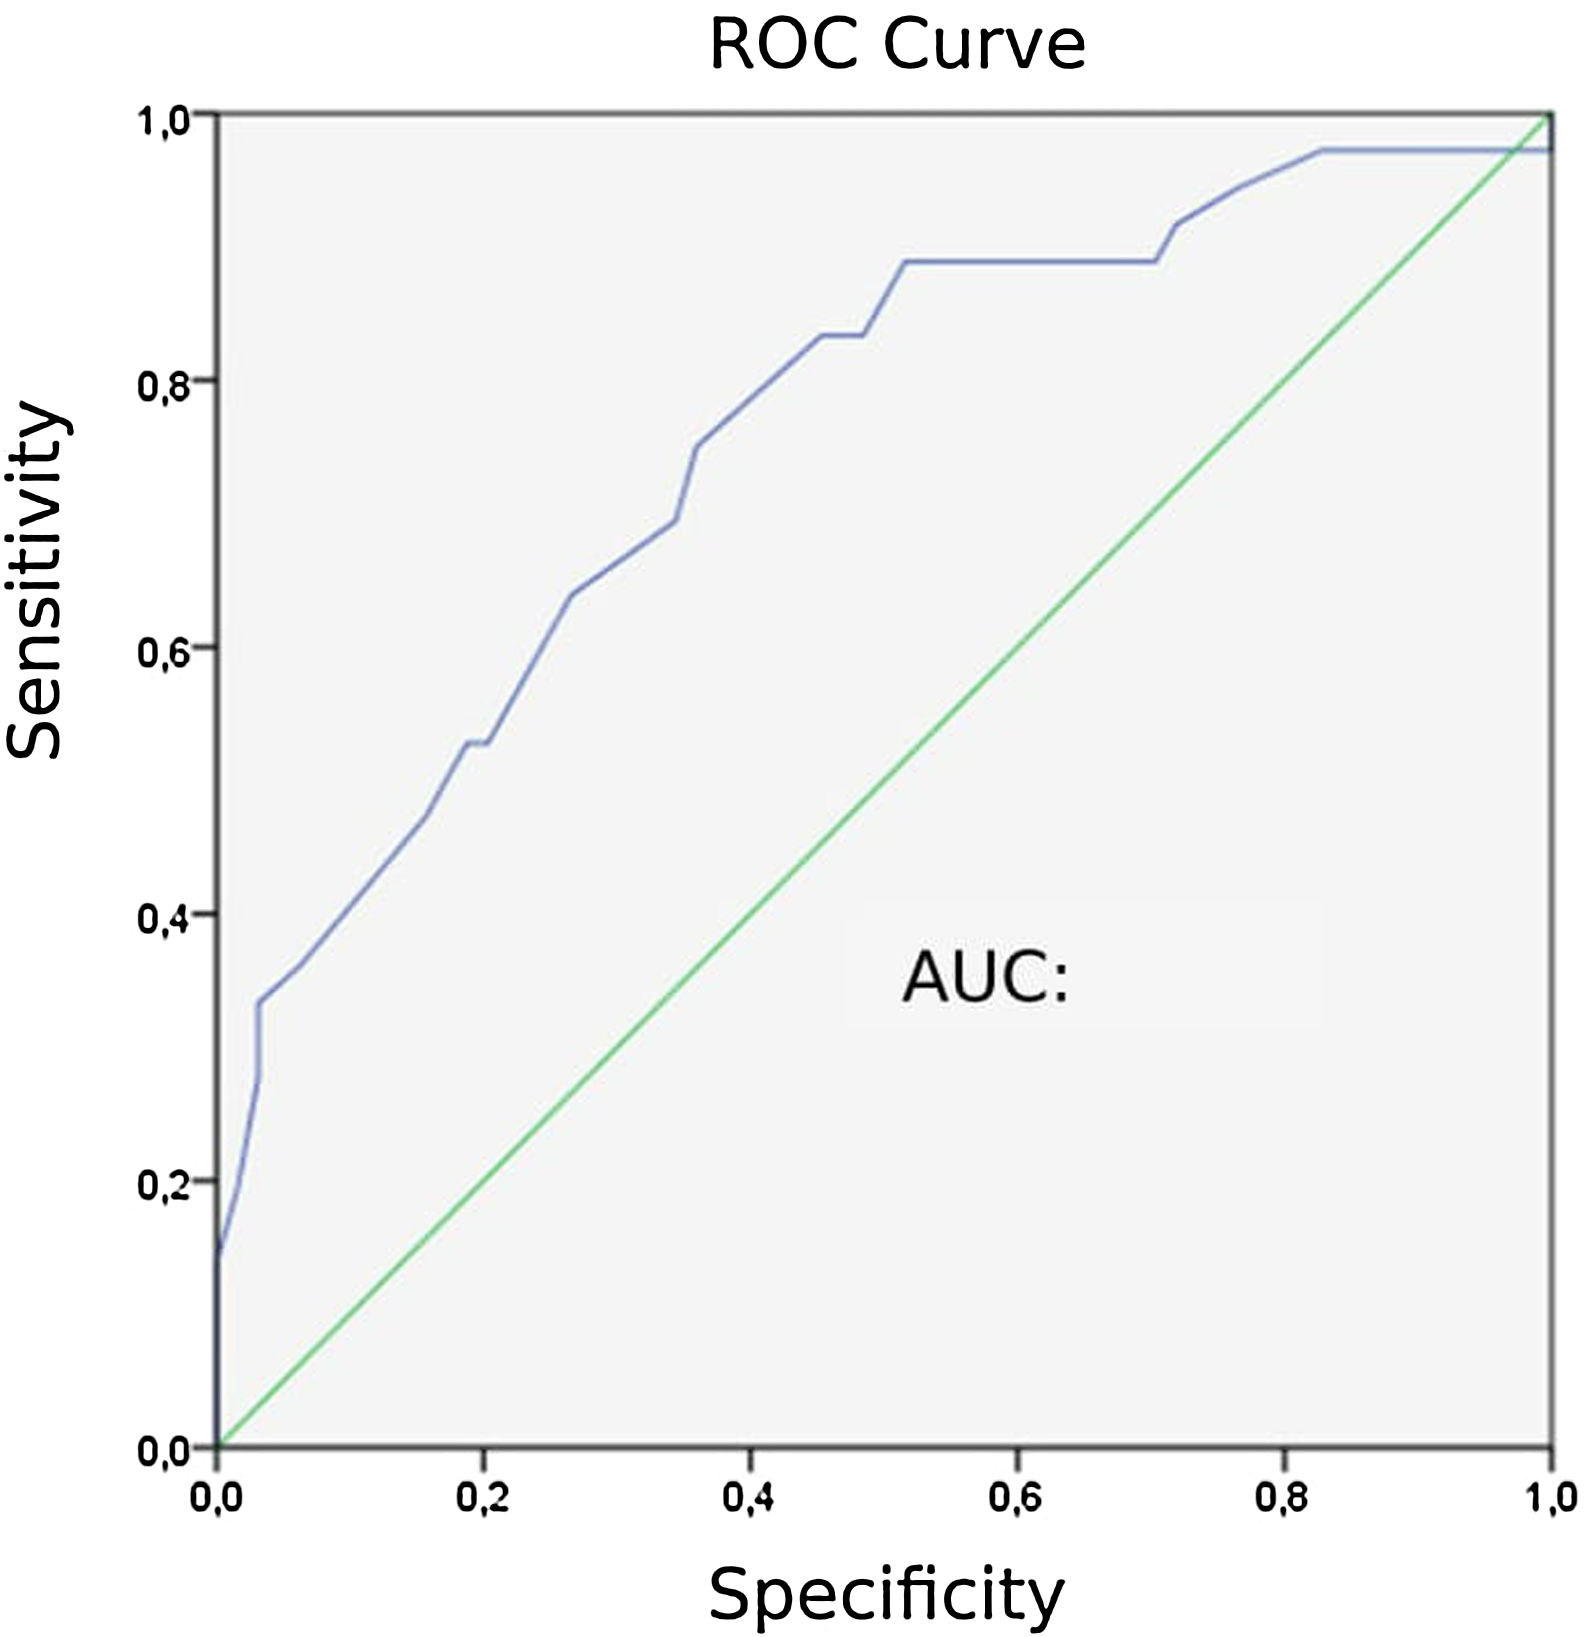
Capnographic measurementsPatients with PE “24” exhibited lower ETCO2 values than those without PE “31” (P = 0). The area under the ROC curve (AUC) for ETCO2 was 0.758. The ROC curve for ETCO2 for diagnosing PE is shown in Fig. 2. The optimal cut-off value for ETCO2 was 28.5 mmHg, with a sensitivity of 75 %, a specificity of 64.1 %, a negative-predictive value (NPV) of 82 %, and a positive-predictive value (PPV) of 54 %.
 curve for end-tidal carbon dioxide (ETCO2) in diagnosing pulmonary embolism (PE).")
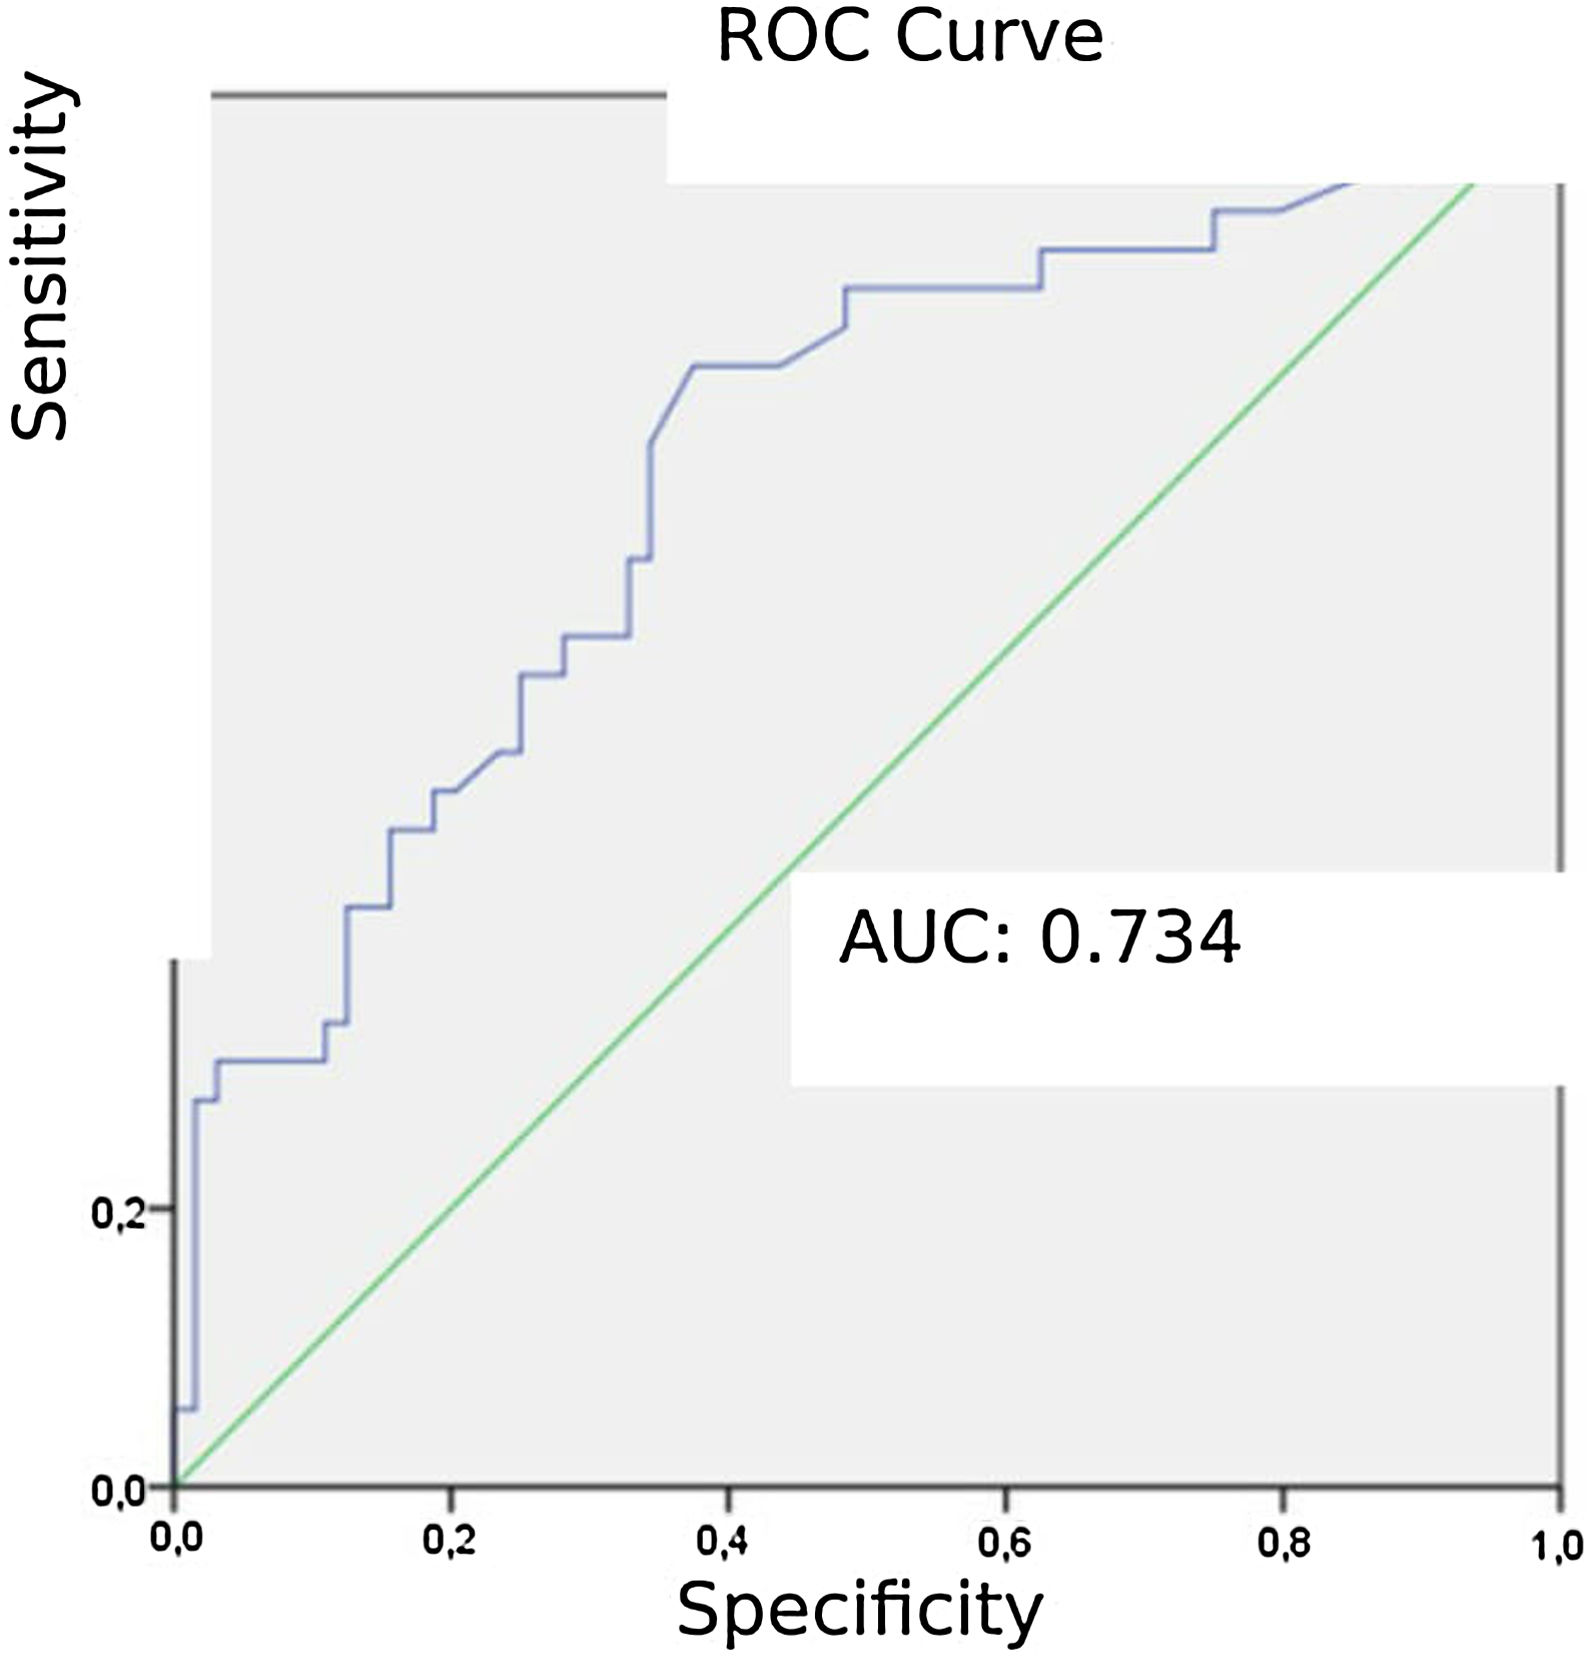
Patients diagnosed with PE exhibited significantly higher mean AVDSf values (0.217) than those without PE (0.098). The AUC for AVDSf was 0.734. The ROC curve of AVDSf for diagnosing PE is shown in Fig. 3. The optimal cut-off value for AVDSf was 0.128, with a sensitivity of 80.6 %, a specificity of 62.5 %, an NPV of 85.1 %, and a PPV of 54.7 %.
Combined results of capnography and clinical prediction rules curve for alveolar dead space fraction (AVDSf) in diagnosing pulmonary embolism (PE).")
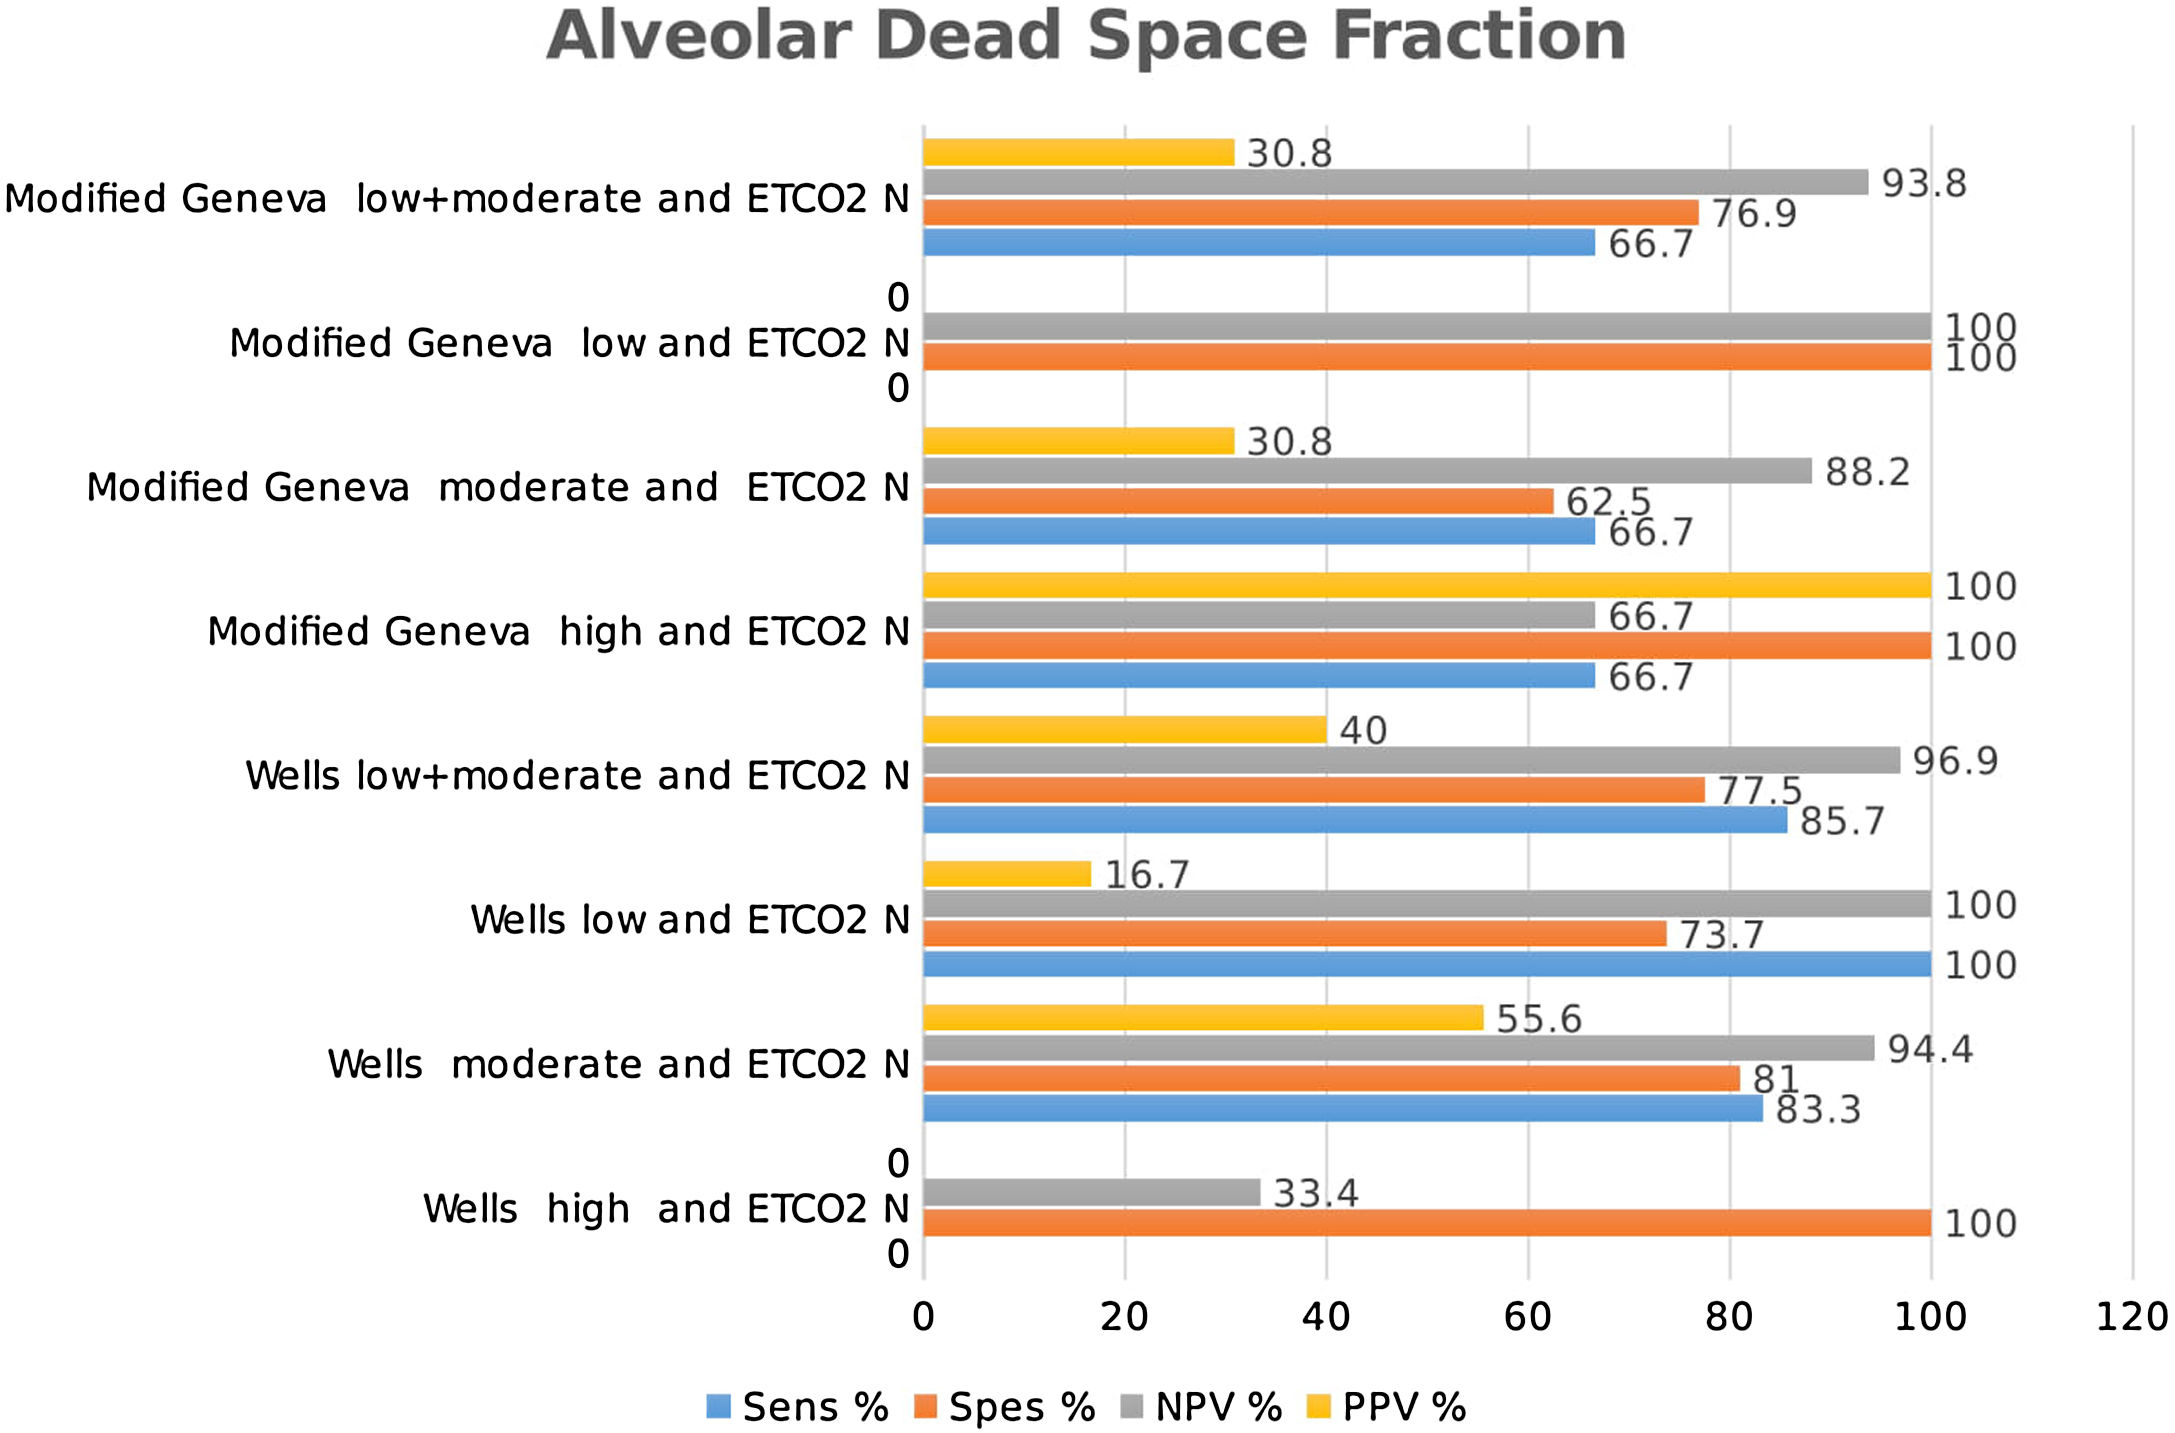
Classification of the patients into high-, moderate-, and low-risk groups according to Wells and Modified Geneva scores was helpful in diagnosing PE, with PPV values of 71.4 %, 44.8 % and 64.3 %, and 80 %, 51.4 % and 50 %, respectively, when ETCO2 was < 28.5 mmHg. When ETCO2 was >28.5 mmHg, the corresponding NPV values for the exclusion of PE were 33.3 %, 77.8 % and 95 %, and 40 %, 80 % and 100 %, respectively (Fig. 4).

Classification of patients into high-, moderate-, and low-risk groups according to Wells and Modified Geneva scores was helpful in diagnosing PE, with PPV values of 100 %, 46.7 % and 55.6 %, and 100 %, 46.3 % and 66.7 %, respectively, when AVDSf was > 0.128. When AVDSf was < 0.128, the corresponding NPV values for the exclusion of PE were 60 %, 80.8 % and 100 %, and 75 %, 76.9 % and 100 %, respectively (Table 2).When ETCO2 and AVDSf were combined in patients with low risk according to the Wells or Modified Geneva system, PE could be excluded. Furthermore, by using these parameters in patients with a high risk for these scoring systems, the diagnosis of PE could be 100 % confirmed.
The distribution of patients according to Wells and Modified Geneva clinical clinical prediction rules.
| High | Modarete | Low | |||
|---|---|---|---|---|---|
| Wells Clinical Prediction Rule | PE (−) | Number | 3 | 37 | 24 |
| Percentage | 4.7 | 57.8 | 37.5 | ||
| PE (+) | Number | 7 | 19 | 10 | |
| Percentage | 19.4 | 52.8 | 27.8 | ||
| Total | Number | 10 | 56 | 34 | |
| Percentage | 10 | 56 | 34 | ||
| Modified Geneva Clinical Prediction Rule | PE (−) | Number | 3 | 42 | 19 |
| Percentage | 4.7 | 65.6 | 29.7 | ||
| PE (+) | Number | 7 | 25 | 4 | |
| Percentage | 19.4 | 69.4 | 11.1 | ||
| Total | Number | 10 | 67 | 23 | |
| Percentage | 10 | 67 | 23 | ||
In our study, the mean age of the patients diagnosed with PE was 66 years, which was significantly older than those who were not diagnosed with PE. Similar results were observed by Ioannou et al., who found that the mean age of patients diagnosed with PE was 61.76 years.8 Among the patients diagnosed with PE, 55.6 % were female, and no significant difference was observed in sex distribution. Similar results were observed in the study by Ioannou et al., who reported that the sex ratio (male:female) of patients diagnosed with PE was 1:1.04,8 and PE was detected in 36 %. In a review by Manara et al., in which 14 studies including 2991 patients with suspected PE were analyzed, 608 were diagnosed with PE.5 The frequency of PE varied from 5 % to 69 %, with an average of 20 %. The incidence of PE in the current study was within the range reported in these earlier studies (5–69 %).5
Among the patients diagnosed with PE in the current study, the proportion of those classified as low-, moderate-, and high-risk was 27.8 %, 52.8 %, and 19.7 %, respectively, according to Wells score, and 11.1 %, 69.4 %, and 19 %, respectively, according to Modified Geneva score. Similarly, in a previous study160, 24 %, 54 %, and 22 % of the patients diagnosed with PE were classified as low-, moderate-, and high-risk according to the Wells scoring system, respectively, and 17 %, 64.4 %, and 17 % were classified according to Modified Geneva scoring system.
In our study, the Modified Geneva score was found to be significant in detecting PE, while the Wells score was not. Yetkin et al. found both the Wells and Modified Geneva scoring systems to be significant in detecting PE; however, these two clinical scoring systems were not found to be significant by Wong et al., Penaloza et al. and Shen et al., who found the Wells scoring system to be superior in detecting PE, although both the clinical scores were found to be significant.9–12 The literature contains examples of significance and insignificance of both scoring systems in detecting PE.
Based on capnography, the mean ETCO2 was found to be 24 mmHg, and was statistically significant in patients with PE. Similarly, Riaz et al. reported a mean ETCO2 of 25.1 mmHg in patients diagnosed with PE and 33.1 mmHg in patients not diagnosed with PE.6 This result is physiological due to the presence of ventilated but non-perfused lung compartments, ETCO2 is lowered, which leads to PE.
Hemnes et al. reported an optimal ETCO2 cut-off value of 36 mmHg, with a sensitivity of 87 %, a specificity of 53 % and an NPV of 97 %, with an AUC of 73.9 %. Riaz et al. determined an ETCO2 cut-off value of 32.3 mmHg, with 100 % sensitivity, 68 % specificity, and 100 % NPV, with an AUC of 84 %.6,13 Bonderman et al. established an ETCO2 cut-off value of 36 mmHg, with an NPV of 96.6 %.14 In the current study, the ETCO2 cut-off value was found to be 28.5 mmHg, which is lower than the value reported by other studies, but with a lower NPV. Although Manara et al. included 14 studies in their review, the ideal cut-off value could not be determined due to differences among the studies.5 Therefore, more studies with a larger number of patients are needed to calculate the ideal cut-off value.
Kurt et al. found the mean AVDSf value (0.174) to be higher in patients diagnosed with PE than in those not diagnosed with PE (0.136); these findings were similar those of the current study. The same researchers reported a cut-off value of 0.09, with a sensitivity of 70 %, a specificity of 61.1 %, a PPV of 80 %, and an NPV of 47.8 %.15 In the current study, the cut-off value for AVDSf was found to be within the range of values reported in previous studies. Manara et al. could not suggest an ideal cut-off value for AVDSf because various studies had been included in their review, and the AVDSf measurement methods differed among them.5
In a previous study by Yoon et al., d-dimer test positivity and the results of capnography in patients with suspected PE decreased CT requirements to 55 % in low- and moderate-risk patients. Studies have shown that a normal PaCO2 – ETCO2 gradient does not exclude PE with a sufficient safety margin.16 In the current study, when ETCO2 was < 28.5, ETCO2 alone had an NPV of 82 % in the diagnosis of PE, and NPV increased to 95 % and 100 %, respectively, in low-risk patients when evaluated using the Wells or Modified Geneva scoring system. In a study by Bonderman et al., capnography excluded PE in 96.6 % of patients when ETCO2 was ≥ 36 mmHg and 93.8 % in patients with a Wells score < 4. Using the Wells score (< 4) and ETCO2 (≥ 36 mmHg) value, PE was shown to be excluded in 97.6 %.14 ETCO2 has a high NPV for excluding PE, and the NPV was higher when combined with the Wells scoring system. In a meta-analysis by Ceriani et al., the prevalence of PE was reported to be < 10 % in patients with low clinical risk according to commonly used Wells and Geneva clinical prediction rules.17 When capnography is used along with these prediction rules, PE can be safely excluded in patients with low clinical risk. Manara et al. discussed the possible diagnostic role of capnography in patients with a probability of PE < 10 % after a positive d-dimer test result.5 In the current study, capnography safely excluded PE compared with the low risk Wells or Modified Geneva scoring systems and ETCO2 after a positive d-dimer test result. In the current study, when an AVDSf value of < 0.128 was considered in low-risk Wells or Modified Geneva patients, PE was excluded with 100 % sensitivity. In a study by Verschuren et al., patients with low clinical risk, low AVDSf, and positive d-dimer test result showed 96 % sensitivity and 92 % NPV.4 This study suggested that the use of capnography may decrease the necessity of CT or lung scintigraphy in patients with suspected PE. In a study by Yoon et al., PE was excluded in patients with low AVDSf values, low/moderate clinical risk, and positive d-dimer test result.16 Prediction of PE with the combination of high clinical risk and AVDSf value (≥ 0.15) demonstrated 100 % specificity and 31.5 % sensitivity. PE was excluded at similar rates when evaluated using clinical prediction rules and AVDSf values in the current study. In our study, high clinical risk for suspicion of PE had 100 % sensitivity and 100 % PPV in cases with AVDSf > 0.128. This result suggests that diagnosis of PE can be made safely without the use of advanced imaging techniques, in addition to indicating the possibility of early treatment.
ConclusionsIt is possible to exclude or predict PE based on ETCO2 and AVDSf values calculated using capnography when evaluated with clinical prediction rules and d-dimer test results using an algorithm. According to the results of our study, when ETCO2 and AVDSf values were used together, PE could be excluded in 100 % of patients with a low risk score on the Wells and Modified Geneva systems. On the other hand, PE may be predicted in 100 % of patients with high risk score on the Wells and Modified Geneva systems. More similar studies with larger sample sizes are needed to determine the standard cut-off values for ETCO2 and AVDSf. As a result, capnography may be used routinely and safely along with the algorithm for diagnosing of PE without the need for advanced imaging modalities.
Conflict of interestAll authors declare no conflict of interest.


