

Selecting the time target for follow-up testing in lung cancer screening is challenging. We aim to devise dynamic, personalized lung cancer screening schema for patients with pulmonary nodules detected through low-dose computed tomography.
MethodsWe developed and validated dynamic models using data of pulmonary nodule patients (aged 55–74 years) from the National Lung Screening Trial. We predicted patient-specific risk profiles at baseline (R0) and updated the risk evaluation results in repeated screening rounds (R1 and R2). We used risk cutoffs to optimize time-dependent sensitivity at an early decision point (3 months) and time-dependent specificity at a late decision point (1 year).
ResultsIn validation, area under receiver operating characteristic curve for predicting 12-month lung cancer onset was 0.867 (95 % confidence interval: 0.827–0.894) and 0.807 (0.765–0.948) at R0 and R1-R2, respectively. The personalized schema, compared with National Comprehensive Cancer Network (NCCN) guideline and Lung-RADS, yielded lower rates of delayed diagnosis (1.7% vs. 1.7% vs. 6.9 %) and over-testing (4.9% vs. 5.6% vs. 5.6 %) at R0, and lower rates of delayed diagnosis (0.0% vs. 18.2% vs. 18.2 %) and over-testing (2.6% vs. 8.3% vs. 7.3 %) at R2. Earlier test recommendation among cancer patients was more frequent using the personalized schema (vs. NCCN: 29.8% vs. 20.9 %, p = 0.0065; vs. Lung-RADS: 33.2% vs. 22.8 %, p = 0.0025), especially for women, patients aged ≥65 years, and part-solid or non-solid nodules.
ConclusionsThe personalized schema is easy-to-implement and more accurate compared with rule-based protocols. The results highlight value of personalized approaches in realizing efficient nodule management.
Lung cancer screening with low-dose computed tomography (LDCT) is routinely recommended for individuals at high risk for the disease.1,2 A quarter to half of screened individuals have at least one pulmonary nodule,3,4 a gateway to repeated imaging, diagnostic work-up and treatment including surgical resection. Benefits of early diagnosis and treatment of cancer largely depend on criteria and frequency of follow-up examinations.5 However, these benefits are often offset by high over-testing rates, resource waste, complications, and mental stress.6,7 Precisely planning follow-up testing is therefore critical to improving the effectiveness of screening programs.5,8,9
Selecting the time target for follow-up testing is clinically challenging. Current guidelines use flowcharts to classify nodules according to size and attenuation, whereupon immediate diagnostic work-up or recall in 3 months, 6 months, or 1 year is recommended.10–13 These rules have been proposed by different expert panels and therefore differ among existing guidelines,14 with varied practical effects and poor clinical adherence.15,16
In this work, we present a dynamic and easy-to-implement schema to personalize the time interval between tests for patients detected with pulmonary nodules in lung cancer screening. Compared with two rule-based guideline protocols,10,11 we demonstrated the capability of this personalized approach to maximize timely diagnosis and minimize over-testing, thereby improving the screening workflow.
MethodsStudy populationWe based this study on the National Lung Screening Trial (NLST).17 All participants from 33 medical centers underwent baseline screening (R0) and subsequently, a maximum of two rounds of repeat annual screening (R1 and R2) if no lung cancer was diagnosed. Follow-up was conducted through the end of 2009, with the longest follow-up duration >8 years.
We accessed data from the LDCT arm (delivery ID: NLST-503) and used inclusion criteria as follows: individuals aged 55–74 years at R0 with at least a 30 pack-year smoking history and smoking cessation <15 years. Exclusion criteria were lung cancer history; CT examination within 18 months before participation; and no positive findings during R0–R2, defined as ≥1 non-calcified pulmonary nodule or mass detected on LDCT.
Patient selection is depicted in Fig A.1. We included all (809) lung cancer patients who had ≥1 diameter record, which is the primary variable for planning follow-up testing. We retrospectively selected a sample (1000) of cancer-free pulmonary nodule patients to lower the burden in nodule selection, linkage, and quantification. Sample size determination is detailed in Methods A.1. Using a 2:1 ratio, we divided the 1809 selected patients into two patient cohorts, one for schema development (1206) and another for validation (603).
The study was approved by the institutional review board of Institute of Basic Medical Sciences, Chinese Academy of Medical Science. Patient consent was exempt as only publicly available data was used.
Outcomes and predictorsWe used a joint modelling framework and considered two classes of outcome for implementing dynamic prediction18,19: time-to-event outcomes, defined as a lung cancer diagnosis and its time interval since the most recent test; and longitudinal outcomes, i.e., trajectories of nodule diameter. We applied this simple image biomarker for ease of interpretation and clinical use, as well as for meaningful comparisons of our approach with rule-based protocols that largely rely on diameter measurement.10,11
Model predictors were selected according to statistical or clinical significance. These included epidemiological information (age, obesity, family history of lung cancer, smoking pack-years) and nodule information (attenuation and margin), coded as binary variables where appropriate. Height or weight data for determining obesity were missing in 7 (0.4 %) patients; these were imputed according to the sex mean.
Dynamic predictionWe developed a Cox proportional hazards model for a baseline screening scenario and joint models for a repeated screening scenario. Mathematical details are available in Methods A.3. The joint models first predicted the longitudinal outcome (diameter trajectory); this was then used, together with other predictors, to model the risk profiles regarding the time-to-event outcome. Between these sub-models, we used an association structure to account for the diameter measured at the present test and its rate of change over time; both are clinically important in determining cancer risk.20 A unique advantage of this approach is smoothing of nodule diameter measurement error, which can be as high as 25 % in LDCT screening.21
Time target recommendationWe selected two risk cut-offs to optimize accuracy in decisions about timing of the upcoming follow-up test. We based these choices on the analysis of a time-dependent receiver operating curve.22,23 Specifically, we selected one risk cut-off that allowed for sensitivity (t= 3 months) ≥0.95, and another cut-off that allowed for specificity (t= 12 months) ≥0.95. These cut-offs were then used to classify patients (per each screening round) as having high, middle, or low risk, whereupon recommendations for a follow-up test interval of 0 months (i.e., immediate work-up), 3 months, or 12 months (i.e., annual repeat screening) were made. The ≥0.95 criterion was intended to control delayed diagnosis (defined as false recommendation of annual repeat screening for those who develop lung cancer within 3 months) and over-testing (defined as false recommendation of immediate work-up for cancer-free patients) to a small probability (<0.05).
Schema benchmarkTo demonstrate strengths and potential weaknesses of the proposed schema, we created a benchmark with two nodule management protocols that are in current use: the NCCN guideline (2022 V2)10 and the Lung CT Screening Reporting & Data System (Lung-RADS 2022).11 We examined delayed diagnosis and over-testing rates following these rule-based protocols versus our personalized schema in the validation cohort. We also investigated which lung cancer patient subgroups could benefit most from a personalized schema in terms of shorter delay in diagnosis.
Statistical analysisBecause of a right-skewed distribution of the nodule diameter, we conducted a natural logarithm transform before using this longitudinal outcome. We estimated parameters of the joint models using a Bayesian method, implemented with a Markov chain Monte Carlo algorithm (1 chain, 11,000 interactions with 1000 burn-ins discarded). We assessed model performance using time-dependent accuracy metrics and estimated 95 % confidence intervals (CIs) using a 1000-sample bootstrap approach.
We performed a log-rank test to examine between-group differences among high-, mid- and low-risk strata. We drew a contingency table to tabulate recommendations on the time target of follow-up testing and ground truth of the time-to-event outcome, whereupon rates of delayed diagnosis and over-testing (as defined above) were calculated. We used a paired-samples McNemar exact probability method to test for statistical significance of these rates.
We considered a two-sided p-value <0.05 to indicate statistical significance. We performed the analyses using SAS 9.4 (SAS Institute Inc., Cary, NC, USA) and R 4.1.2 with packages “JMbayes2 0.2–8”, “riskRegression 2022.09.23”, “tdROC 1.0” and “survminer 0.4.9” (R Project for Statistical Computing, Vienna, Austria).
ResultsPatient characteristicsTable 1 presents characteristics of the included patients. The mean age at R0 was 62.7 years; 58.7 % were men; 50.5 % had an associate's, bachelor's, or higher education degree; 23.7 % were obese; and 24.9 % of patients had a family history of lung cancer. Participants had a median 52.5 pack-year smoking history with a median starting age of 16 years, and half (51.4 %) had not quit smoking before participation. Median follow-up duration was 2197 days (6 years).
Characteristics of patients with nodule(s).
BMI, body mass index; IQR, interquartile range; GED, General Educational Diploma; SD, standard deviation. BMI calculated as weight (kg) / height (m)2.
Of 809 patients diagnosed with lung cancer, the median time to diagnosis was 735 days (2 years); the range was as wide as 4–2499 days. High cancer heterogeneity was also demonstrated in diverse pathological types (9.6 % small cell, 49.1 % adenocarcinoma, 21.1 % squamous cell, 19.9 % other) and stages (e.g., 71.4 % stages IA-IIIA, 26.8 % stages IIIB-IV), suggesting a need for personalized optimization of diagnostic testing.
The above patient characteristics did not differ between the cohorts used for model development and schema validation, except for negligible differences in mean age (62.5 vs. 63.2 years, p = 0.0135) and median follow-up duration (2212 vs. 2142 days, p = 0.0010).
Model performanceThe multi-stage models are summarized in Table A.1, and were used to predict onset of lung cancer within a time interval of interest. Results of time-dependent predictive performance of the models are available in Table A.2.
Validation results: the area under the receiver operating curve (AUC) (t= 3 months) was 0.879 (95 % CI: 0.842, 0.917) at R0 and 0.845 (95 % CI: 0.801, 0.892) at R1–R2; the AUC (t= 12 months) was 0.867 (95 % CI: 0.827, 0.894) for R0 and 0.807 (0.765, 0.948) for R1–R2. These were comparable to the development cohort, thus demonstrating the validity of the model performance.
Risk cut-offs selected according to the development cohort yielded high sensitivity (t= 3 months): 0.983 (95 % CI: 0.946, 1.000) for R0; 0.957 (95 % CI: 0.901, 1.000) for R1–R2, and moderately high specificity (t= 12 months): 0.909 (95 % CI: 0.881, 0.938) for R0; 0.936 0.936 (95 % CI: 0.914, 0.958) for R1–R2 in the validation cohort.
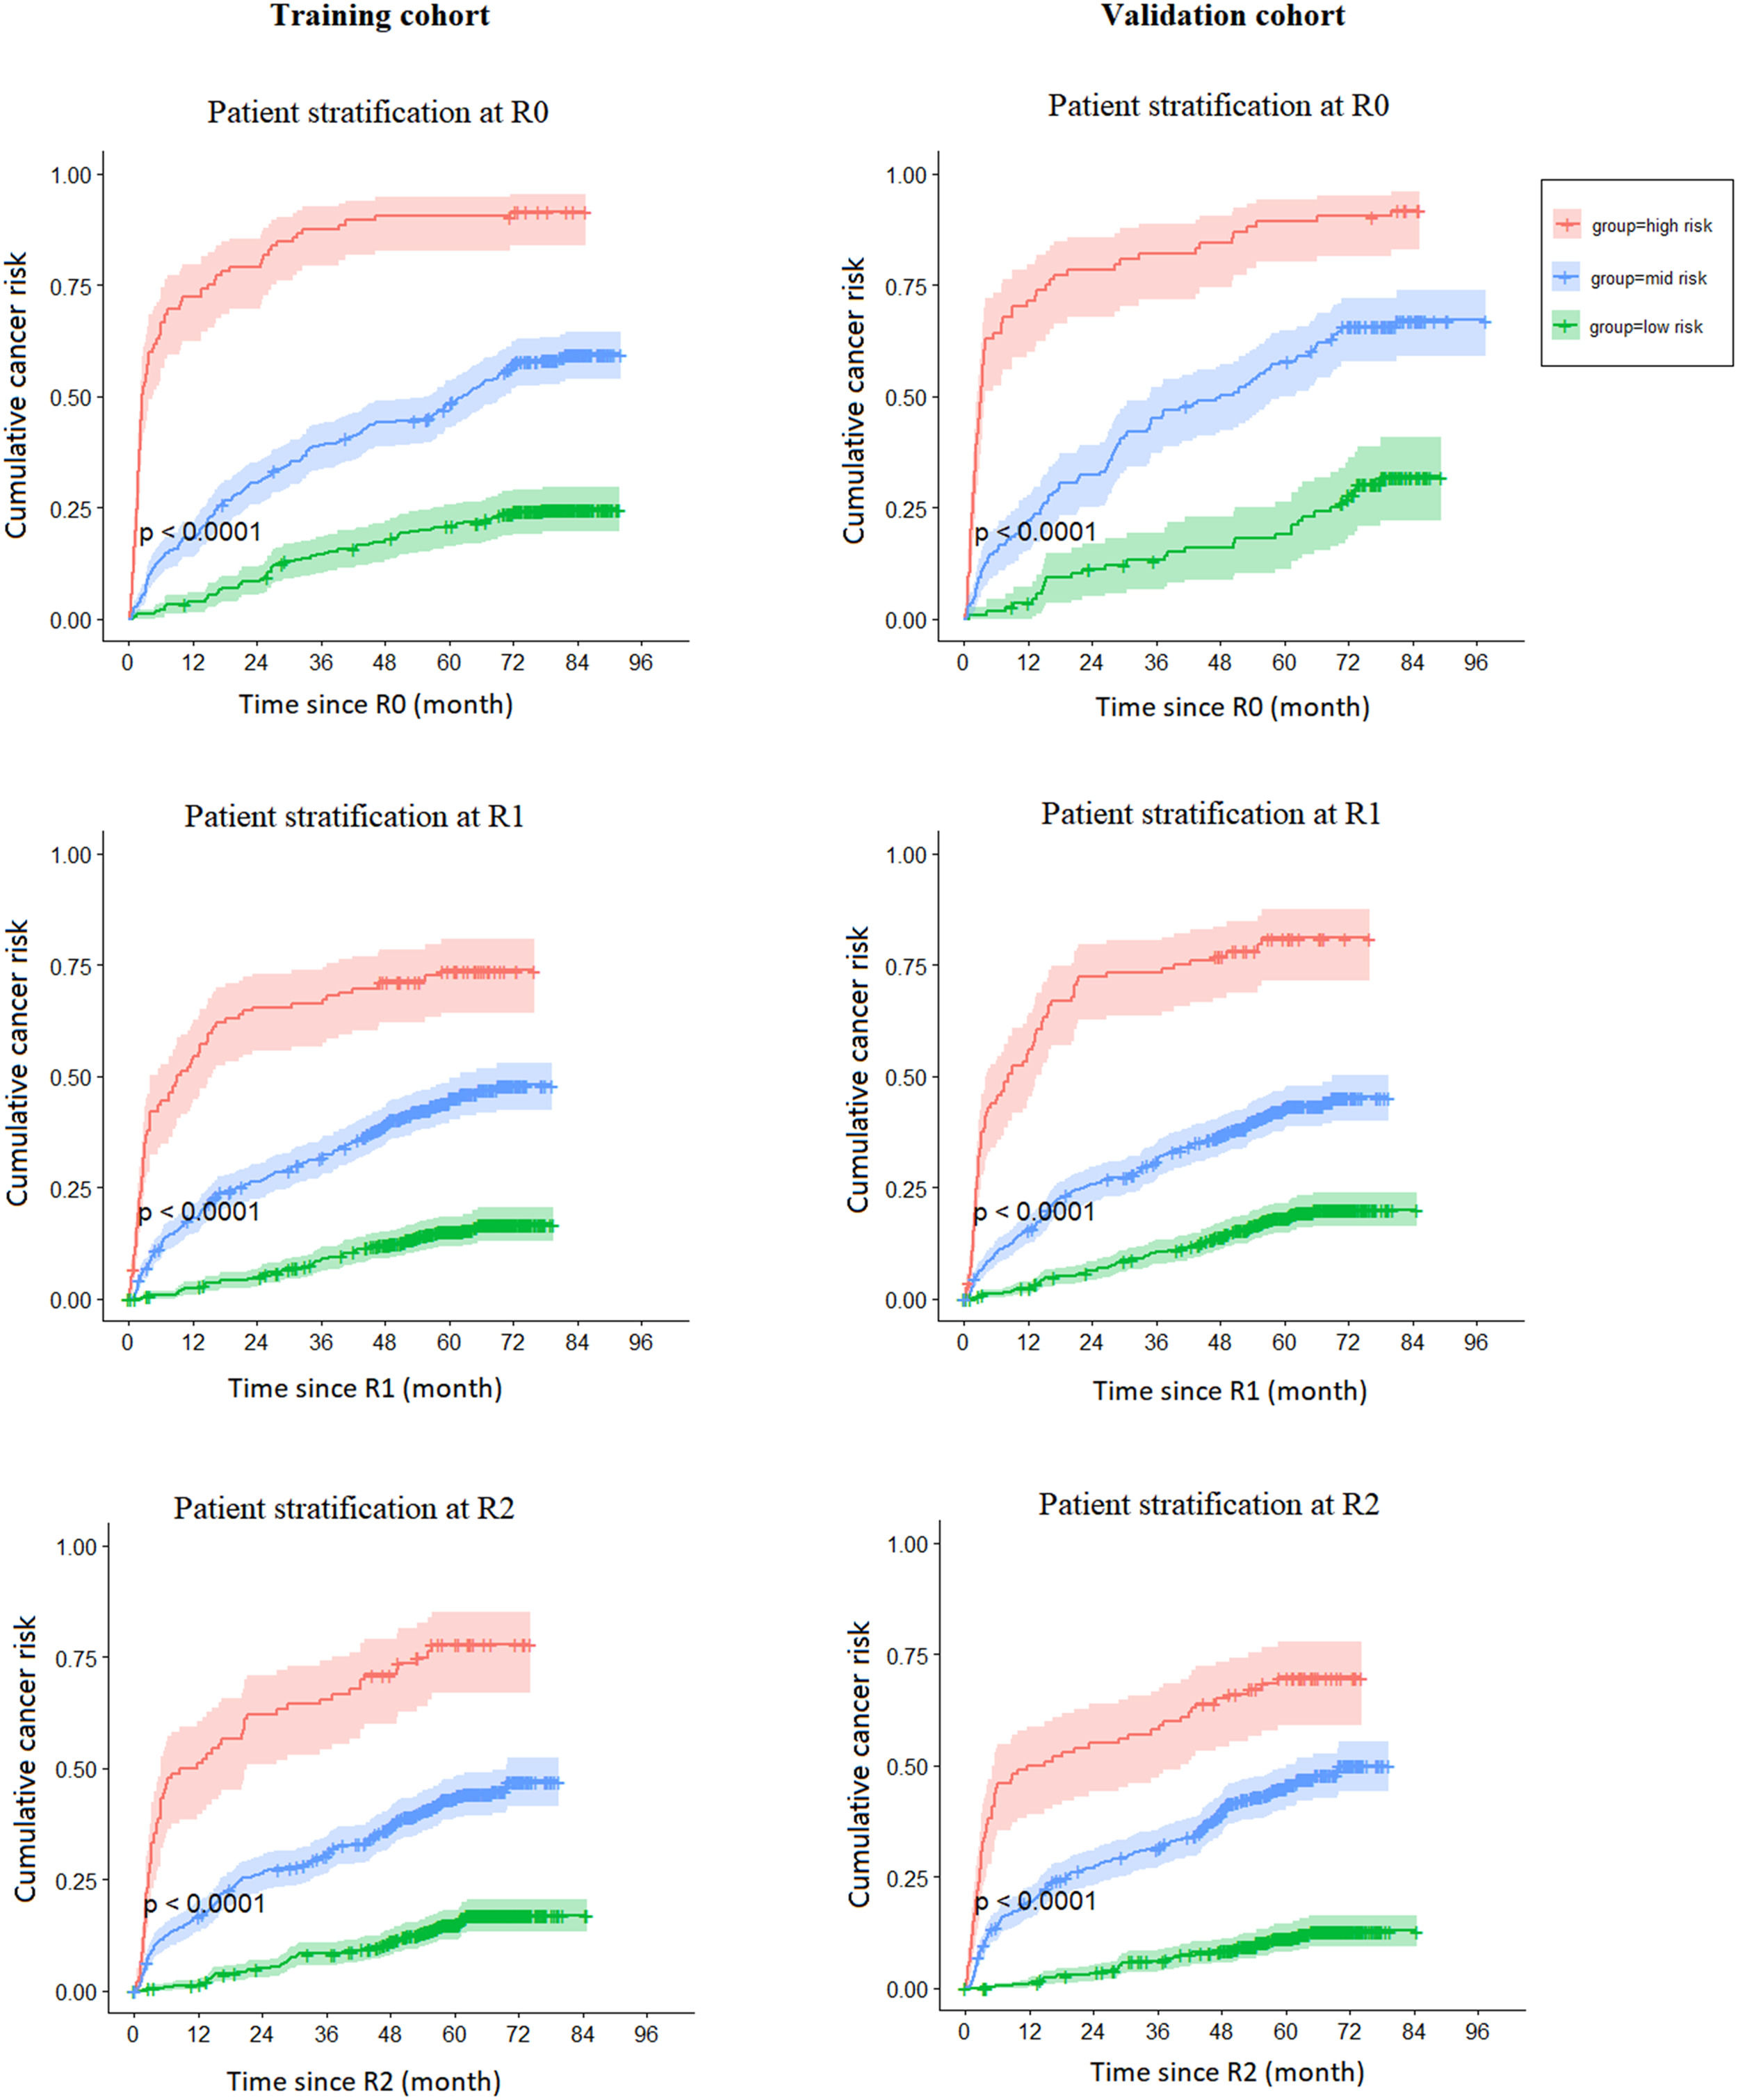
In Fig 1, we present risk strata according to the selected cut-offs. In the development and validation cohorts, patients determined as high-, mid- or low-risk had significantly different curves for the cumulative risk of lung cancer (p < 0.0001 at each screening round).
Schema benchmark
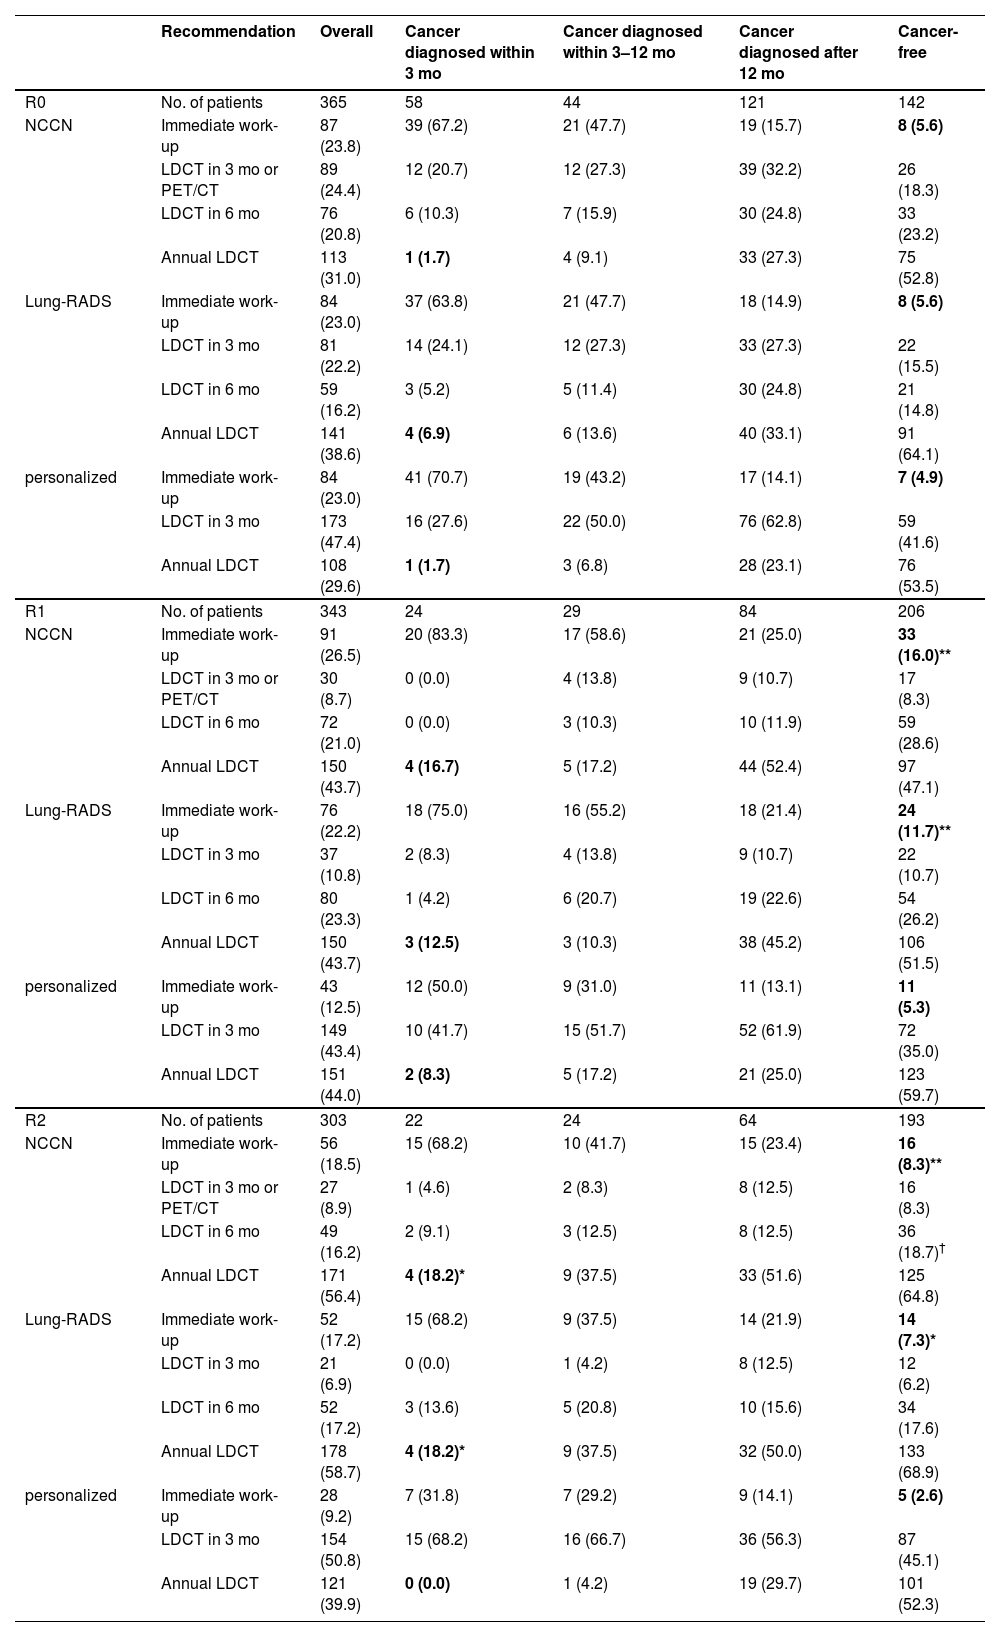
We compared the personalized schema with the NCCN and Lung-RADS protocols. The results obtained from the validation cohort are shown in Table 2.
Comparison of guideline protocols and personalized schema in validation cohort.
| Recommendation | Overall | Cancer diagnosed within 3 mo | Cancer diagnosed within 3–12 mo | Cancer diagnosed after 12 mo | Cancer-free | |
|---|---|---|---|---|---|---|
| R0 | No. of patients | 365 | 58 | 44 | 121 | 142 |
| NCCN | Immediate work-up | 87 (23.8) | 39 (67.2) | 21 (47.7) | 19 (15.7) | 8 (5.6) |
| LDCT in 3 mo or PET/CT | 89 (24.4) | 12 (20.7) | 12 (27.3) | 39 (32.2) | 26 (18.3) | |
| LDCT in 6 mo | 76 (20.8) | 6 (10.3) | 7 (15.9) | 30 (24.8) | 33 (23.2) | |
| Annual LDCT | 113 (31.0) | 1 (1.7) | 4 (9.1) | 33 (27.3) | 75 (52.8) | |
| Lung-RADS | Immediate work-up | 84 (23.0) | 37 (63.8) | 21 (47.7) | 18 (14.9) | 8 (5.6) |
| LDCT in 3 mo | 81 (22.2) | 14 (24.1) | 12 (27.3) | 33 (27.3) | 22 (15.5) | |
| LDCT in 6 mo | 59 (16.2) | 3 (5.2) | 5 (11.4) | 30 (24.8) | 21 (14.8) | |
| Annual LDCT | 141 (38.6) | 4 (6.9) | 6 (13.6) | 40 (33.1) | 91 (64.1) | |
| personalized | Immediate work-up | 84 (23.0) | 41 (70.7) | 19 (43.2) | 17 (14.1) | 7 (4.9) |
| LDCT in 3 mo | 173 (47.4) | 16 (27.6) | 22 (50.0) | 76 (62.8) | 59 (41.6) | |
| Annual LDCT | 108 (29.6) | 1 (1.7) | 3 (6.8) | 28 (23.1) | 76 (53.5) | |
| R1 | No. of patients | 343 | 24 | 29 | 84 | 206 |
| NCCN | Immediate work-up | 91 (26.5) | 20 (83.3) | 17 (58.6) | 21 (25.0) | 33 (16.0)** |
| LDCT in 3 mo or PET/CT | 30 (8.7) | 0 (0.0) | 4 (13.8) | 9 (10.7) | 17 (8.3) | |
| LDCT in 6 mo | 72 (21.0) | 0 (0.0) | 3 (10.3) | 10 (11.9) | 59 (28.6) | |
| Annual LDCT | 150 (43.7) | 4 (16.7) | 5 (17.2) | 44 (52.4) | 97 (47.1) | |
| Lung-RADS | Immediate work-up | 76 (22.2) | 18 (75.0) | 16 (55.2) | 18 (21.4) | 24 (11.7)** |
| LDCT in 3 mo | 37 (10.8) | 2 (8.3) | 4 (13.8) | 9 (10.7) | 22 (10.7) | |
| LDCT in 6 mo | 80 (23.3) | 1 (4.2) | 6 (20.7) | 19 (22.6) | 54 (26.2) | |
| Annual LDCT | 150 (43.7) | 3 (12.5) | 3 (10.3) | 38 (45.2) | 106 (51.5) | |
| personalized | Immediate work-up | 43 (12.5) | 12 (50.0) | 9 (31.0) | 11 (13.1) | 11 (5.3) |
| LDCT in 3 mo | 149 (43.4) | 10 (41.7) | 15 (51.7) | 52 (61.9) | 72 (35.0) | |
| Annual LDCT | 151 (44.0) | 2 (8.3) | 5 (17.2) | 21 (25.0) | 123 (59.7) | |
| R2 | No. of patients | 303 | 22 | 24 | 64 | 193 |
| NCCN | Immediate work-up | 56 (18.5) | 15 (68.2) | 10 (41.7) | 15 (23.4) | 16 (8.3)** |
| LDCT in 3 mo or PET/CT | 27 (8.9) | 1 (4.6) | 2 (8.3) | 8 (12.5) | 16 (8.3) | |
| LDCT in 6 mo | 49 (16.2) | 2 (9.1) | 3 (12.5) | 8 (12.5) | 36 (18.7)† | |
| Annual LDCT | 171 (56.4) | 4 (18.2)* | 9 (37.5) | 33 (51.6) | 125 (64.8) | |
| Lung-RADS | Immediate work-up | 52 (17.2) | 15 (68.2) | 9 (37.5) | 14 (21.9) | 14 (7.3)* |
| LDCT in 3 mo | 21 (6.9) | 0 (0.0) | 1 (4.2) | 8 (12.5) | 12 (6.2) | |
| LDCT in 6 mo | 52 (17.2) | 3 (13.6) | 5 (20.8) | 10 (15.6) | 34 (17.6) | |
| Annual LDCT | 178 (58.7) | 4 (18.2)* | 9 (37.5) | 32 (50.0) | 133 (68.9) | |
| personalized | Immediate work-up | 28 (9.2) | 7 (31.8) | 7 (29.2) | 9 (14.1) | 5 (2.6) |
| LDCT in 3 mo | 154 (50.8) | 15 (68.2) | 16 (66.7) | 36 (56.3) | 87 (45.1) | |
| Annual LDCT | 121 (39.9) | 0 (0.0) | 1 (4.2) | 19 (29.7) | 101 (52.3) |
*p < 0.05 or ** p < 0.01 indicates statistical significance compared with personalized schema in a paired-samples test.
In R0, the three protocols performed equally well at controlling delayed diagnosis (rates: 1.7% vs. 6.9% vs. 1.7 % following NCCN, Lung-RADS, and our schema) and over-testing (5.6% vs. 5.6% vs. 4.9 %); all p > 0.05.
In R1–R2, the personalized schema outperformed the rule-based protocols. The rate of delayed diagnosis associated with the NCCN, Lung-RADS, and our schema was 16.7 % versus 12.5 % versus 8.3 % in R1, and 18.2 % versus 18.2 % versus 0.0 % in R2; the rate of over-testing was 16.0 % versus 11.7 % versus 5.3 % in R1, and 8.3 % versus 7.3 % versus 2.6 % in R2 (statistical significance shown in Table 2).
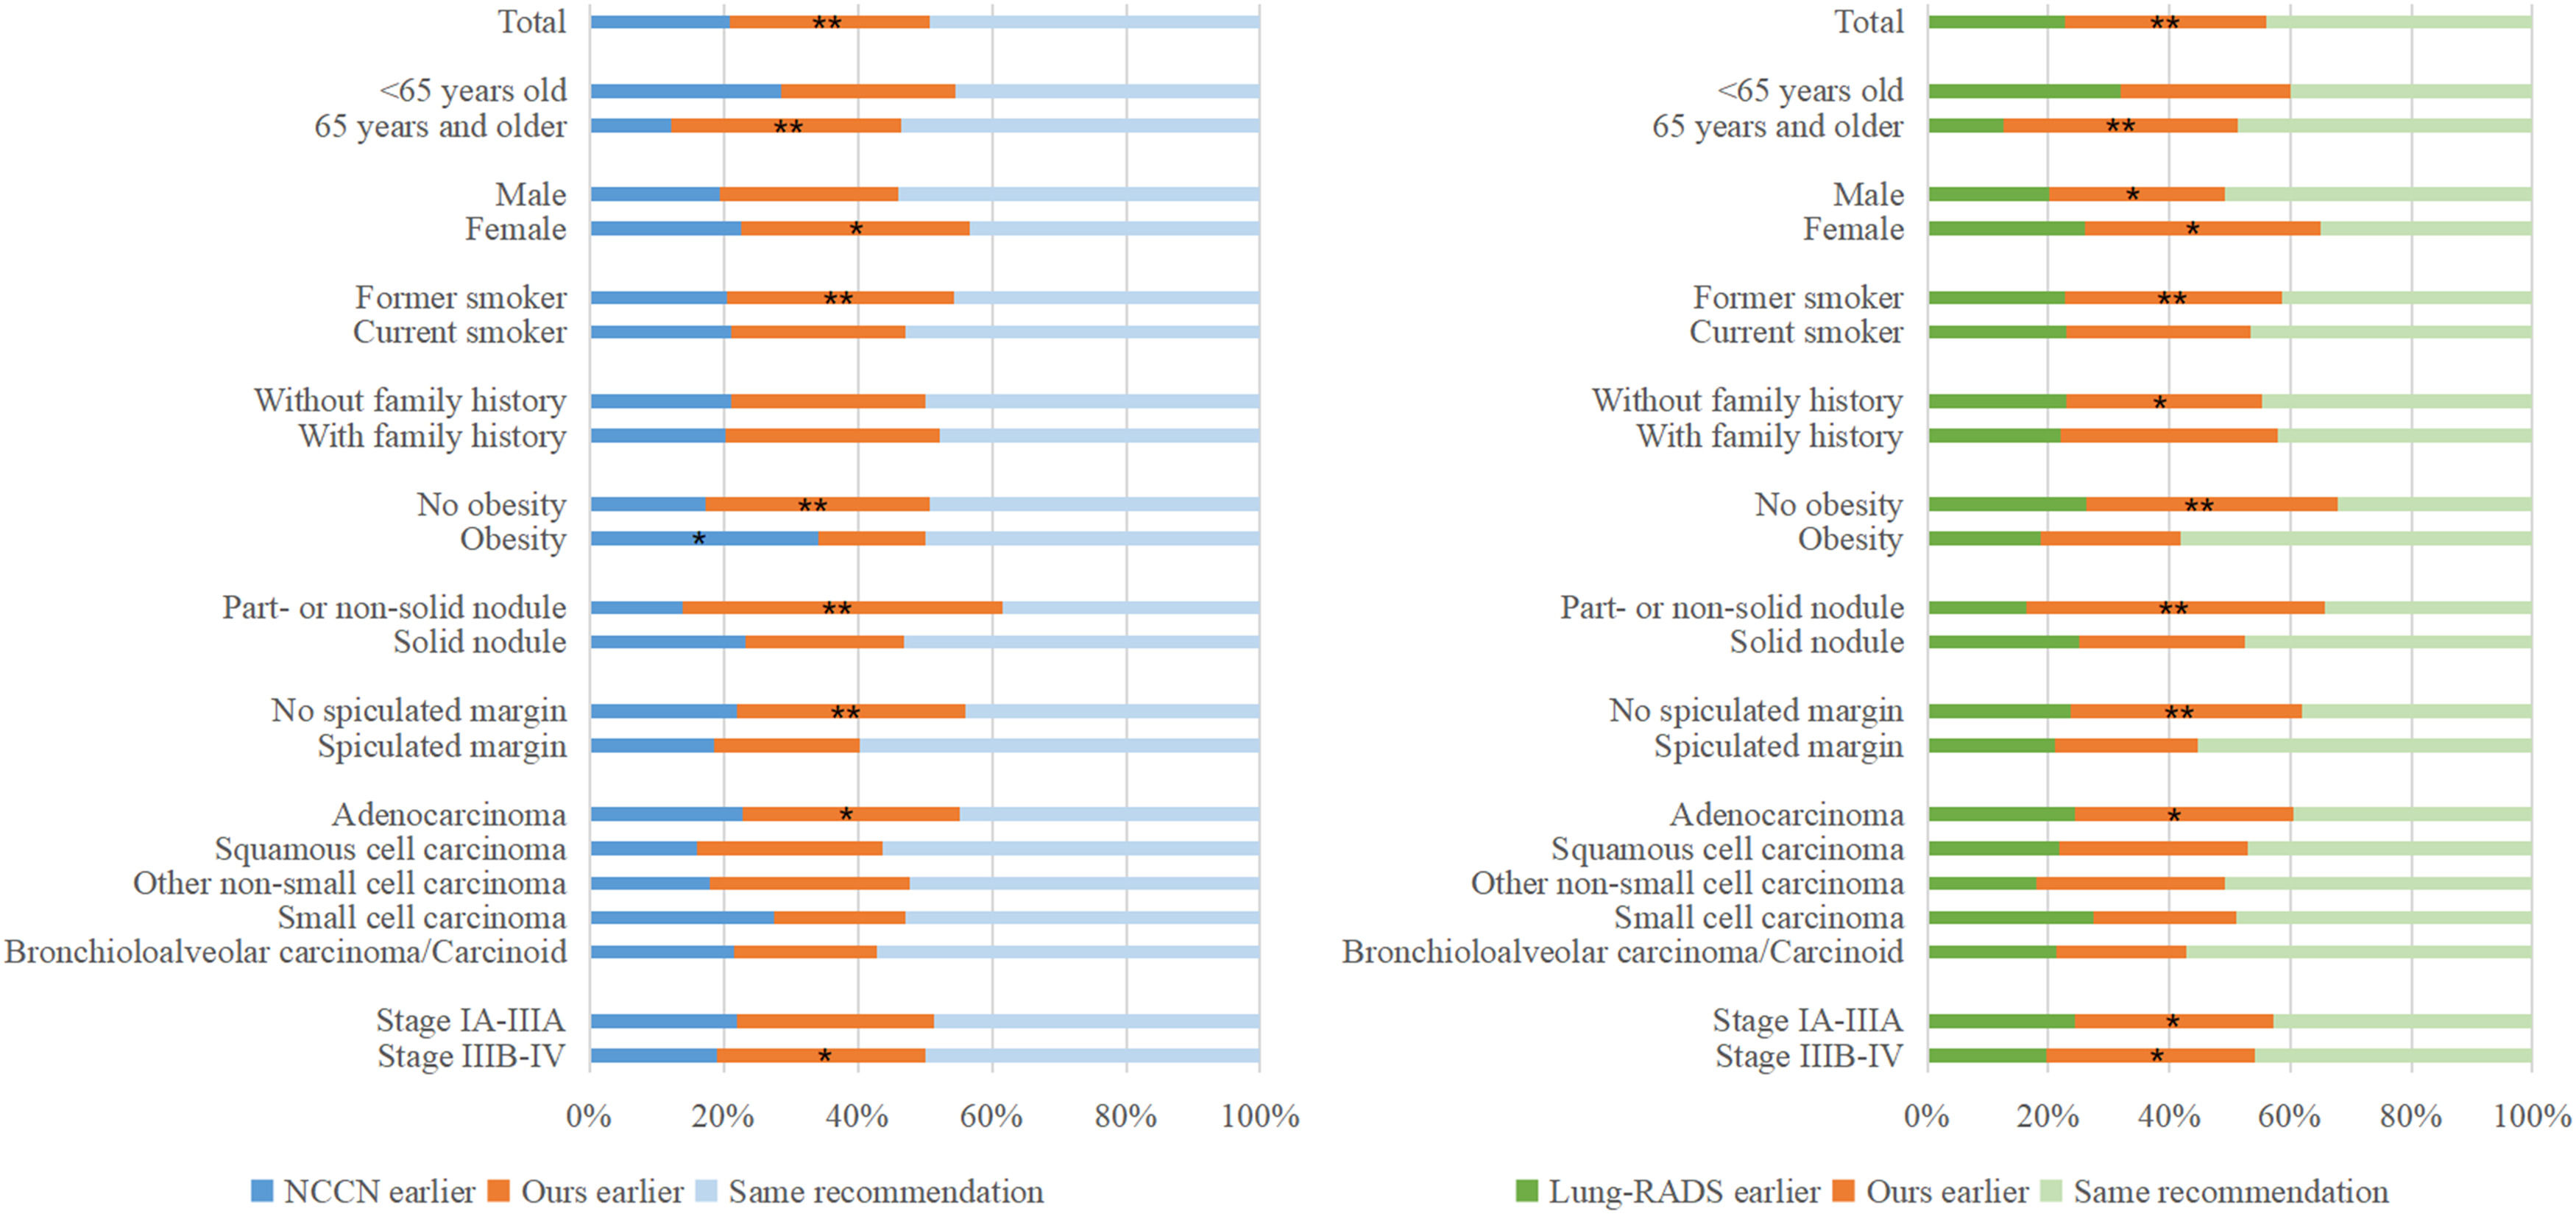
Differences in cancer subgroupsAmong 470 available decision time points for 293 patients with lung cancer in the validation cohort, 232 (49.4 %) and 207 (44.0 %) follow-up testing recommendations were consistent between NCCN and the personalized schema and between Lung-RADS and the personalized schema, respectively. Earlier test recommendation was less frequent using NCCN versus the personalized schema: 98 (20.9 %) versus 140 (29.8 %); p = 0.0065; or using Lung-RADS versus the personalized schema: 107 (22.8 %) versus 156 (33.2 %); p = 0.0025. Subgroup analyses (Fig 2) identified several subgroups of patients with lung cancer who were more likely to benefit from the personalized schema than the NCCN protocol and the Lung-RADS protocol (patients aged ≥65 years, women, former smokers, and patients with part-solid or non-solid attenuation, adenocarcinoma cancer, and stage IIIB-IV; all p < 0.05).
Clinical application
We provide a web application (available at http://www.biostatpumc.com:3838/pred_risk_2.Rmd) for computer or cell phone users to check and update their follow-up recommendations generated by the personalized schema. We illustrate its use in two example cases from our institute and preliminarily examine applicability in NLST-ineligible patients (Fig A.2.).
The schema can be adapted according to patient and physician preferences. Tables A.3–A.5 illustrate that decreasing the criteria of sensitivity(t) or specificity(t) (e.g., from ≥0.95 to ≥0.90) would result in more conservative recommendations (i.e., fewer recommendations for immediate work-up and more for annual screening); in contrast, increasing these criteria would mean more aggressive recommendations.
DiscussionA National Cancer Institute review states that available evidence that supports guidelines on the time target for follow-up after a positive screening is low across cancers, and very low regarding lung cancer.24 Here, we present a personalized solution to this challenge. Compared with two rule-based guideline protocols used frequently in clinical settings, the personalized schema showed better capacity in terms of securing a timely diagnosis while reducing costs and resource use related to avoidable testing. In particular, it demonstrated strength regarding early testing for several subgroups of patients with lung cancer including women, former smokers, and patients with part-solid or non-solid nodules.
The valuable role of risk prediction models in personalizing lung cancer screening has been evidenced in some publications on selecting individuals for screening.25–27 The epidemiological and nodule information that comprised our models were largely the same as existing single-stage models for evaluating lung cancer risk.28–30 This makes our approach open to model comparison, validation, and re-calibration in different populations. The dynamic property, i.e., time-dependent prediction horizon and its associated outputs, sets our approach apart from other models. Because translating risk into a diagnostic decision can lead to error, particularly in the setting of population screening where harm related to mis- or missed diagnosis can be substantially augmented, our models are intended for recommendations regarding a time interval for an upcoming test rather than predicting benignity or malignancy. Our work therefore pertains to longitudinal rather than one-off cancer screening and provides a vehicle to personalize patients’ visit schedules.
Studies have identified that accuracy of Lung-RADS recommendations improve when there is an initial screen to compare against.31 Therefore, it is important to consider time target decision strategies separately in baseline and repeated screening scenarios. In a previous proof-of-concept study, we put forward a radiomics model for follow-up timing after baseline screening, which demonstrated better performance than existing guidelines in a small-sized patient sample.32 As to the application of multiple tests in repeated screening, Tammemägi et al used combinations of positive or negative results throughout R0–R2 among NLST participants and predicted whether a patient would be diagnosed with lung cancer after R2.33 The question is more complicated when it comes to dynamically analyzing the nodule trajectory as an individual's disease history unfolds. Although cancer heterogeneity makes it difficult to identify an optimal solution, our results showed that the proposed schema works better than guideline protocols in repeated screening rounds. This demonstrate that personalized approaches could provide a unique way to deepen understanding as well as a better means (compared with arbitrary cut-offs in nodule size or its increase) to inform follow-up decisions.
Several features of our personalized schema make it distinct from existing rule-based guidelines. First, we did not consider a follow-up interval of 6 months, which neither reduces avoidable tests nor promotes an early diagnosis. Second, the rule-based guidelines differ regarding the management of solid, sub-solid, and non-solid nodules. We have simplified this categorization because its clinical judgment is sometimes challenging and can vary moderately or substantially.34 Third, nodule diameter measurement is prone to error in LDCT and varies among radiologists.21 The joint modelling approach used in this study has unique advantages in avoiding these problems. Nevertheless, the moderate agreement observed between the rule-based and personalized approaches suggest that they can complement each other and be used to generate stronger confidence when recommendations are consistent.
There are several limitations in the study that warrant consideration. First, the extensively validated NLST dataset provides a strong basis for devising follow-up plans in the NLST-eligible population, i.e., individuals aged 55–74 years having a 30 pack-year smoking history; the applicability of our findings in other populations (e.g., younger, or passively smoking) is unclear. Second, prospective and cost-effectiveness studies are needed before integrating the personalized schema into public health programs given discrepancies in region-specific lung cancer epidemic levels and eligibility criteria for screening. Third, despite our efforts to link nodule observations over repeat scans, errors may persist because of insufficient annotation data.35 Fourth, we treated nodules newly detected during R1–R2 in an equal manner as those detected in R0, although the biological properties of incident versus prevalent cancers may vary.36
ConclusionsThe personalized lung cancer screening schema is easy-to-implement and more accurate compared with rule-based protocols. Further research is needed to examine its value in precision screening for lung cancer in diverse populations and settings.
Data availabilityData supporting this work is publicly available through the Cancer Imaging Achieve at: https://www.cancerimagingarchive.net.
Ethics approvalNot applicable.
Patient consentNot applicable.
Declaration of generative AI in scientific writingNone.
This study was supported by the National Natural Science Foundation of China [grant number 82304215], the CAMS Fund for Medical Sciences [grant number 2021- 1-I 2M-022], and the National High Level Hospital Clinical Research Funding [grant number 2022-PUMCH-A-034]. The funders had no role in the study design, in the collection, analysis or interpretation of data, in the writing of the report, or in the decision to submit the article for publication.


