


The site-of-care decision is one of the most important factors in the management of patients with community-acquired pneumonia. The severity scores are validated prognostic tools for community-acquired pneumonia mortality and treatment site decision.
The aim of this paper was to compare the discriminatory power of four scores – the classic PSI and CURB65 and the most recent SCAP and SMART-COP – in predicting major adverse events: death, ICU admission, need for invasive mechanical ventilation or vasopressor support in patients admitted with pneumococcal pneumonia.
MethodsA five-year retrospective study of patients admitted for pneumococcal pneumonia.
Patients were stratified based on admission data and assigned to low-, intermediate-, and high-risk classes for each score. Results were obtained comparing low versus non-low risk classes.
ResultsWe studied 142 episodes of hospitalization with 2 deaths and 10 patients needing mechanical ventilation and vasopressor support. The majority of patients were classified as low risk by all scores – we found high negative predictive values for all adverse events studied, the most negative value corresponding to the SCAP score. The more recent scores showed better accuracy for predicting ICU admission and need for ventilation or vasopressor support (mostly for the SCAP score with higher AUC values for all adverse events).
ConclusionsThe rate of all adverse outcomes increased directly with increasing risk class in all scores. The new gravity scores appear to have a higher discriminatory power in all adverse events in our study, particularly, the SCAP score.
A decisão do local de tratamento é um dos fatores mais importantes na abordagem de doentes com pneumonia adquirida na comunidade. Os scores de gravidade são ferramentas prognósticas validadas para previsão da mortalidade por pneumonia adquirida na comunidade e decisão do local de tratamento.
O objetivo deste trabalho foi comparar o poder discriminatório de 4 scores – os clássicos PSI e CURB-65 e os mais recentes SCAP e COP-SMART – na previsão de eventos adversos: morte, internamento em Unidades de Cuidados Intensivos (UCI), necessidade de ventilação mecânica invasiva ou suporte de aminas vasopressoras em doentes internados com pneumonia pneumocócica.
MétodosFoi efetuado um estudo retrospetivo de doentes internados por pneumonia pneumocócica num período de 5 anos.
Os doentes foram estratificados com base nos dados da admissão e foram-lhes atribuídas classes de risco para cada score: baixo, médio e alto risco. Os resultados foram obtidos comparando as classes de baixo risco versus médio-alto risco.
ResultadosForam estudados 142 episódios de internamento onde se observaram 2 mortes e 10 doentes necessitaram de ventilação mecânica e suporte de aminas. A maioria dos doentes foram classificados como baixo risco por todos os scores – encontrámos altos valores preditivos negativos para todos os eventos adversos estudados sendo o mais elevado correspondente ao SCAP. Os scores mais recentes mostraram uma maior precisão para prever internamento na UCI e necessidade de ventilação ou suporte por aminas (principalmente para o score SCAP com valores mais elevados da AUC para todos os eventos adversos).
ConclusõesA taxa de todos os eventos adversos aumentou com o agravamento da classe de risco em todas os scores. Os scores de gravidade mais recentes parecem ter um maior poder discriminatório para todos os eventos adversos no nosso estudo, em particular, o SCAP.
Community-acquired pneumonia (CAP) is a common illness, with relatively low mortality rates and low resource utilization when managed outside hospital, but a major source of morbidity, mortality and cost when hospitalization is required.1 Streptococcus pneumoniae is not only the main etiological agent associated with CAP but is also the primary pathogen responsible for ICU admission.2
The site-of-care decision is one of the most important in the management of patients with community-acquired pneumonia. Several scoring systems have been developed to predict mortality risk in CAP, and these have been applied to guide physicians about whether patients should be admitted to hospital or to the intensive care unit (ICU). However, these tools were initially developed and have been extensively validated to predict mortality risk and studies have demonstrated that the risk of death does not always equate with the need for hospitalization or ICU care.1
ScoresThe PSI was developed by Fine et al. as part of the Pneumonia Outcomes Research Trial (PORT), and the original description used a derivation cohort of 14199 inpatients with CAP and was then independently validated in 38039 inpatients with CAP and in 2287 inpatients and outpatients prospectively enrolled in the PORT cohort study.3 The PSI uses multiple demographic and historical findings, physical findings and laboratory data, each is assigned a point score, and the total score is used to categorize patients into one of 5 classes, each with a different risk of death.3
The CURB-65 rule is simple, using only five assessments: confusion (due to the pneumonia), blood urea nitrogen >7mmol/L, respiratory rate ≥30/min, blood pressure of <90mmHg systolic or ≤60mm diastolic, and age ≥65 years. Each of these 5 criteria receives 1 point, and the score falls between 0 and 5, with mortality risk rising with the score.4
Recently, España et al. developed and validated a rule to identify patients who need additional monitoring and more aggressive treatment after the first evaluation in the emergency room. They determined that the need for ICU admission was defined by the presence of one of two major criteria: arterial pH<7.30 or systolic blood pressure<90mmHg. In the absence of these criteria, severe CAP also could be identified by the presence of two of six minor criteria. These included: confusion, urea>30mg/dL, respiratory rate>30/min, PaO2/FiO2 ratio<250 or PO2<54mmHg, multilobar infiltrates and age ≥80 years. One advantage of this scoring system, compared with the IDSA/ATS criteria, is that different clinical findings had different point values for defining severe CAP. Need for ICU was defined as more than 10 points, in a system where a pH<7.30 earned 13 points and systolic blood pressure<90mmHg earned 11 points. The other criteria each earned less than 10 points, and thus more than one was required to define need for ICU care.5,6
The fourth severity score was developed by Charles et al., using a multivariate model, and it values the eight clinical features associated with the need for intensive respiratory or vasopressor support (IRVS) and they could be summarized by the acronym ‘SMART-COP’: systolic blood pressure<90mmHg, multilobar chest infiltrates, albumin<3.5g/dL, respiratory rate elevation (≥25 for those ≤50 years, and ≥30 for those>age 50 years), tachycardia (≥125/min), confusion (new onset), low oxygen (PaO2<70mm Hg, saturation ≤93% or PaO2/FiO2 ratio<333 if ≤50 years-old or PaO2<60mmHg, saturation ≤90% or PaO2/FiO2 ratio<250 if aged>50), and arterial pH<7.35. The abnormalities in systolic blood pressure, oxygenation and arterial pH each received 2 points, while the five other criteria received 1 point each, and with this system, the need for IRVS was predicted by a SMART-COP score of at least 3 points.7
The PSI and CURB-65 scores were validated as tools to predict mortality and the site of care decision was translated regarding mortality risks – they are not, per se, scores to assess the severity of pneumonia and were not developed to assess the need for ICU admission. However the more recent SCAP and SMART-COP were primarily developed for severe pneumonias in order to distinguish which patients would benefit from closer monitoring, aggressive treatment and/or ICU admission – they need further validation to assess their accuracy.
The aim of this paper was to compare the discriminatory power of these four scores – the classic PSI and CURB65 and the most recent SCAP and SMART-COP – in predicting major adverse events: death, ICU admission, need for invasive mechanical ventilation or vasopressor support.
Materials and methodsThis article presents a 5-year retrospective study of patients admitted for pneumococcal pneumonia between the years 2005 and 2010 in the pulmonology department based on the data recorded at admission and the patient clinical evolution.
All patients were HIV-negative. Missing values were set to normal.The patients were stratified based on admission data and assigned to risk classes for each score, as validated by previous studies.8,9 Patients were assigned to low-, intermediate-, and high-risk classes as follows: PSI score: low risk, classes I through III; intermediate risk, class IV; and high risk, class V; CURB-65: low risk, classes 0 to 1; intermediate risk, class 2; and high risk, classes 3 through 5; SCAP score: low risk, classes 0–1 (0–9 points); intermediate risk, class 2 (10–19 points); and high risk, classes 3–4 (≥20 points) and SMART-COP score: low risk, 0–2 points; intermediate risk, 3–4 points; and high risk, ≥5 points.1,3–9 The following four adverse outcomes were evaluated: death, ICU admission, need for invasive mechanical ventilation or vasopressor support.
The study was conducted in a tertiary public hospital which had 580 inpatient beds (27 in the pulmonology department, five of which were in isolation rooms) and 12 polivalent ICU beds plus 18 cardiothoracic and cardiology/coronary ICU beds. It is the reference hospital for around 400000 citizens and second line for over 600000 citizens. Each year, around 150–200 patients with pneumonia are admitted to the pulmonology department.
The diagnosis of pneumonia was made according to the standardized best clinical practice – acute illness associated with ≥1 of the respiratory symptoms: pain, dyspnea, fever or hypothermia, altered breath sounds on auscultation, and the presence of a new infiltrate on a chest radiograph. Pneumoccocal pneumonia was defined as a pneumonia associated with positive sputum, bronchoalveolar lavage, blood or pleural fluid culture and/or rapid urinary antigen testing and an absence of alternative cultural microbiological agent.10–12
All patients received antibiotic regimens with expected efficacy in accordance with the accepted national and international guidelines within the first hours of ER admittance.10,11
Treatment failure was defined as a lack of response or clinical deterioration (hemodynamic instability, impairment of respiratory failure, need for mechanical ventilation, radiographic progression, or appearance of new metastatic infectious foci) with appropriate drug dosage and delivery system, which led to a change in antibiotic regimen.13
Descriptive statistical measures of the studied variables included mean and standard deviation for continuous variables, and absolute frequency and percentage for each category of a categorical variable. For each major adverse event and for each score, the ROC curve plotting sensitivity against one minus specificity was considered, and the area under the curve (AUC) was calculated. This is a measure of the global diagnostic exactness of the score. Estimates for sensitivity, specificity and negative predictive value for each score separated into low versus non-low risk classes were then presented.
All statistical analyses were performed with SPSS version 19 and MedCalc version 12. Significance level was fixed at 0.05.
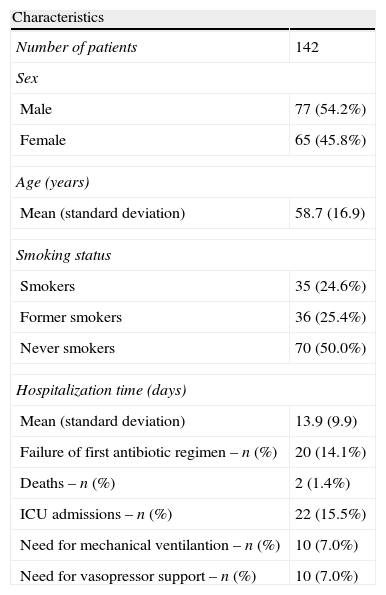
ResultsDuring this five-year period, we assessed 142 episodes of hospitalization for pneumococcal pneumonia. The majority of patients were male with a mean age of 58.7 years. The main patient characteristics are summarized in the following table (Tables 1 and 2).
Some demographic and clinical characteristics of the sampled patients.
| Characteristics | |
| Number of patients | 142 |
| Sex | |
| Male | 77 (54.2%) |
| Female | 65 (45.8%) |
| Age (years) | |
| Mean (standard deviation) | 58.7 (16.9) |
| Smoking status | |
| Smokers | 35 (24.6%) |
| Former smokers | 36 (25.4%) |
| Never smokers | 70 (50.0%) |
| Hospitalization time (days) | |
| Mean (standard deviation) | 13.9 (9.9) |
| Failure of first antibiotic regimen – n (%) | 20 (14.1%) |
| Deaths – n (%) | 2 (1.4%) |
| ICU admissions – n (%) | 22 (15.5%) |
| Need for mechanical ventilantion – n (%) | 10 (7.0%) |
| Need for vasopressor support – n (%) | 10 (7.0%) |
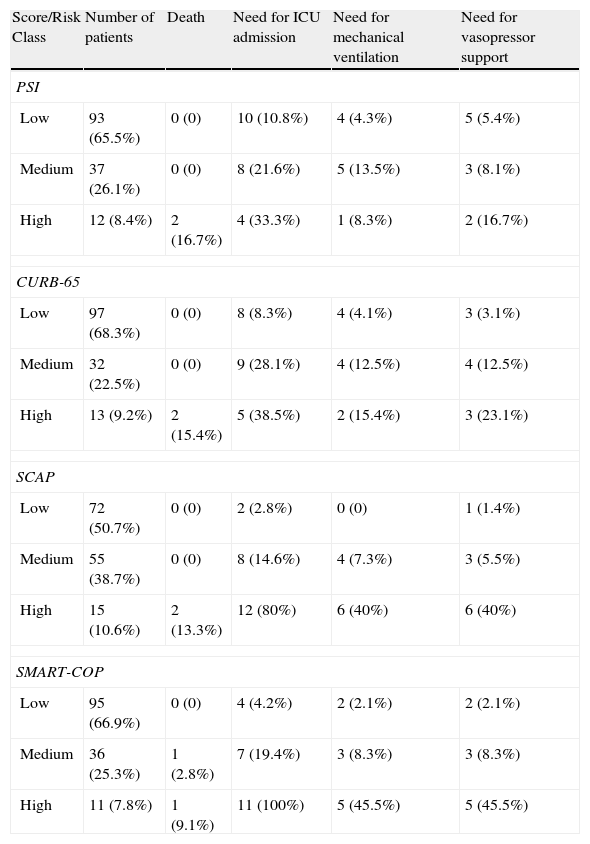
Distribution of patients according to each score on admission and percentage of major adverse events in each risk class.
| Score/Risk Class | Number of patients | Death | Need for ICU admission | Need for mechanical ventilation | Need for vasopressor support |
| PSI | |||||
| Low | 93 (65.5%) | 0 (0) | 10 (10.8%) | 4 (4.3%) | 5 (5.4%) |
| Medium | 37 (26.1%) | 0 (0) | 8 (21.6%) | 5 (13.5%) | 3 (8.1%) |
| High | 12 (8.4%) | 2 (16.7%) | 4 (33.3%) | 1 (8.3%) | 2 (16.7%) |
| CURB-65 | |||||
| Low | 97 (68.3%) | 0 (0) | 8 (8.3%) | 4 (4.1%) | 3 (3.1%) |
| Medium | 32 (22.5%) | 0 (0) | 9 (28.1%) | 4 (12.5%) | 4 (12.5%) |
| High | 13 (9.2%) | 2 (15.4%) | 5 (38.5%) | 2 (15.4%) | 3 (23.1%) |
| SCAP | |||||
| Low | 72 (50.7%) | 0 (0) | 2 (2.8%) | 0 (0) | 1 (1.4%) |
| Medium | 55 (38.7%) | 0 (0) | 8 (14.6%) | 4 (7.3%) | 3 (5.5%) |
| High | 15 (10.6%) | 2 (13.3%) | 12 (80%) | 6 (40%) | 6 (40%) |
| SMART-COP | |||||
| Low | 95 (66.9%) | 0 (0) | 4 (4.2%) | 2 (2.1%) | 2 (2.1%) |
| Medium | 36 (25.3%) | 1 (2.8%) | 7 (19.4%) | 3 (8.3%) | 3 (8.3%) |
| High | 11 (7.8%) | 1 (9.1%) | 11 (100%) | 5 (45.5%) | 5 (45.5%) |
During the hospital stay, we observed that 14.1% of patients had an initial treatment failure defined by clinical worsening despite antibiotic therapy according to best practice guidelines, and needed changes in their antibiotic regimen.
From the follow-up of these episodes 2 deaths (1.4%) and 22 admissions to the ICU (15.5%) were reported with 10 patients needing mechanical ventilation and 10 patients needing vasopressor support (7.0%).
The majority of patients were assigned to low-risk classes in all severity scores (between 50.7 and 68.3%).
The PSI, CURB-65 and SMART-COP scores show quite similar numbers for each risk class (although these patients were not necessarily stratified in the same risk class for each score). The SCAP score significantly labels more patients as medium risk.
Prediction of adverse outcomesTable 2 shows the predictive accuracy of the PSI, CURB-65, SCAP and SMART-COP score for ICU admission, need for mechanical ventilation, need for vasopressor support and mortality. The adverse outcome rate increased steadily from low- to high risk classes for all four instruments.
The classification as high risk patients in the 2 new scores shows higher accuracy for predicting all adverse outcomes, compared to the classic scoring systems.
Low versus non-low risk classFor each risk class we separated the low versus non-low risk classes and for each group we assessed the sensitivity, specificity and negative predicted value for the anticipating major adverse outcomes defined by the classification of a certain patient in a non-low risk class. The importance of a correct distinction for these two groups is consistent with the conviction that patients within the low risk classes can be safely treated at home as they have low mortality risk.
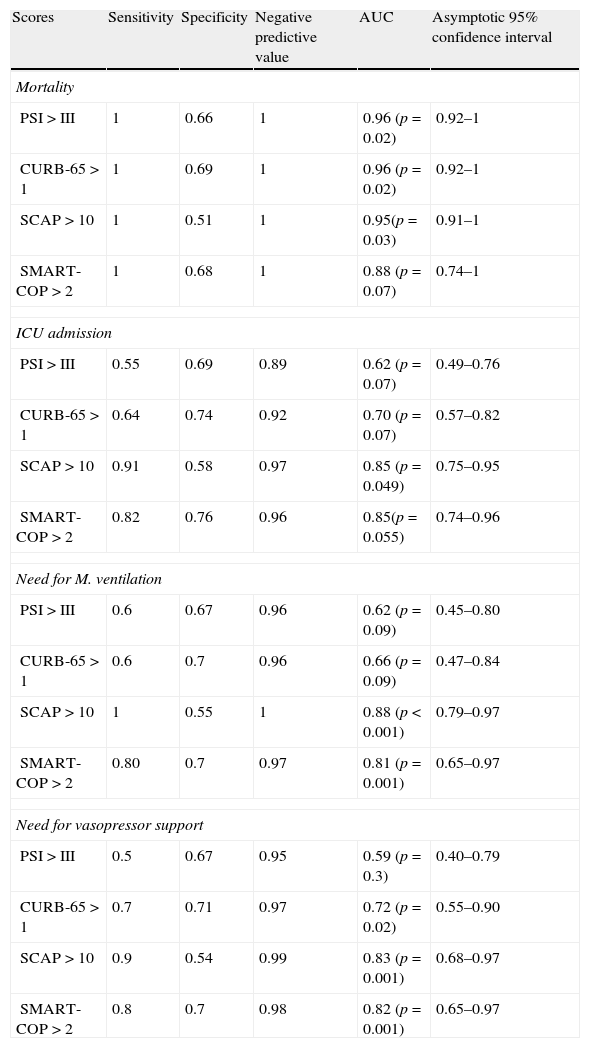
We calculated the area under the ROC curve (AUC) for each severity score and for each major adverse event. Results are summarized in Table 3.
Sensitivity, specificity, negative predictive value and AUC for each major adverse event when comparing medium and high risk classes versus low risk class for each score.
| Scores | Sensitivity | Specificity | Negative predictive value | AUC | Asymptotic 95% confidence interval |
| Mortality | |||||
| PSI>III | 1 | 0.66 | 1 | 0.96 (p=0.02) | 0.92–1 |
| CURB-65>1 | 1 | 0.69 | 1 | 0.96 (p=0.02) | 0.92–1 |
| SCAP>10 | 1 | 0.51 | 1 | 0.95(p=0.03) | 0.91–1 |
| SMART-COP>2 | 1 | 0.68 | 1 | 0.88 (p=0.07) | 0.74–1 |
| ICU admission | |||||
| PSI>III | 0.55 | 0.69 | 0.89 | 0.62 (p=0.07) | 0.49–0.76 |
| CURB-65>1 | 0.64 | 0.74 | 0.92 | 0.70 (p=0.07) | 0.57–0.82 |
| SCAP>10 | 0.91 | 0.58 | 0.97 | 0.85 (p=0.049) | 0.75–0.95 |
| SMART-COP>2 | 0.82 | 0.76 | 0.96 | 0.85(p=0.055) | 0.74–0.96 |
| Need for M. ventilation | |||||
| PSI>III | 0.6 | 0.67 | 0.96 | 0.62 (p=0.09) | 0.45–0.80 |
| CURB-65>1 | 0.6 | 0.7 | 0.96 | 0.66 (p=0.09) | 0.47–0.84 |
| SCAP>10 | 1 | 0.55 | 1 | 0.88 (p<0.001) | 0.79–0.97 |
| SMART-COP>2 | 0.80 | 0.7 | 0.97 | 0.81 (p=0.001) | 0.65–0.97 |
| Need for vasopressor support | |||||
| PSI>III | 0.5 | 0.67 | 0.95 | 0.59 (p=0.3) | 0.40–0.79 |
| CURB-65>1 | 0.7 | 0.71 | 0.97 | 0.72 (p=0.02) | 0.55–0.90 |
| SCAP>10 | 0.9 | 0.54 | 0.99 | 0.83 (p=0.001) | 0.68–0.97 |
| SMART-COP>2 | 0.8 | 0.7 | 0.98 | 0.82 (p=0.001) | 0.65–0.97 |
When applying the Hanley and McNeil14 method for comparing paired AUC we found that for the mortality there was no statistically significant difference between all the scores. For ICU admittance both SCAP and SMART-COP are superior to PSI and CURB-65, but there are no statistically significant differences between the former pair or the latter. Regarding the need for mechanical ventilation, SCAP is superior to PSI and CURB-65, SMART-COP is superior only to PSI and there are no differences between SCAP and SMART-COP. Concerning the need for vasopressor support both SCAP and SMART-COP are superior to PSI but not to CURB-65, without any difference between SCAP and SMART COP.
For each adverse advent a ROC curve for each score was produced (Figs. 1–4).
DiscussionThe vast majority of patients were assigned to low and medium risk classes in all scores.


We found a high percentage of patients with an initial stratification of low risk that were admitted to the hospital (50.7–68.3%). Even though there is a majority of patients classified as low-risk in all scoring systems, the attending physicians considered nevertheless that the patients had a clinical condition or social problem that made for hospital treatment (the most common reported causes of admission despite the low risk scores were the presence of respiratory failure, multilobar opacities and/or pleural effusion, decompensation of comorbidities and lack of social support).
All the scores in the study presented very high negative predictive values for studied adverse events. This means that when considered as being a low-risk patients the probability of developing an adverse event is quite low. This is consistent with the idea that these patients can potentially be treated at home.
When addressing the question of which of the severity scores was the best at establishing the low risk, the score that had the highest negative predictive value in all adverse outcomes was the SCAP score.
Compared to the other scores, SCAP significantly stratified more patients in the medium risk class. The differences might be due to the underestimation, by the classic scores, of the radiological appearance and the gravity of respiratory insufficiency at the time of admission (the latter being a major drawback of the CURB-65) and the overestimation of stable co morbidities and the greater number of variables addressed by the PSI.
Most of the adverse outcomes are reported in the high-risk class patients – this is more significant in the new scores (SCAP and SMART-COP) where percentage of patients in the high risk class and ICU admission, mechanical ventilation or vasopressor support was quite high. This is consistent with the purpose for which they were developed (to accurately select the high risk patients, mostly the ones that will need close monitoring and more aggressive treatment or ICU admission).
All scores had very high sensitivity and negative predictive values for assessing the risk of mortality.
When applying the Hanley and McNeil14 method for comparing paired AUC we observed that SCAP score was statistically superior to PSI and CURB-65 for predicting the need for ICU admission and mechanical ventilation, but only superior to PSI regarding vasopressor support.
The SMART-COP score proved statistically superior to PSI and CURB-65 for predicting the need for ICU admission, but only superior to PSI for mechanical ventilation and vasopressor support.
There were no statistical differences between SCAP and SMART-COP comparing their AUC for each score.
In the literature we found some studies which compared different severity scores, most commonly for community acquired pneumonia. The majority address the mortality rate and ICU admission and only a few address other variables such as need for vasopressor support, mechanical ventilation or total length of stay as independent outcomes in their studies.
The rate of treatment failure in community acquired pneumonia is estimated to be between 10 and 15%.14 In a Portuguese university hospital study of mortality in patients admitted with pneumococcal pneumonia, the authors observed a need for antibiotic change in 15.4% characterized by clinical worsening and persistence indications of infection and fever.15 Our results were consistent with these previous studies and since the population was the same for all the scoring systems, the authors do not consider the rate of treatment failure to have influenced the outcomes of this study.
In a Spanish study of patients hospitalized for pneumonia, Rosón described that 43% of patients were admitted even though they were low-risk patients according to the PSI.16 They found that these patients had respiratory failure, pleural effusions or unstable vital sounds and that these parameters could not be correctly assessed by relying solely on the PSI score.16
Previous studies have shown that both PSI and CURB-65 perform consistently as predictors for mortality with AUC values ranging from 0.74 to 0.83 for PSI and from 0.73 to 0.83 for CURB-65. When predicting other adverse events such as need for mechanical ventilation or vasopressor support these values are less impressive – AUC between 0.69 and 0.79 for PSI and between 0.59 and 0.77 for CURB-65.17–23 The SMART-COP has been shown to outperform these previous scores with AUC of 0.87 for these last adverse events.7
A Swedish study of prognostic scores in community acquired bacteriaemic pneumococcal pneumonia showed that the classification of patients in the PSI risk classes of IV–V had sensitivity/specificity/PPV/NPV for mortality of 100/60/25/100 and ICU admission of 95/64/36/98. The CURB-65 classification in the classes 3–5 had poorer results respectively 62/86/36/95 for mortality and 71/87/55/91 for ICU admission.24 Our study showed similar results regarding mortality but slightly less impressive values for ICU admission in these classic scores.
España et al. found that the SCAP score was as accurate or better than other scoring systems (CURB-65 and PSI) in predicting adverse outcomes in patients hospitalized with CAP while helping classify patients into different categories of increasing risk for potentially closer monitoring.6 They also found that the SCAP score classified a significantly higher proportion of patients as low risk than the PSI and CURB-65, with lower rates of all adverse outcomes.6 These results were different in our study, where SCAP stratified a lesser number of patients compared to the other 3 scores and a higher number in the medium risk.
This study has some limitations. Firstly, all included patients were admitted to the hospital and the data did not address the great number of patients that were treated as outpatients and their outcomes or complications. Secondly, the sample size and the number of adverse events (most importantly the low number of deaths) observed in this study can be a limiting factor for its conclusions. Thirdly, not all data were available. Nevertheless, the amount of values found to be missing from the admission records was low (<2%) and most commonly associated with the respiratory rate – for the purposes of this study the authors consider it did not represent an important limitation since the cut off for the respiratory rate values are similar (the SCAP being age related).
The sensitivity for the other major adverse outcomes is considerably higher in the new severity scores (>80% for all major adverse outcomes) as compared with the more classic scores. The SCAP score while stratifying a greater number of patients as medium risk has a lower specificity for the prediction of adverse events. Nevertheless, it has the best AUC for all adverse events and so the highest diagnostic accuracy.
ConclusionsThe classic severity scores (PSI and CURB-65) were developed to select the patients with community acquired pneumonia with low risk for mortality in the short-term period that could safely be treated at home. More recent severity scores (SCAP and SMART-COP) were developed to select the patients with severe pneumonia at risk for adverse outcomes such as mortality, need for ICU admission, vasopressor and ventilation support, and that need closer monitoring and more aggressive treatment.
All scores performed quite well in establishing the low risk class patients who have less probability of having an adverse event and that can be potentially treated at home.
The rate of all adverse outcomes increased directly with increasing risk class in all scores. The new gravity scores appear to have a higher discriminatory power to all adverse events in our study, in particular, the SCAP.
Therefore the authors conclude that the new pneumonia scoring systems appear to be as good as or better than the classic scores in predicting adverse events related to (pneumococcal) pneumonia.
Conflicts of interestThe authors have no conflicts of interest to declare.
Please cite this article as: Ribeiro C, Ladeira I, Gaio AR, Brito MC. Pneumonia pneumocócica – serão os novos scores mais precisos a prever eventos desfavoráveis? Rev Port Pneumol. 2013;19:252–259.


