
Cancer is related to a deterioration of nutritional status and quality of life (QoL), but the extent of these conditions in patients with Non Small Cell Lung Cancer (NSCLC) has not been studied. The aim of the present study was to assess the association between QoL and undernutrition in NSCLC patients. Nutritional status was evaluated with Patient Generated – Subjective Global Assessment and QoL using the European Organization for Research and Treatment of Cancer Quality of Life – C30 and also with the specific module for lung cancer patients. A consecutive sample of fifty six patients diagnosed with NSCLC was evaluated. A high proportion of patients is undernourished (35.7%), 1.8% in early stages vs 33.9% in advanced stages of disease. Undernutrition is related to measured dimensions of QoL: lack of appetite (rho=0.70), fatigue (rho=0.54), nausea and vomiting (rho=0.52) and constipation (rho=0.56). Undernourished patients have worse global health status, physical, emotional, social and role functioning.
Patients with NSCLC have high frequency of undernutrition in advanced stages of disease. Undernourished patients present more symptoms, a worse global health status/QoL, physical, role, emotional and social functioning than patients without undernutrition. Undernutrition is associated with worse QoL, specifically in the parameters: appetite loss, nausea and vomiting, constipation and fatigue.
O cancro está associado a uma deterioração do estado nutricional e da qualidade de vida (QdV), mas não se conhece a dimensão destas consequências nos doentes com cancro do pulmão não pequenas células (CPNPC). O objectivo deste estudo foi avaliar a associação entre a qualidade de vida e a desnutrição em doentes com CPNPC. O estado nutricional foi avaliado pelo Patient Generated – Subjective Global Assessment e a QdV foi avaliada através do European Organization for Research and Treatment of Cancer Quality of Life – C30 e do módulo específico para doentes com cancro do pulmão. Foi avaliada uma amostra com cinquenta e seis doentes diagnosticados com CPNPC. Uma elevada proporção de doentes encontra-se desnutrida (35,7%), dos quais 1,8% em estádios precoces vs 33,9% em estádios avançados de doença. A desnutrição está associada a dimensões de QdV como a falta de apetite (rho=0,70), fadiga (rho=0,54), náuseas e vómitos (rho=0,52) e também obstipação (rho=0,56). Os doentes com CPNPC apresentam elevada frequência de desnutrição nos estádios avançados de doença. Os doentes desnutridos apresentam mais sintomatologia e piores estado de saúde global, de funcionamento físico, emocional, social e de desempenho, do que os doentes sem desnutrição. A desnutrição está associada com pior QdV, especificamente nos parâmetros: falta de apetite, náuseas e vómitos, obstipação e fadiga.
Undernutrition is a common problem in patients with cancer, frequency varies according to location of tumor, the stage of the disease and the type of treatment.1 Awareness concerning nutritional status of patients with lung cancer is scarce, however it is estimated that 46% of these patients are undernourished.1 Weight loss affects the response to treatment and the susceptibility to adverse effects leading to a worse prognosis and Quality of Life (QoL).2–4 Undernutrition can progress to cachexia, which encompasses a large spectrum of situations ranging from weight loss to a state associated with a severe disability that generally leads to death.2,5
The QoL is an important outcome of the disease and its treatment and represents a growing concern in controlling the disease. The QoL is described as a prognostic factor in survival of patients with Non Small Cell Lung Cancer (NSCLC).6,7 However, the extent of these conditions in patients with NSCLC is still to be evaluated. The aim of the present study was to assess the association between QoL and undernutrition in NSCLC patients.
Materials and MethodsA cross-sectional study was conducted among outpatients of Pulmonary Oncology Department of Centro Hospitalar de Vila Nova de Gaia/Espinho, Portugal. Inclusion criteria were being Caucasian, over eighteen years old, with a histological diagnosis of NSCLC. Previous nutritional advice and the inability to complete the self-administration questionnaires were exclusion criteria. Patients were consecutively included in the study sample from October 2007 to May 2008.
The study protocol was approved by the Hospital Ethical Committee and the Administration Board of the study institution. All patients gave their informed consent to participate according with the recommended in the Declaration of Helsinki .8
Data CollectionAll the information was collected by the same interviewer (SX) using a structured questionnaire, with the exception of parameters that were validated in order to be assessed by self-administration questionnaires. Data on demographic and social characteristics, time of diagnosis (number of months between the diagnosis and date of assessment) and relevant clinical aspects (previous and current treatments and family history of cancer) was obtained.
Anthropometric data was collected applying standard procedures.9 The percentage of weight loss (% weight loss), was calculated considering the usual weight prior to first symptoms or the weight registered in the first clinical consultation.
Scored Patient Generated Subjective Global Assessment (PG-SGA) was used to determine the patient's nutritional status10–12 The PG-SGA provides a global rating of moderate or suspected undernourishment, to severely undernourished or not undernourished.10–12 The scored PG-SGA is a further development of the PG-SGA concept that incorporates a numerical score used to define the strategies of nutritional intervention. 10–12
The assessment of QoL was made by the European Organization for Research and Treatment of Cancer Quality of Life Questionnaire-C30 (EORTC-QLQ/C30) with the specific module to Lung Cancer, the European Organization for Research and Treatment of Cancer Quality of Life Questionnaire Lung Cancer Module (EORTC QLQ-LC13) which are the methods of QoL assessment most commonly used in Europe and which have proved to be the best tools developed to date.13–16 The QLQ-C30 is composed of multi-item scales and single items that reflect the multidimensionality of the QoL construct.15 The scales and individual items are rated from 0 to 100%. A high score in the state of global health and functional scales represents a high level of functioning and therefore better QoL, a high score for the scale of symptoms represents a high level of symptoms/ problems and therefore worse QoL. The coding of the questionnaire was performed according to recommendations of EORTC.17 The QLQ LC13 comprises thirteen questions assessing the symptoms associated with lung-cancer, treatment-related side effects and pain medication. The scoring approach for the QLQ-LC13 is identical in principle to that for the symptom scales/ single items of the QLQ-C30.17
Data AnalysisParticipants were divided into two groups according to stage of disease: group 1 (stage I, II and IIIA) and group 2 (stage IIIB and IV). As stage IIIA allows more radical treatment options and is usually associated with higher survival when compared with stage IIIB and IV, we chose to include this stage in group 1.18 PG-SGA data was organized in two classes, not undernourished and moderate/severe undernutrition. QoL was analysed according to classes of PG-SGA and the association between QoL and undernutrition was estimated.
Parameters of location and dispersion for continuous variables and absolute and relative frequencies for categorical variables were estimated. As the distributions of continuous parameters evaluated were not normal, the Mann-Whitney U test was used. The distribution of frequencies was compared by the chi-square test or the Fisher exact test when the expected value in 20% (or less) of cells was less than 5. Spearman correlation coefficients were calculated to evaluate the association between QoL and nutritional status. The significance level was 5%. Statistical analyses were performed using SPSS 14.0 for Windows.
ResultsThis sample includes 56 patients diagnosed with NSCLC (14 female and 42 male) with an overall mean age 64.3 years (standard deviation=10.8 years). The group 1 is composed of 14 patients and group 2 of 42 patients.
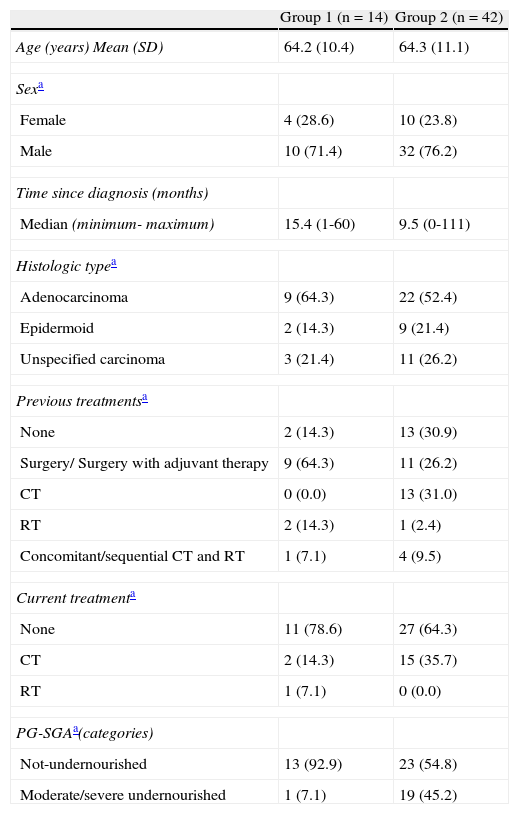
Female patients are older than male patients and most patients have a low education level. The most frequent histological type is the adenocarcinoma and the majority of patients had no family history of cancer. The most common previous treatment in patients of group 1 was surgery/ surgery with adjuvant therapy, while in patients of group 2 was chemotherapy. Most patients of group 1 (78.6%) were not receiving any treatment at the time of the evaluation. However, 15 patients of group 2 were undergoing chemotherapy (Table 1).
Sample characteristics.
| Group 1 (n=14) | Group 2 (n=42) | |
| Age (years) Mean (SD) | 64.2 (10.4) | 64.3 (11.1) |
| Sexa | ||
| Female | 4 (28.6) | 10 (23.8) |
| Male | 10 (71.4) | 32 (76.2) |
| Time since diagnosis (months) | ||
| Median (minimum- maximum) | 15.4 (1-60) | 9.5 (0-111) |
| Histologic typea | ||
| Adenocarcinoma | 9 (64.3) | 22 (52.4) |
| Epidermoid | 2 (14.3) | 9 (21.4) |
| Unspecified carcinoma | 3 (21.4) | 11 (26.2) |
| Previous treatmentsa | ||
| None | 2 (14.3) | 13 (30.9) |
| Surgery/ Surgery with adjuvant therapy | 9 (64.3) | 11 (26.2) |
| CT | 0 (0.0) | 13 (31.0) |
| RT | 2 (14.3) | 1 (2.4) |
| Concomitant/sequential CT and RT | 1 (7.1) | 4 (9.5) |
| Current treatmenta | ||
| None | 11 (78.6) | 27 (64.3) |
| CT | 2 (14.3) | 15 (35.7) |
| RT | 1 (7.1) | 0 (0.0) |
| PG-SGAa(categories) | ||
| Not-undernourished | 13 (92.9) | 23 (54.8) |
| Moderate/severe undernourished | 1 (7.1) | 19 (45.2) |
SD: standard deviation; NSCLC: Non Small Cell Lung Cancer; CT: chemotherapy; RT: Radiotherapy; PG-SGA: Patient Generated Subjective Global Assessment
The proportion of weight loss from the time of the first symptoms until the time of data collection varied. Eight patients (57.1%) of group 1 increased their weight, while 22 patients (52.4%) of group 2 lost weight. Sixty-four percent of patients of group 1 presented a total numerical score of PG-SGA between 4 and 8, while 57.1% of group 2 patients presented a total numerical score ≥ 9. Although 35.7% of patients of group 2 were moderately undernourished or at risk of undernutrition and 9.5% of patients were severely undernourished, only one patient (7.1%) of group 1 was moderately undernourished or at risk for undernutrition (Table 1).
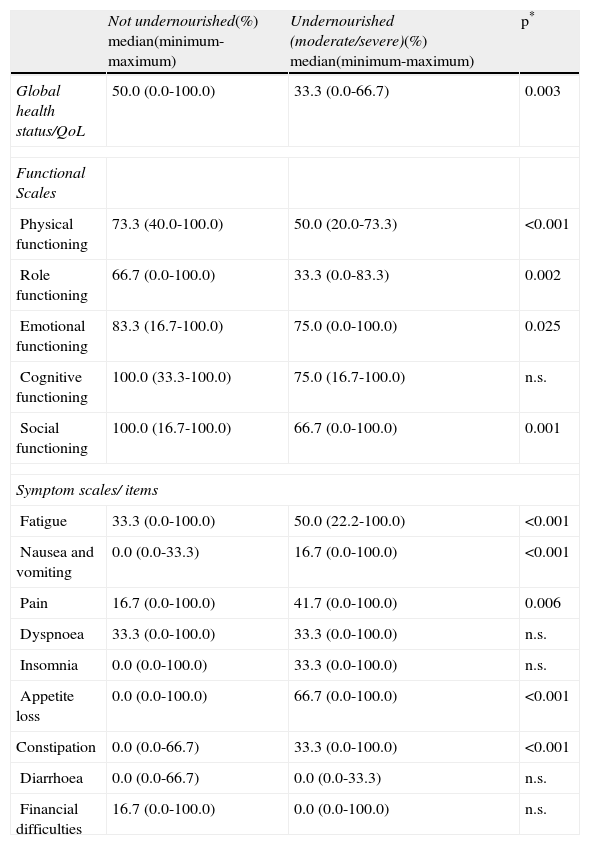
When QoL was stratified according to nutritional status, undernourished patients had a lower global health status/QoL (p=0.003) and worse functioning (physical, role, emotional and social). They also more frequently showed fatigue (p<0.001), nausea and vomiting (p<0.001), pain (p=0.006), appetite loss (p<0.001) and constipation (p<0.001) (Table 2).
Evaluation of QoL by EORTC QLQ-C30, according to PG-SGA.
| Not undernourished(%) median(minimum-maximum) | Undernourished (moderate/severe)(%) median(minimum-maximum) | p* | |
| Global health status/QoL | 50.0 (0.0-100.0) | 33.3 (0.0-66.7) | 0.003 |
| Functional Scales | |||
| Physical functioning | 73.3 (40.0-100.0) | 50.0 (20.0-73.3) | <0.001 |
| Role functioning | 66.7 (0.0-100.0) | 33.3 (0.0-83.3) | 0.002 |
| Emotional functioning | 83.3 (16.7-100.0) | 75.0 (0.0-100.0) | 0.025 |
| Cognitive functioning | 100.0 (33.3-100.0) | 75.0 (16.7-100.0) | n.s. |
| Social functioning | 100.0 (16.7-100.0) | 66.7 (0.0-100.0) | 0.001 |
| Symptom scales/ items | |||
| Fatigue | 33.3 (0.0-100.0) | 50.0 (22.2-100.0) | <0.001 |
| Nausea and vomiting | 0.0 (0.0-33.3) | 16.7 (0.0-100.0) | <0.001 |
| Pain | 16.7 (0.0-100.0) | 41.7 (0.0-100.0) | 0.006 |
| Dyspnoea | 33.3 (0.0-100.0) | 33.3 (0.0-100.0) | n.s. |
| Insomnia | 0.0 (0.0-100.0) | 33.3 (0.0-100.0) | n.s. |
| Appetite loss | 0.0 (0.0-100.0) | 66.7 (0.0-100.0) | <0.001 |
| Constipation | 0.0 (0.0-66.7) | 33.3 (0.0-100.0) | <0.001 |
| Diarrhoea | 0.0 (0.0-66.7) | 0.0 (0.0-33.3) | n.s. |
| Financial difficulties | 16.7 (0.0-100.0) | 0.0 (0.0-100.0) | n.s. |
QoL: Quality of Life; n.s.: not significant.
Analysing QoL from the QLQ-C30 stratified according to the stage of disease, we can observe that the differences do not reach statistical significance. However, the more advanced stages of disease are associated with a worse QoL, according to the global health status/QoL and functional scales. When symptoms were analysed, patients in group 2 had a lower proportion of symptoms like insomnia or similar proportion of symptoms (nausea and vomiting, pain, lack of appetite, constipation, diarrhoea and financial difficulties) when compared to patients in group 1.
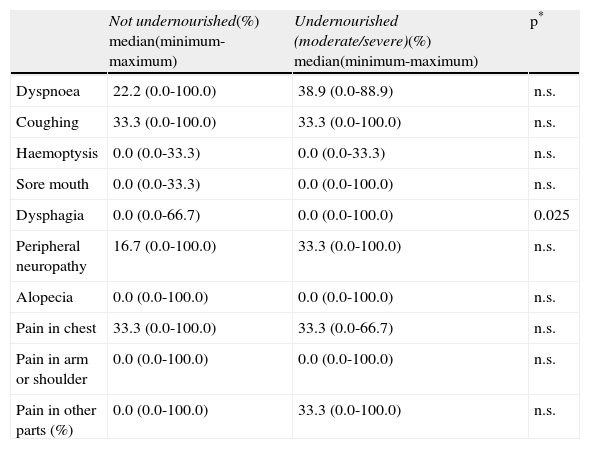
Analysing QoL evaluated by QLQ-LC13, after stratification by nutritional status, we can observe that undernourished patients presented dysphagia more often (p=0.025) (Table 3). No significant differences in any of the items considered were found when data was analysed according to stage of disease.
Evaluation of QoL by EORTC QLQ-LC13, according to PG-SGA.
| Not undernourished(%) median(minimum-maximum) | Undernourished (moderate/severe)(%) median(minimum-maximum) | p* | |
| Dyspnoea | 22.2 (0.0-100.0) | 38.9 (0.0-88.9) | n.s. |
| Coughing | 33.3 (0.0-100.0) | 33.3 (0.0-100.0) | n.s. |
| Haemoptysis | 0.0 (0.0-33.3) | 0.0 (0.0-33.3) | n.s. |
| Sore mouth | 0.0 (0.0-33.3) | 0.0 (0.0-100.0) | n.s. |
| Dysphagia | 0.0 (0.0-66.7) | 0.0 (0.0-100.0) | 0.025 |
| Peripheral neuropathy | 16.7 (0.0-100.0) | 33.3 (0.0-100.0) | n.s. |
| Alopecia | 0.0 (0.0-100.0) | 0.0 (0.0-100.0) | n.s. |
| Pain in chest | 33.3 (0.0-100.0) | 33.3 (0.0-66.7) | n.s. |
| Pain in arm or shoulder | 0.0 (0.0-100.0) | 0.0 (0.0-100.0) | n.s. |
| Pain in other parts (%) | 0.0 (0.0-100.0) | 33.3 (0.0-100.0) | n.s. |
n.s.: not significant.
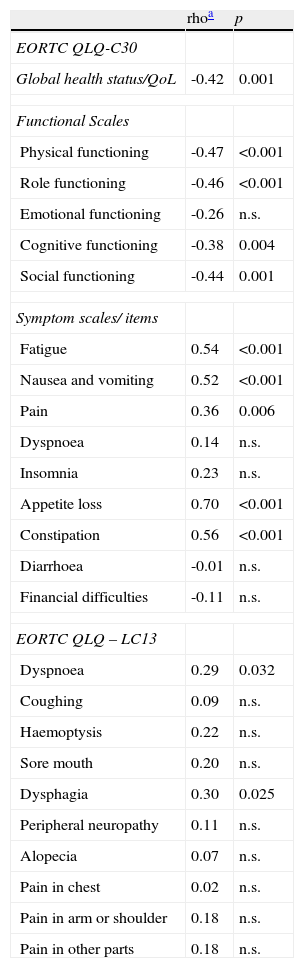
A significant association between undernutrition and the global health status/Qol was found for functional scales (except for emotional functioning), symptom scales/ items with the exception of dyspnoea, insomnia, diarrhoea and financial difficulties. Lack of appetite showed a high correlation with undernutrition (rho=0.7) and moderate correlations have been found between undernutrition and fatigue, nausea and vomiting and constipation (Table 4).
Association between QoL by EORTC QLQ-C30 and QLQ-LC13 and PG-SGA.
| rhoa | p | |
| EORTC QLQ-C30 | ||
| Global health status/QoL | -0.42 | 0.001 |
| Functional Scales | ||
| Physical functioning | -0.47 | <0.001 |
| Role functioning | -0.46 | <0.001 |
| Emotional functioning | -0.26 | n.s. |
| Cognitive functioning | -0.38 | 0.004 |
| Social functioning | -0.44 | 0.001 |
| Symptom scales/ items | ||
| Fatigue | 0.54 | <0.001 |
| Nausea and vomiting | 0.52 | <0.001 |
| Pain | 0.36 | 0.006 |
| Dyspnoea | 0.14 | n.s. |
| Insomnia | 0.23 | n.s. |
| Appetite loss | 0.70 | <0.001 |
| Constipation | 0.56 | <0.001 |
| Diarrhoea | -0.01 | n.s. |
| Financial difficulties | -0.11 | n.s. |
| EORTC QLQ – LC13 | ||
| Dyspnoea | 0.29 | 0.032 |
| Coughing | 0.09 | n.s. |
| Haemoptysis | 0.22 | n.s. |
| Sore mouth | 0.20 | n.s. |
| Dysphagia | 0.30 | 0.025 |
| Peripheral neuropathy | 0.11 | n.s. |
| Alopecia | 0.07 | n.s. |
| Pain in chest | 0.02 | n.s. |
| Pain in arm or shoulder | 0.18 | n.s. |
| Pain in other parts | 0.18 | n.s. |
Regarding the association between QoL (evaluated by QLQ LC-13) and undernutrition only a weak association with statistical significance between dyspnoea and dysphagia and the PG – SGA was found (Table 4).
DiscussionPatients with NSCLC have a high frequency of undernutrition in advanced stages of disease and undernutrition is associated with worse QoL. Twenty patients (35.7%) were at risk of undernutrition or undernourished.
No differences were found for QoL by stage disease. However, analysing QoL stratified according to nutritional status differences in various parameters were identified. As expected, undernourished patients have a worse global health status/QoL, as well as worse physical role, emotional and social functioning and more symptoms than patients without undernutrition. A high correlation with the lack of appetite, and a moderate correlation with fatigue, nausea and vomiting, constipation and undernutrition were found.
These results are in line with those which have shown a worse QoL in undernourished patients with various cancer diagnosis. Ovesen et al.19, in a study with 104 patients with small cell lung cancer, breast cancer or ovarian cancer, observed that patients with a moderate weight loss had more psychological stress and worse QoL. Andreyev et al.20 observed in 1555 patients with esophageal, gastric, pancreatic or colo-rectal cancer that weight loss had a significant impairment in QoL. Ravasco et al.21, in 271 patients with head, neck, esophageal, gastric or colo-rectal carcinoma, reported that weight loss and reduced energy and protein intake were associated with a worse QoL. Gupta et al.22 in a study with 58 patients diagnosed with colorectal cancer, showed that patients without undernutrition had better QoL. Nourissat et al.23, in 907 patients with colo-rectal, stomach, liver, oesophageal, ovarian, pancreatic, lung, prostate, breast, cervical or bladder cancer, identified an association between weight loss and worse QoL.
This study has several strengths. Patients included are only from one center, allowing a more homogeneous sample. Since different types of cancer and different histological types have different behaviors, we restricted the sample to a single sub histological type of lung cancer (NSCLC) in order to increase homogeneity.
To characterize the nutritional status, we used a validated instrument in order to achieve a more correct and detailed description. PG-SGA is the reference method used to assess nutritional status in cancer and it is recognized by the Oncology Nutrition Dietetic Group of the American Dietetic Association as the reference method of nutritional assessment for cancer patients.10 This choice is a step forward compared to previous studies evaluating nutritional status in cancer patients, which defined undernutrition only by weight loss .19–21,23
All data was collected by the same researcher limiting the possibility of inter-observer variation. Demographic characteristics such as age and gender are comparable to characteristics previously found in a study realized by the Working Committee of Lung Cancer of the Portuguese Society of Pneumology.24
The transversal design of this study is a weakness, limiting the study of a causal relation. Also, the reduced sample size does not allow a multivariate analysis approach to evaluate the association of undernutrition with QoL independently of other factors related to these conditions, such as the stage of disease, side effects of ongoing treatment and outcome of treatment. The low number of observations in some strata could have increased the possibility of type II errors, due to the lack of statistical power. A high proportion of the sample was not evaluated immediately after the diagnosis, and, at the time or evaluation, had had or were having under various therapeutic options which could have led to higher frequencies of undernutrition. This is a heterogeneous sample including patients at very different stages of the evolution of the disease. However, this sample is typical of the patients being treated in a health care unit of this kind.
In summary, patients with NSCLC have a high frequency of undernutrition in advanced stages of disease (early stages of disease: 1.8% vs. advanced stages of disease: 33.9%). Undernourished patients present a worse global health status/QoL, physical, role, emotional and social functioning. They also present more symptoms, including fatigue, nausea and vomiting, pain, insomnia, appetite loss and dysphagia. Undernutrition is associated with worse QoL, specifically: appetite loss, fatigue, nausea and vomiting and constipation. These results present a first approach to this issue which highlights the importance of nutritional status and QoL of NSCLC patients, since these parameters can be often modified when detected early and properly evaluated.
Conflicts of interestThe authors declare they have no conflicts of interest.
Please cite this article as: Xará S, et al. Desnutri¸cão e Qualidade de Vida em Doentes com Cancro do Pulmão Não Pequenas Células. Rev Port Pneumol. 2011; 17: 153–158.


