Journal Information
Vol. 28. Issue 2.
Pages 148-151 (March - April 2022)
Share
Share
Download PDF
More article options
Vol. 28. Issue 2.
Pages 148-151 (March - April 2022)
Letter to the Editor
Open Access
Lung function and ventilatory response to exercise in asymptomatic elite soccer players positive for COVID-19
Visits
7187
A. Di Pacoa, S. Mazzolenib, M. Vitaccac,
Corresponding author
michele.vitacca@icsmaugeri.it

Correspondence author at: Istituti Clinici Scientifici Maugeri IRCCS, Respiratory Rehabilitation of the Institute of Lumezzane, Brescia, Italy.
, L. Cominid, N. Ambrosinoe
a Lung Unit, Casa di Cura San Rossore, Pisa, Italy
b Department of Electrical and Information Engineering, Politecnico di Bari, Bari, Italy
c Respiratory Rehabilitation of the Institute of Lumezzane, Istituti Clinici Scientifici Maugeri IRCCS, Lumezzane, Brescia, Italy
d Scientific Direction of the Institute of Lumezzane, Istituti Clinici Scientifici Maugeri IRCCS, Lumezzane, Brescia, Italy
e Respiratory Rehabilitation of the Institute of Montescano, Istituti Clinici Scientifici Maugeri IRCCS, Montescano, Pavia, Italy
This item has received

Under a Creative Commons license
Article information
Full Text
Bibliography
Download PDF
Statistics
Tables (2)
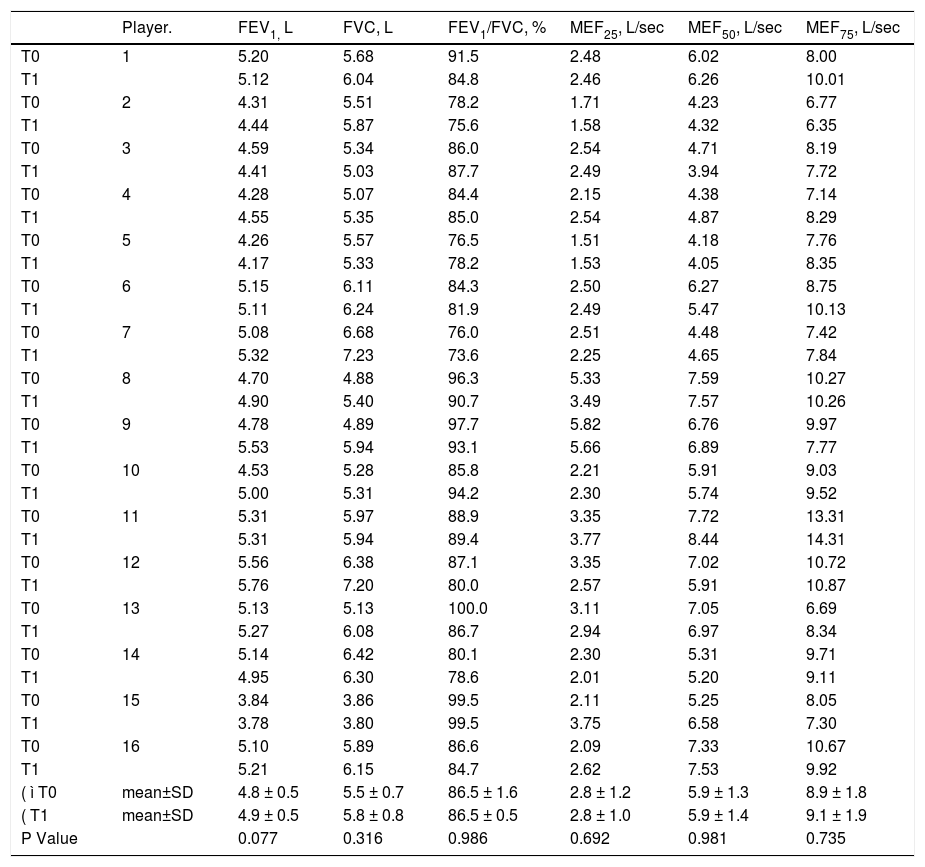
Table 1. Individual and mean data of lung function.
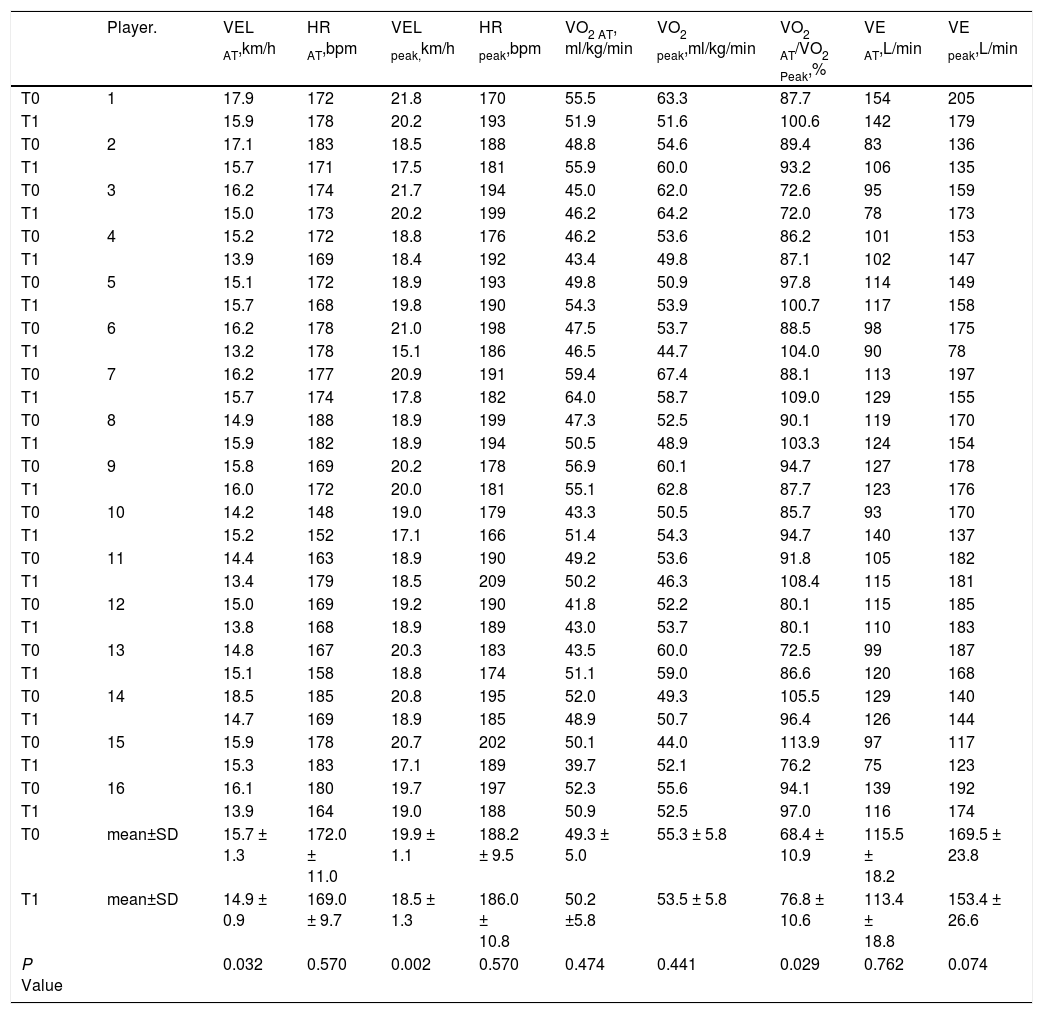
Table 2. Individual and mean data of exercise test.
Show moreShow less
Full Text
Dear Editor

Individuals recovering from SARS-CoV-2 (COVID-19) infection1 show impaired lung function, particularly diffusion capacity (DLCO).2 In addition, high prevalence of muscle weakness and impairment in physical performance have been reported in individuals without any prior motor limitations.3,4 While data report cardiac injury among professionals athletes,5-7 less is known about the potential damage to lung function and ventilatory response to exercise in asymptomatic elite athletes. Soccer is a highly physiologically demanding sport, with additional stress resulting from frequent matches and high load training sessions, ventilatory parameters playing a role in performance.8,9

In asymptomatic professional soccer players, we retrospectively report data of lung function and cardiopulmonary exercise tests after return to negativity to nasal/throat swabs for COVID-19 by polymerase chain reaction. We compare the findings with data of evaluations before the start of the sport season for license to professional activity.

The study was approved by the Ethical Committee of ICS Maugeri (2515 CE, February 9th, 2021) and participants signed the informed consent for the scientific use of their data.

Players underwent daily swabs to assess return to Covid negative. Before the sport season (T0) and the day immediately after return to Covid negative (T1: 14.3±5.4 days from testing positive), participants underwent flow-volume curve and cardiopulmonary incremental exercise test on treadmill according to standards 8,9 to be permitted to resume activity. Researchers performing analysis of data but not those performing assessments were blind to players’ identity.

Data are shown as mean ± standard deviation (SD). A Student's t-test was carried out for differences between T1 and T0. In case of failure of normality test, a Mann-Whitney Rank Sum test was performed. Linear regressions between days of Covid positive and velocity at peak exercise (VELpeak) and velocity at anaerobic threshold (VELAT) respectively, were also computed. A p value <0.05 was considered as statistically significant.

Sixteen players (22.9 ± 4.5 years; Body-Mass Index: 23.4 ± 1.9 Kg/m2) from three teams were evaluated: as expected, none reported smoking habit or any relevant disease, with negative chest physical examination. After comprehensive evaluation, including cardiological tests, all players could return to sport professional activity.

As compared to T0, at T1 there was no significant reduction in dynamic lung volumes (Table 1). However, players showed a significant mean reduction in VELpeak and VELAT, with a significant increase in oxygen consumption at anaerobic threshold to peak oxygen consumption ratio (Table 2). There was no significant correlation between days when Covid positive and T1-T0 changes in VELpeak or VELAT.

Table 1.

Individual and mean data of lung function.

  Player.  FEV1,FVC, L  FEV1/FVC, %  MEF25, L/sec  MEF50, L/sec  MEF75, L/sec 
T0  5.20  5.68  91.5  2.48  6.02  8.00 
T1    5.12  6.04  84.8  2.46  6.26  10.01 
T0  4.31  5.51  78.2  1.71  4.23  6.77 
T1    4.44  5.87  75.6  1.58  4.32  6.35 
T0  4.59  5.34  86.0  2.54  4.71  8.19 
T1    4.41  5.03  87.7  2.49  3.94  7.72 
T0  4.28  5.07  84.4  2.15  4.38  7.14 
T1    4.55  5.35  85.0  2.54  4.87  8.29 
T0  4.26  5.57  76.5  1.51  4.18  7.76 
T1    4.17  5.33  78.2  1.53  4.05  8.35 
T0  5.15  6.11  84.3  2.50  6.27  8.75 
T1    5.11  6.24  81.9  2.49  5.47  10.13 
T0  5.08  6.68  76.0  2.51  4.48  7.42 
T1    5.32  7.23  73.6  2.25  4.65  7.84 
T0  4.70  4.88  96.3  5.33  7.59  10.27 
T1    4.90  5.40  90.7  3.49  7.57  10.26 
T0  4.78  4.89  97.7  5.82  6.76  9.97 
T1    5.53  5.94  93.1  5.66  6.89  7.77 
T0  10  4.53  5.28  85.8  2.21  5.91  9.03 
T1    5.00  5.31  94.2  2.30  5.74  9.52 
T0  11  5.31  5.97  88.9  3.35  7.72  13.31 
T1    5.31  5.94  89.4  3.77  8.44  14.31 
T0  12  5.56  6.38  87.1  3.35  7.02  10.72 
T1    5.76  7.20  80.0  2.57  5.91  10.87 
T0  13  5.13  5.13  100.0  3.11  7.05  6.69 
T1    5.27  6.08  86.7  2.94  6.97  8.34 
T0  14  5.14  6.42  80.1  2.30  5.31  9.71 
T1    4.95  6.30  78.6  2.01  5.20  9.11 
T0  15  3.84  3.86  99.5  2.11  5.25  8.05 
T1    3.78  3.80  99.5  3.75  6.58  7.30 
T0  16  5.10  5.89  86.6  2.09  7.33  10.67 
T1    5.21  6.15  84.7  2.62  7.53  9.92 
( ì T0  mean±SD  4.8 ± 0.5  5.5 ± 0.7  86.5 ± 1.6  2.8 ± 1.2  5.9 ± 1.3  8.9 ± 1.8 
( T1  mean±SD  4.9 ± 0.5  5.8 ± 0.8  86.5 ± 0.5  2.8 ± 1.0  5.9 ± 1.4  9.1 ± 1.9 
P Value    0.077  0.316  0.986  0.692  0.981  0.735 

Abbreviations. FEV1, Forced Expiratory Volume at 1 second; FVC, Forced Vital Capacity; MEF75, maximal expiratory flow at 75% of FVC; MEF50, Maximal Expiratory Flow at 50% of FVC; MEF25, Maximal Expiratory Flow at 25% of FVC.

Table 2.

Individual and mean data of exercise test.

  Player.  VEL AT,km/h  HR AT,bpm  VEL peak,km/h  HR peak,bpm  VO2 AT, ml/kg/min  VO2 peak,ml/kg/min  VO2 AT/VO2 Peak,%  VE AT,L/min  VE peak,L/min 
T0  17.9  172  21.8  170  55.5  63.3  87.7  154  205 
T1    15.9  178  20.2  193  51.9  51.6  100.6  142  179 
T0  17.1  183  18.5  188  48.8  54.6  89.4  83  136 
T1    15.7  171  17.5  181  55.9  60.0  93.2  106  135 
T0  16.2  174  21.7  194  45.0  62.0  72.6  95  159 
T1    15.0  173  20.2  199  46.2  64.2  72.0  78  173 
T0  15.2  172  18.8  176  46.2  53.6  86.2  101  153 
T1    13.9  169  18.4  192  43.4  49.8  87.1  102  147 
T0  15.1  172  18.9  193  49.8  50.9  97.8  114  149 
T1    15.7  168  19.8  190  54.3  53.9  100.7  117  158 
T0  16.2  178  21.0  198  47.5  53.7  88.5  98  175 
T1    13.2  178  15.1  186  46.5  44.7  104.0  90  78 
T0  16.2  177  20.9  191  59.4  67.4  88.1  113  197 
T1    15.7  174  17.8  182  64.0  58.7  109.0  129  155 
T0  14.9  188  18.9  199  47.3  52.5  90.1  119  170 
T1    15.9  182  18.9  194  50.5  48.9  103.3  124  154 
T0  15.8  169  20.2  178  56.9  60.1  94.7  127  178 
T1    16.0  172  20.0  181  55.1  62.8  87.7  123  176 
T0  10  14.2  148  19.0  179  43.3  50.5  85.7  93  170 
T1    15.2  152  17.1  166  51.4  54.3  94.7  140  137 
T0  11  14.4  163  18.9  190  49.2  53.6  91.8  105  182 
T1    13.4  179  18.5  209  50.2  46.3  108.4  115  181 
T0  12  15.0  169  19.2  190  41.8  52.2  80.1  115  185 
T1    13.8  168  18.9  189  43.0  53.7  80.1  110  183 
T0  13  14.8  167  20.3  183  43.5  60.0  72.5  99  187 
T1    15.1  158  18.8  174  51.1  59.0  86.6  120  168 
T0  14  18.5  185  20.8  195  52.0  49.3  105.5  129  140 
T1    14.7  169  18.9  185  48.9  50.7  96.4  126  144 
T0  15  15.9  178  20.7  202  50.1  44.0  113.9  97  117 
T1    15.3  183  17.1  189  39.7  52.1  76.2  75  123 
T0  16  16.1  180  19.7  197  52.3  55.6  94.1  139  192 
T1    13.9  164  19.0  188  50.9  52.5  97.0  116  174 
T0  mean±SD  15.7 ± 1.3  172.0 ± 11.0  19.9 ± 1.1  188.2 ± 9.5  49.3 ± 5.0  55.3 ± 5.8  68.4 ± 10.9  115.5 ± 18.2  169.5 ± 23.8 
T1  mean±SD  14.9 ± 0.9  169.0 ± 9.7  18.5 ± 1.3  186.0 ± 10.8  50.2 ±5.8  53.5 ± 5.8  76.8 ± 10.6  113.4 ± 18.8  153.4 ± 26.6 
P Value    0.032  0.570  0.002  0.570  0.474  0.441  0.029  0.762  0.074 

Abbreviations. VELAT, exercise velocity at anaerobic threshold; HRAT, heart rate at anaerobic threshold; VEL peak: velocity at peak exercise; HRpeak, heart rate at peak exercise; VO2 AT, oxygen consumption at anaerobic threshold; VO2peak, oxygen consumption at peak exercise; VEAT, Minute Ventilation at anaerobic threshold; VEpeak, minute ventilation at peak exercise.

We have no data for immediately before infection, therefore we had to compare data after return to Covid negative with pre sport season evaluation. It has been reported that a competitive season improves ventilatory profile response to exercise in elite athletes.9 Therefore, we may argue that after the prolonged period of training and competitions performed before pandemic, the physical performance of our players would have been higher than at T0, and as a consequence the differences with post return to Covid negative even greater.

What could be the cause of reduced physical performance in these individuals? It may be argued that rest and lack of training due to imposed quarantine (at least while Covid positive) may have influenced results. However, there was no significant correlation between days when Covid positive (and rest) and reduction in exercise velocity. In addition, due to the lack of assessment of DLCO we cannot exclude any lung involvement beyond dynamic lung volumes.

We were unable to report any data of cardiac function. However, we know that all these players were allowed to return to their activity after cardiological evaluation. A large screening has reported a 3.8% prevalence of abnormalities in cardiologic screening of professional athletes 19±17 days after a positive test.6 In another study 2.3% of athletes with recent infection were diagnosed with clinical and subclinical myocarditis.7 Our study seems to suggest the importance of assessing lung function in the comprehensive evaluation of elite athletes.

Our study has the limitations of the small sample size and the flaws of a retrospective design like the lack of assessment of DLCO (or a chest CT scan), respiratory or peripheral muscle function and the lack of cardiological data.

In conclusion, with the above limitations, this study suggests that reduction in exercise performance in professional soccer players after return to negativity for COVID-19 is not associated with a reduction in dynamic lung volumes. Despite the relatively small sample size and the possible lack of external validity of these results, our findings may be useful for guiding sport medical supervisors of these players. Our study indicates also the need to assess lung function for a full evaluation of these individuals. However, to exclude any potential lung involvement, assessment also of DLCO should be mandatory.

Funding information

This work was partly supported by the “Ricerca Corrente” funding scheme of the Italian Ministry of Health.

References
[1]
JC Winck, N. Ambrosino.
COVID-19 pandemic and non invasive respiratory management: every goliath needs a david. An evidence based evaluation of problems.
Pulmonology, 26 (2020), pp. 213-220
[2]
R Torres-Castro, L Vasconcello-Castillo, X Alsina-Restoy, et al.
Respiratory function in patients post-infection by COVID-19: a systematic review and meta-analysis.
Pulmonology, 27 (2021), pp. 328-337
[3]
C Simonelli, M Paneroni, M Vitacca, N. Ambrosino.
Measures of physical performance in COVID-19 patients: a mapping review.
Pulmonology, 27 (2021), pp. 518-528
[4]
M Paneroni, C Simonelli, M Saleri, et al.
Muscle strength and physical performance in patients without previous disabilities recovering from COVID-19 pneumonia.
Am J Phys Med Rehabil, 100 (2021), pp. 105-109
[5]
SF Gervasi, L Pengue, L Damato, et al.
Is extensive cardiopulmonary screening useful in athletes with previous asymptomatic or mild SARS-CoV-2 infection?.
Br J Sports Med, 55 (2021), pp. 54-61
[6]
MW Martinez, AM Tucker, OJ Bloom, et al.
Prevalence of inflammatory heart disease among professional athletes with prior COVID-19 infection who received systematic return-to-play cardiac screening.
JAMA Cardiol, 6 (2021), pp. 745-752
[7]
Daniels CJ, Rajpal S, Greenshields JT, et al. Prevalence of clinical and subclinical myocarditis in competitive athletes with recent SARS-CoV-2 infection: results from the big ten COVID-19 cardiac registry. JAMA Cardiol. 2021;6:1078-1087. Doi 10.1001/jamacardio.2021.2065
[8]
A Di Paco, GA Catapano, G Vagheggini, S Mazzoleni, ML Micheli, N. Ambrosino.
Ventilatory response to exercise of elite soccer players.
Multidiscip Respir Med, 9 (2014), pp. 20
[9]
A Di Paco, BP Dubé, P. Laveneziana.
Changes in ventilatory response to exercise in trained athletes: respiratory physiological benefits beyond cardiovascular performance.
Arch Bronconeumol, 53 (2017), pp. 237-244
Download PDF
Pulmonology
Article options
Tools

Are you a health professional able to prescribe or dispense drugs?