


The six-minute walk test (6MWT) is a practical and simple field-based test to assess physical capacity. Several reference equations for six-minute walking distance (6MWD, m) exist, but have a number of limitations that decrease their clinical utility. In addition, no reference equations exist for the 6MWT-derived outcome six-minute walk work (6MWORK, kg.m).
ObjectivesTo establish new reference equations for 6MWD and 6MWORK on a 20 m course using data from the population-based Canadian Cohort Obstructive Lung Disease study.
Methods and MeasurementsA total of 335 participants without obstructive or restrictive pulmonary function, with normal self-reported health status, normal exercise capacity, and <30 pack years cigarette smoking history were selected to create a representative sample of Canadian adults aged ≥40 years. All participants performed two 6MWTs. Reference equations were derived using multiple regression analyses.
Main ResultsOn average, 6MWD and 6MWORK were 541±98 m and 41.3 ± 11.2 kg.m, respectively. All outcomes were significantly greater in males than females. Sex-specific reference equations were derived from the results of 6MWD and 6MWORK with an explained variance of 24 to 35%.
ConclusionsThis study established reference equations for 6MWD and 6MWORK on a 20 m course in Caucasian males and females aged ≥40 years with normal pulmonary function, self-reported health status and exercise capacity. These newly derived reference equations add value to the assessment of functional capacity in clinical practice.
Physical capacity is often abnormally low in people with non-communicable chronic diseases, such as chronic obstructive pulmonary disease (COPD), asthma, interstitial lung disease (ILD), heart failure (HF), or pulmonary arterial hypertension (PAH).1-12 Because physical capacity cannot be derived accurately from metrics of disease severity (e.g., forced expiratory volume in 1‑sec (FEV1) or left ventricular ejection fraction), exercise tests are needed to assess a person's physical capacity.1-11,13
The six-minute walk test (6MWT) is a practical and simple field-based exercise test that does not require specialized equipment or advanced training, and is widely used in clinical practice and research to assess physical capacity in patients with chronic diseases.14,15 During the 6MWT, participants walk as far as possible in six minutes on a pre-determined course.15 The recommended minimum course length is 30 m,14 however in many care settings performing the 6MWT in a 30 m hallway is not feasible due to space limitations. Instead, a 20 m course length is often used to perform the 6MWT.16 The main outcome, the distance walked in six minutes (6MWD, m), is associated with prognosis in various chronic conditions (e.g., COPD, ILD, HF, PAH) and responsive to both pharmacological and non-pharmacological interventions.9,11,17-20 Additionally, the six-minute walk work (6MWORK, kg.m; defined as the product of 6MWD in metres and body mass in kilograms) can be derived from the 6MWT.21,22 This 6MWT-derived outcome may be of additional clinical importance in patient groups where overweight-obesity may play a role in exercise limitation, and demonstrate prognostic value in people with COPD.21
To enable interpretation of 6MWD, this outcome can be compared with published reference values, which typically consider age, sex, height and/or body mass.23 This facilitates the assessment of the level of impairment of physical capacity compared to a reference population. Furthermore, using reference equations combined with a lower limit of normal (LLN) can help differentiate between normal variation in outcomes and abnormally low outcome results. Existing studies reporting reference values for 6MWD have several limitations that decrease their clinical utility, namely: (1) the number of participants was small in the majority of studies (median: 109; 67% of studies had a sample size <200 participants24-29); (2) there is ambiguity with regard to participant recruitment24,25,27-29; (3) very limited information was provided on participant characteristics24,25,30; (4) there is considerable variation in the reported reference formulas24-32 and (5) only a few reference equations for 6MWD on a 20 m course exist.28 Moreover, reference values for 6MWORK have never been established. Therefore, the current analyses aimed to establish new reference equations for 6MWD and 6MWORK for a 20 m course using unique data from the Canadian Cohort Obstructive Lung Disease (CanCOLD) study,33 a population-based cohort study in which random sampling was used to recruit participants aged ≥40 years. In addition, we sought to compare our new reference equations for 6MWD to earlier published reference equations.
MethodsStudy design and participantsFor this study, a subset of data from CanCOLD was used. The 6MWT was performed at the first follow-up assessment (CanCOLD visit 2, ∼18 months after the baseline visit) and comprises a subset of 1019 participants. Recruitment for visit 2 was not completed for the entire cohort. CanCOLD is a prospective, random sampled, population-based study conducted across nine sites in Canada (ClinicalTrials.gov Identifier: NCT00920348).33 Participants were noninstitutionalized males and females aged ≥40 years recruited by random telephone digit dialling. All participants provided written informed consent before completing study assessments. The research ethics board of each participating institution approved the study protocol.
Details on participant selection criteria for the current study are described in Fig. 1. Because of the limited number of non-Caucasian participants only Caucasian participants were selected for these analyses. Furthermore, participants were selected if they performed pulmonary function tests (PFT) (including post-bronchodilator spirometry and plethysmography), two 6MWTs, and had a peak rate of oxygen uptake (V'O2peak) on a symptom limited incremental cardiopulmonary cycle exercise test (CPET) between the 95% upper (ULN) and LLN values.34 Having an exercise capacity within normal predicted limits indicated that a participant's exercise tolerance was not limited by any ostensible health condition or any health hazards such as exposure to environmental tobacco smoke nor was there an abnormally high cardiorespiratory fitness, for instance resulting from intensive exercise training.

Participants were excluded from the analyses if: 1) their post-bronchodilator spirometry indicated an (reversible) airflow obstruction or abnormal pulmonary function according to Global Lung Function Initiative reference values35-37 (FEV1, forced vital capacity (FVC) or forced vital capacity (FVC) less than LLN, or total lung capacity (TLC) less than 80%-predicted or an increase in FEV1 or FVC >12% and >200 mL from baseline 10–15 min after bronchodilator administration. A full description of both pre- and post-bronchodilator PFT outcomes are described in Table 1); 2) they had a cigarette smoking history >30 pack years (PY) (based on a univariate regression analyses between different categories of PY, and an additional sensitivity analysis see online Table 3 and online Table 4); and/or 3) they reported clinically significant pulmonary symptoms based on Medical Research Council (MRC) scores (MRC score ≥3) or COPD Assessment Test (CAT) total scores (CAT score ≥95th percentile (ULN) based on age and sex).38
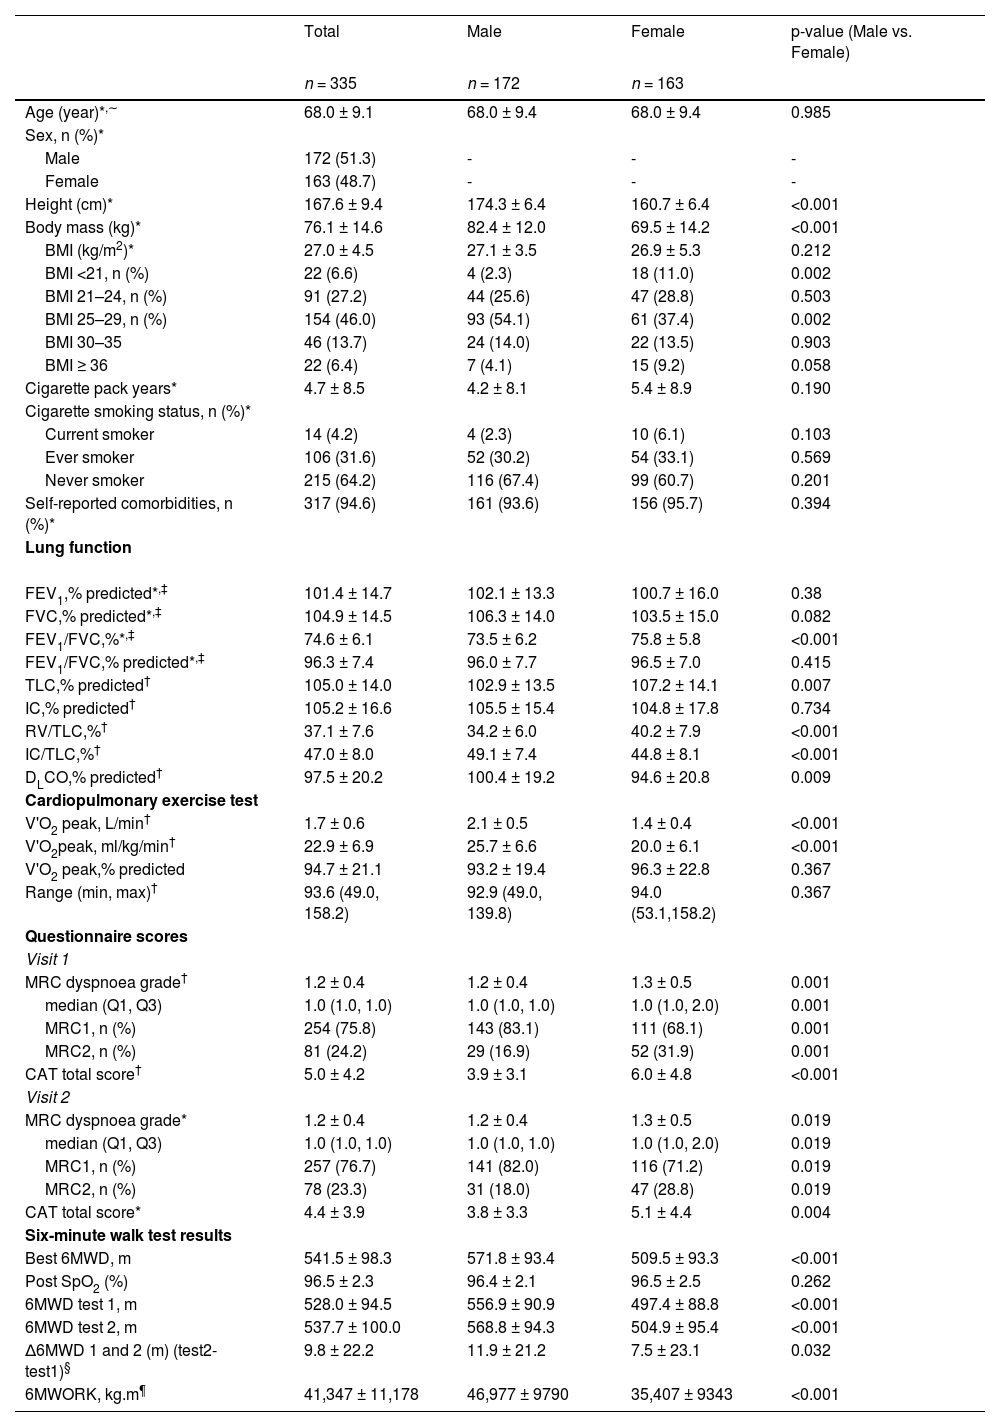
Participant characteristics.
| Total | Male | Female | p-value (Male vs. Female) | |
|---|---|---|---|---|
| n = 335 | n = 172 | n = 163 | ||
| Age (year)*,∼ | 68.0 ± 9.1 | 68.0 ± 9.4 | 68.0 ± 9.4 | 0.985 |
| Sex, n (%)* | ||||
| Male | 172 (51.3) | - | - | - |
| Female | 163 (48.7) | - | - | - |
| Height (cm)* | 167.6 ± 9.4 | 174.3 ± 6.4 | 160.7 ± 6.4 | <0.001 |
| Body mass (kg)* | 76.1 ± 14.6 | 82.4 ± 12.0 | 69.5 ± 14.2 | <0.001 |
| BMI (kg/m2)* | 27.0 ± 4.5 | 27.1 ± 3.5 | 26.9 ± 5.3 | 0.212 |
| BMI <21, n (%) | 22 (6.6) | 4 (2.3) | 18 (11.0) | 0.002 |
| BMI 21–24, n (%) | 91 (27.2) | 44 (25.6) | 47 (28.8) | 0.503 |
| BMI 25–29, n (%) | 154 (46.0) | 93 (54.1) | 61 (37.4) | 0.002 |
| BMI 30–35 | 46 (13.7) | 24 (14.0) | 22 (13.5) | 0.903 |
| BMI ≥ 36 | 22 (6.4) | 7 (4.1) | 15 (9.2) | 0.058 |
| Cigarette pack years* | 4.7 ± 8.5 | 4.2 ± 8.1 | 5.4 ± 8.9 | 0.190 |
| Cigarette smoking status, n (%)* | ||||
| Current smoker | 14 (4.2) | 4 (2.3) | 10 (6.1) | 0.103 |
| Ever smoker | 106 (31.6) | 52 (30.2) | 54 (33.1) | 0.569 |
| Never smoker | 215 (64.2) | 116 (67.4) | 99 (60.7) | 0.201 |
| Self-reported comorbidities, n (%)* | 317 (94.6) | 161 (93.6) | 156 (95.7) | 0.394 |
| Lung function | ||||
| FEV1,% predicted*,‡ | 101.4 ± 14.7 | 102.1 ± 13.3 | 100.7 ± 16.0 | 0.38 |
| FVC,% predicted*,‡ | 104.9 ± 14.5 | 106.3 ± 14.0 | 103.5 ± 15.0 | 0.082 |
| FEV1/FVC,%*,‡ | 74.6 ± 6.1 | 73.5 ± 6.2 | 75.8 ± 5.8 | <0.001 |
| FEV1/FVC,% predicted*,‡ | 96.3 ± 7.4 | 96.0 ± 7.7 | 96.5 ± 7.0 | 0.415 |
| TLC,% predicted† | 105.0 ± 14.0 | 102.9 ± 13.5 | 107.2 ± 14.1 | 0.007 |
| IC,% predicted† | 105.2 ± 16.6 | 105.5 ± 15.4 | 104.8 ± 17.8 | 0.734 |
| RV/TLC,%† | 37.1 ± 7.6 | 34.2 ± 6.0 | 40.2 ± 7.9 | <0.001 |
| IC/TLC,%† | 47.0 ± 8.0 | 49.1 ± 7.4 | 44.8 ± 8.1 | <0.001 |
| DLCO,% predicted† | 97.5 ± 20.2 | 100.4 ± 19.2 | 94.6 ± 20.8 | 0.009 |
| Cardiopulmonary exercise test | ||||
| V'O2 peak, L/min† | 1.7 ± 0.6 | 2.1 ± 0.5 | 1.4 ± 0.4 | <0.001 |
| V'O2peak, ml/kg/min† | 22.9 ± 6.9 | 25.7 ± 6.6 | 20.0 ± 6.1 | <0.001 |
| V'O2 peak,% predicted | 94.7 ± 21.1 | 93.2 ± 19.4 | 96.3 ± 22.8 | 0.367 |
| Range (min, max)† | 93.6 (49.0, 158.2) | 92.9 (49.0, 139.8) | 94.0 (53.1,158.2) | 0.367 |
| Questionnaire scores | ||||
| Visit 1 | ||||
| MRC dyspnoea grade† | 1.2 ± 0.4 | 1.2 ± 0.4 | 1.3 ± 0.5 | 0.001 |
| median (Q1, Q3) | 1.0 (1.0, 1.0) | 1.0 (1.0, 1.0) | 1.0 (1.0, 2.0) | 0.001 |
| MRC1, n (%) | 254 (75.8) | 143 (83.1) | 111 (68.1) | 0.001 |
| MRC2, n (%) | 81 (24.2) | 29 (16.9) | 52 (31.9) | 0.001 |
| CAT total score† | 5.0 ± 4.2 | 3.9 ± 3.1 | 6.0 ± 4.8 | <0.001 |
| Visit 2 | ||||
| MRC dyspnoea grade* | 1.2 ± 0.4 | 1.2 ± 0.4 | 1.3 ± 0.5 | 0.019 |
| median (Q1, Q3) | 1.0 (1.0, 1.0) | 1.0 (1.0, 1.0) | 1.0 (1.0, 2.0) | 0.019 |
| MRC1, n (%) | 257 (76.7) | 141 (82.0) | 116 (71.2) | 0.019 |
| MRC2, n (%) | 78 (23.3) | 31 (18.0) | 47 (28.8) | 0.019 |
| CAT total score* | 4.4 ± 3.9 | 3.8 ± 3.3 | 5.1 ± 4.4 | 0.004 |
| Six-minute walk test results | ||||
| Best 6MWD, m | 541.5 ± 98.3 | 571.8 ± 93.4 | 509.5 ± 93.3 | <0.001 |
| Post SpO2 (%) | 96.5 ± 2.3 | 96.4 ± 2.1 | 96.5 ± 2.5 | 0.262 |
| 6MWD test 1, m | 528.0 ± 94.5 | 556.9 ± 90.9 | 497.4 ± 88.8 | <0.001 |
| 6MWD test 2, m | 537.7 ± 100.0 | 568.8 ± 94.3 | 504.9 ± 95.4 | <0.001 |
| Δ6MWD 1 and 2 (m) (test2-test1)§ | 9.8 ± 22.2 | 11.9 ± 21.2 | 7.5 ± 23.1 | 0.032 |
| 6MWORK, kg.m¶ | 41,347 ± 11,178 | 46,977 ± 9790 | 35,407 ± 9343 | <0.001 |
Data are presented as mean ± SD unless otherwise specified.
Specifics on age distribution are presented in online table 1a; BMI: Body Mass Index; FEV1: Forced Expiratory Volume in the 1st second; FVC: Forced Vital Capacity; TLC: Total Lung Capacity; IC: Inspiratory Capacity; RV: Residual Volume; DLCO: Diffusion Capacity of the lungs for Carbon Monoxide; MRC: Medical Research Council dyspnoea scale; CAT: COPD Assessment Test; CPET: Cardiopulmonary Exercise Test; V`O2 peak: Peak oxygen consumption; Please see Online Tables 6 and 7 for more details on comorbidities and medication use, and Online Table 2 for more details on the PFT.
Values based on best 6MWD; SpO2: transcutaneous oxygen saturation; Results presented per decade of age are presented in Online Table 1b.
The data used in this study was collected during two time points. Both CPET and PFTs were performed during CanCOLD visit 1. During CanCOLD visit 2, conducted 18 months after visit 1, the 6MWTs were performed. At both visits, pulmonary symptoms were assessed using MRC and CAT. To ensure that no significant changes in pulmonary symptoms occurred in the time between CanCOLD visits 1 and 2, participants needed to report a MRC dyspnoea score <3 and CAT total score
At each visit, general participant characteristics were recorded, as well as previous and current health conditions.
Six-minute walk test (6MWT)Before the 6MWT, participants were screened for contraindications to exercise. The 6MWT was performed in a corridor, with two cones placed 20 m apart. Instructions were standardized, as per the American Thoracic Society's (ATS) guidelines for the 6MWT.14 Participants were asked to walk as far as possible in six minutes by walking back and forth from one cone to another. During the test, standard encouragement was given each minute. SpO2 was measured before, during and after the 6MWT (Masimo Pulse Oximeter, Masimo Corporations, California, USA). A second 6MWT was performed 15 min after the first. 6MWD was recorded after each 6MWT. The best 6MWD was used for analysis. Any adverse events that occurred were recorded (Online supplement Table 6).
6MWORK (kg.m) was calculated as the product of the best 6MWD in metres and body mass in kilograms. Body mass was measured using a digital scale or balance beam after participants emptied their bladder and removed their shoes, hat, coat, and/or heavy items from inside their pockets.
Peak rate of oxygen consumptionBreath-by-breath measurements of V'O2 averaged over the last 30‑sec of loaded pedalling during the CPET were used to define V'O2peak. A full description of the CPET protocol used in CanCOLD has been previously described.34
Statistical analysesData distribution was assessed with the Shapiro-Wilke test. Between-group differences were assessed using Chi-square or Fisher-exact tests for categorical variables, and T-tests or Mann Whitney U tests as appropriate for continuous variables.
The cut-off value for PY was determined by a univariate regression analysis between different categories of PY. An additional sensitivity analysis was performed to determine the effect of a lower cut-off value for PY on the results of the univariate regression analyses.
To derive reference equations, univariate regression analyses and multivariate stepwise regression analyses were performed after confirming all assumptions were met. Age, height and body mass (as applicable) were used as predictor variables and 6MWD and 6MWORK as outcome variables. All predictors were included in the final model based on their magnitude (β), significance and physiological impact (r2) on the outcomes.15 Separate reference equations were created for males and females.
For each reference equation, the root mean square error (RMSE or standard deviation of the residuals) was calculated and used as an indicator of the data around the regression line. In order to assess the difference between observed and predicted data, the mean absolute error (MAE) was calculated. The lower limit of normal or 5th percentile (LLN), estimated as the predicted value minus 1.645 multiplied by the RMSE, was calculated to determine below which value the outcomes are regarded as being abnormally low. A Pearson correlation coefficient was calculated to assess the association between predicted and measured values. Finally, a comparison between existing24-31 and our new 6MWD reference equations was made by calculating reference values for all included reference equations using the characteristics from the CanCOLD participants used in our analyses. A priori, the level of significance was set at p<0.05. Statistical analyses were performed using SAS 9.4 (SAS institute, Cary, NC, USA).
ResultsParticipant characteristics1019 participants were screened for eligibility for the current analyses. A total of 335 participants (51% male, age: 68.0 ± 9.1 years) were included. Participants’ general characteristics are presented in Table 1 and Online Tables 6 and 7. On average, participants were overweight (body mass index: 27.0 ± 4.5 kg/m2), and had a V'O2peak (95±21%-predicted) and PFT outcomes within normal predicted limits (FEV1: 101±15%-predicted; FVC 105±15%-predicted; FEV1/FVC: 74±6%; TLC: 105±14%-predicted; and DLCO: 98±20%-predicted). On average, participants reported 4.7 ± 8.5 PY. Participant were similar to the general Canadian population ≥40 years with regards to body mass and height (Mean body mass: Canadian population: 86.5 kg (men), 73.7 kg (women)39 vs included participants: 82.4 kg (men), 69.5 kg (women); mean height: Canadian population: 174.4 cm (men), 161.2 cm (women)39 vs included participants 174.3 cm (men), 160.7 cm (women)). Self-reported health conditions were present in ∼95% of the participants. A full description of the participant's self-reported health conditions and medication use is described in Online Tables 7 and 8.
6MWT outcomesOn average, 6MWD and 6MWORK were 541±98 m and 41.3 ± 11.2 kg.m, respectively. All outcomes were significantly greater in males than females (Table 1).
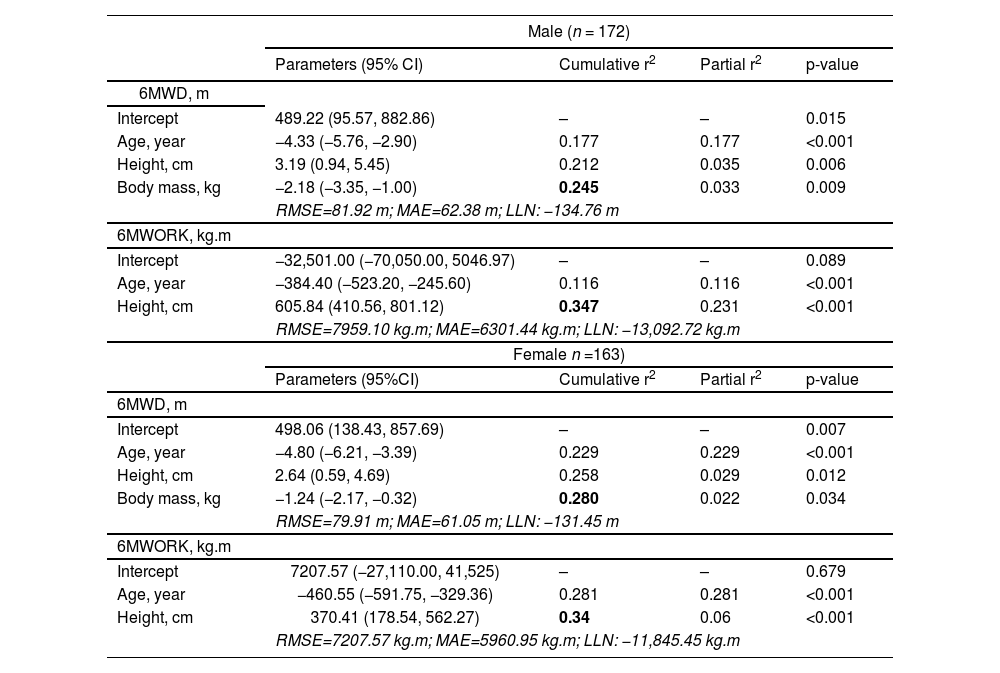
Reference equationsThe univariate regression analysis showed significant associations between age, sex and height versus each of 6MWD and 6MWORK (Online Table 9). The association between body mass and 6MWD was not statistically significant. In the multivariate regression analysis, all predictor variables were significant (Table 2). The derived sex-specific reference equations are listed below: Reference equations for males:
- -
6MWD (m) =489.22–4.33*ageyrs+3.19*heightcm-2.18*body mass kg
- -
6MWORK (kg.m) =−32,501.0–384.40*ageyrs+605.84*heightcm
Multivariate stepwise regression analyses.
6MWD: Six-minute walking distance; 6MWORK: six-minute walk work; RMSE: Root Mean Square Error; MAE: Mean Absolute Error; LLN: Lower Limit of Normal.
Reference equations for females:
- -
6MWD (m) =498.06–4.80*ageyrs+2.64*heightcm-1.24*body mass kg
- -
6MWORK (kg.m) =7207.57–460.55*ageyrs+370.41*heightcm
Even though it is recommended to perform two 6MWT's,14 in clinical practice it may not be possible to perform two 6MWT's and subsequently use the best of the two tests as the final outcome measure. This is why the results of the regression analysis and reference equations based on the first 6MWT are included in the online supplement (Online Table 5).
The online supplement also contains a spreadsheet to calculate predicted values.
The explained variance (cumulative r2) of the multiple regression model ranged from 0.24 to 0.35. Pearson correlations (r, presented in Fig. 2) between predicted and observed values for 6MWD and 6MWORK varied between 0.495 and 0.589 and were all statistically significant (p<0.001). Bland Altman plots of observed and predicted values are presented in Online Fig. 1.
 and six-minute walk work (6MWORK; Panels C&D).")
Fig. 3 shows the predicted 6MWD based of the newly derived 6MWD reference equations, both based on the best test and based on the first test, compared to results from other reference equations,24-32 using data from the CanCOLD dataset (n = 346). The line representing the CanCOLD predicted 6MWDs is within the range of the lines generated from the other prediction equations.24-31 Compared to Enright et al.31 and Enright & Sherrill,30 the newly developed equation's predicted 6MWD values are consistently higher except for the youngest males in the sample. In contrast, the newly developed equation's predicted 6MWD values are consistently lower than those predicted using the equations of Troosters et al.,29 Hill et al.,25 Gibbons et al.28 and Jenkins.26 The equations of Chetta et al.27 are mostly below the newly derived predicted 6MWD, but both lines presenting the predicted 6MWDs cross each other in the older participants. The reference values based on Cazzoletti et al.32 are very close to the CanCOLD reference values for both genders, especially in the men aged 75 years or older and women aged 75 years or younger, while the equations of Beekman et al.24 show a different pattern for males and females. Whereas the line of the predicted values for females is consistently close to the line of the newly derived predicted values, the predicted 6MWD for males crosses the line of the CanCOLD derived predicted 6MWD around the age of 70 years. Younger participants have higher predicted values and older participants have lower predicted values compared to the CanCOLD reference values.
Discussion to existing reference equations.")
This is the first study to generate prediction equations for 6MWD and 6MWORK on a 20 m course for Caucasian males and females separately, based on 6MWT results from a population-based cohort of people aged ≥40 years with normal pulmonary function and exercise capacity determined by a symptom limited incremental CPET. In addition, we have established the first reference equations for 6MWORK. 6MWORK has shown its value in different patient populations.21,22,40 For example, in people with COPD, 6MWORK was identified as a predictor of hospitalization21 and was better correlated to DLCO than 6MWD. Furthermore, 6MWORK has demonstrated a high relationship to V'O2 and peak O2 pulse in people with pulmonary vascular disease. The use of prediction equations for 6MWORK may help healthcare providers better interpret the results of an individual's 6MWT and also improve implementation of this outcome variable into clinical practice.
Our newly derived references equations were generated using data from a well characterised and relatively large random sample of males and females aged ≥40 years that completed two 6MWTs according to ATS guidelines, with the exception of the recommended course length.14 The 20 m course length was chosen to standardize the test across all sites, since some study sites were unable to use a 30 m course length due to limited space. Comparing the different available reference equations for 6MWD to our newly derived reference equation is difficult, since a combination of factors could explain the differences (e.g., different course lengths, protocols, populations and sample sizes). However, the predicted 6MWD based on the commonly used reference equation of Enright and Sherrill30 is below the predicted 6MWD value calculated using the best-test CanCOLD-based reference equations, across all ages. This difference may in part be due to the fact that participants in Enright and Sherrill's30 study only performed one 6MWT, since it is well known that a learning effect exists for the 6MWT and therefore multiple tests are recommended to adequately assess an individual's functional exercise performance.15 This is also demonstrated by the fact that the first-test CanCOLD based reference equations approach and partly overlap Enright and Sherril's values. However, since the size of this learning effect is variable across different studies41-45 and factors influencing the learning effect are still unclear, more studies are needed to assess the reproducibility of the 6MWT.
A lower predicted 6MWD value leads to a higher percentage of predicted 6MWD when interpreting 6MWT results. Participants with a 6MWD that equals, for example, 70% of the predicted value based on the newly derived reference equations, will have a substantially higher percentage of predicted value based on Enright and Sherrill's equations.30 Overestimation of physical capacity might lead to a misinterpretation of the influence that a chronic health condition has on an individual's physical capacity.
In contrast, the 6MWD values predicted using the reference equation of Troosters et al.,29 which is also commonly used, were greater than those predicted using the CanCOLD-derived reference equations across all ages. This may be due to the longer course length of 45 m, smaller sample size (n = 51) and/or influence of selection bias in Troosters and colleagues’ study,29 since no random sampling was used.
The explained variance of the newly derived reference equations ranged from 24 to 35%. These values fall within the previously reported explained variances for 6MWD reference equations (r2 range: 0.20–0.66)24-31 (Online Table 10). Even though the explained variance is modest, using reference equations that correct for factors that are known to affect the 6MWT (e.g., sex, height, weight and age) to calculate predicted values provides more valuable insights into the exercise capacity than only using the absolute outcome measures.
The correlation coefficients between the observed and predicted values of 6MWD and 6MWORK (Pearson's r: 0.495 to 0.589) demonstrate that the reference equations are a moderate fit with the observed data. The LLN-values indicate that males or females with a 6MWD ≥134 m or ≥130 m below the predicted reference value should be identified as having abnormally low exercise capacity, respectively.
Strengths and limitationsA clear strength of this study is the comprehensive assessment performed on CanCOLD participants, which provided us with a unique opportunity to identify a subset of adults with normal pulmonary function, normal self-reported health status, normal breathlessness, and V'O2peak on symptom limited incremental cycle CPET within normal predicted limits, where CPET is widely considered the gold-standard method of assessing exercise capacity.46 Next to this, care was taken in determining a valid cut-off value of ≤30 PY as inclusion criterion. Next to the univariate regression analysis assessing the effect of different categories of PY (Online Table 3), an additional sensitivity analysis was performed in which the multivariate stepwise regression analysis was repeated with data from participants with ≤5 PY. This analysis resulted in similar point estimates, indicating that the seemingly high cut-off value of >30 PY is valid (Online Table 4). Using these selection criteria instead of selecting participants based on the complete absence of comorbidities, has led to a unique and representative sample of the Canadian population of adults, aged ≥40 years. Since many Canadians suffer from comorbidities,47 the prediction equations developed in the current study are likely more relevant for use by healthcare providers in clinical practice.
The 6MWD is susceptible to a learning effect, which reaches a plateau after performing two tests within one week.14 All participants included in our analyses performed two 6MWTs in order to decrease the likelihood of a learning effect and ensure optimal performance.
While interpreting the results, some limitations need to be considered. All 6MWTs were performed on a 20 m course, whereas the ATS guidelines for the 6MWT recommend a 30 m course length.14 Several studies have investigated the effect of course length on 6MWD and the results are inconclusive. Significantly higher distances in 30 m courses compared to 20 m courses were found in healthy adults,48 patients with COPD49,50 and individuals with stroke.51 In addition, Beekman et al.52 found a significant effect of a 10 m versus 30 m course length on 6MWD. In contrast, Veloso-Guedes et al.53 and Sciurba et al.42 found no significant effect of course length on 6MWD in patients with liver cirrhosis and patients with COPD, respectively. In addition, the European Respiratory Society/ATS technical standard report for field walking tests in people with chronic respiratory disease15 indicated that for course lengths >15 m, differences in 6MWD may be small enough such that 6MWTs performed on courses of different lengths can still be used for risk stratification. However, based on the above-mentioned studies it is recommended to use course length-specific reference equations.
Even though all participants included in our analyses had a V'O2peak on symptom limited incremental cycle CPET within normal predicted limits, it is nevertheless possible that comorbidities or other factors (e.g., intermittent claudication (reported by one participant), motivation or weather conditions) may have led to a suboptimal performance during the 6MWT despite V'O2peak being within normal predicted limits.
The CPET and 6MWTs were performed 18 months apart, during which time the health status and functional capacity of our participants might have changed. However, we mitigated the risk of clinically meaningful changes in physical capacity by including only participants with normal self-reported ratings of respiratory health status and activity-related breathlessness at both CanCOLD Visits 1 and 2.
Although the sample is representative of the Canadian population aged ≥40 years, the majority of participants was 50–80 years old (86%). Reference values may be less accurate for adults <50 and >80 years old.15,30
ConclusionsThis study established new reference values and prediction equations for 6MWD and 6MWORK on a 20 m course in Caucasian males and females aged ≥40 years with normal pulmonary function and V'O2peak within normal predicted limits. These newly derived reference equations have the potential to add value to the assessment of functional capacity in clinical practice. Further research is needed for external validation in other cohorts and to confirm the utility of these equations in clinical practice.
Author contributionsJMD, DJ, AWV, PZL, JB, WCT, BH, AvH and MAS were responsible for the analysis and interpretation of data for the work. JB and WCT are principal investigators of the CanCOLD study. JMD, DJ, AWV, AvH and MAS drafted the manuscript. All authors take responsibility for the integrity of the data and the accuracy of the analyses and critically reviewed and revised the manuscript. All authors approved the manuscript before publication.
Collaborative research groupExecutive Committee: Jean Bourbeau (PI) (McGill University, Montreal, QC, Canada); Wan C Tan (co-PI) (UBC, Vancouver, BC, Canada); Shawn Aaron (University of Ottawa, Ottawa, ON, Canada); Kenneth R Chapman (University of Toronto, Toronto, ON, Canada); J Mark FitzGerald (UBC, Vancouver, BC, Canada); Paul Hernandez (Dalhousie University, Halifax, NS, Canada); François Maltais (University of Laval, Quebec City, QC, Canada); Darcy D Marciniuk (University of Saskatoon, Saskatoon, SK, Canada); Denis E O'Donnell (Queen's University, Kingston, ON, Canada); Don D Sin (UBC, Vancouver, BC, Canada); Brandie Walker (University of Calgary, Calgary, AB, Canada).
International Advisory Board: Jonathon Samet (the Keck School of Medicine of USC, California, USA); Milo Puhan (John Hopkins School of Public Health, Baltimore, USA); Qutayba Hamid (McGill University, Montreal, QC, Canada); James C Hogg (University of British Columbia, James Hogg Research Centre, Vancouver, BC, Canada).
Operations Centre: Jean Bourbeau (PI), Dany Doiron, Palmina Mancino, Pei Zhi Li, Dennis Jensen, Carolyn Baglole (University of McGill, Montreal, QC, Canada), Yvan Fortier (Laboratoire telematique Respiratory Health Network, FRQS); Wan C Tan (co-PI), Don Sin, Julia Yang, Jeremy Road, Joe Comeau, Adrian Png, Kyle Johnson, Harvey Coxson, Miranda Kirby, Jonathon Leipsic, Cameron Hague (University of British Columbia, James Hogg Research Centre, Vancouver, BC, Canada).
Economic Core: Mohsen Sadatsafavi (University of British Columbia, Vancouver, BC).
Public Health Core: Teresa To, Andrea Gershon (University of Toronto).
Data management and Quality Control: Wan C Tan, Harvey Coxson (UBC, Vancouver, BC, Canada); Jean Bourbeau, Pei-Zhi Li, Zhi Song, Andrea Benedetti, Dennis Jensen (McGill University, Montreal, QC, Canada); Yvan Fortier (Laboratoire telematique Respiratory Health Network, FRQS).
Field Centres: Wan C Tan (PI), Christine Lo, Sarah Cheng, Elena Un, Cynthia Fung, Wen Tiang Wang, Liyun Zheng, Faize Faroon, Olga Radivojevic, Sally Chung, Carl Zou (UBC James Hogg Research Centre, Vancouver, BC, Canada); Jean Bourbeau (PI), Palmina Mancino, Jacinthe Baril, Laura Labonte (McGill University, Montreal, QC, Canada); Kenneth Chapman (PI), Patricia McClean, Nadeen Audisho (University of Toronto, Toronto, ON, Canada); Brandie Walker, (PI), Curtis Dumonceaux, Lisette Machado (University of Calgary, Calgary, AB, Canada); Paul Hernandez (PI), Scott Fulton, Kristen Osterling, Denise Wigerius (Dalhousie University and Queen Elizabeth II Health Sciences Centre, Halifax, NS, Canada); Shawn Aaron (PI), Kathy Vandemheen, Gay Pratt, Amanda Bergeron (University of Ottawa, Ottawa, ON, Canada); Denis O'Donnell (PI), Matthew McNeil, Kate Whelan (Queen's University, Kingston, ON, Canada); François Maltais (PI), Cynthia Brouillard (University of Laval, Quebec City, QC, Canada); Darcy Marciniuk (PI), Ron Clemens, Janet Baran, Candice Leuschen (University of Saskatchewan, Saskatoon, SK, Canada).
Data sharingThe Canadian Cohort Obstructive Lung Disease (CanCOLD) study makes de-identified data available for research on respiratory health. Information on how to submit a data access application can be found on the CanCOLD website at: www.cancold.ca
Funding sourceThe Canadian Cohort Obstructive Lung Disease (CanCOLD; NCT00920348) study is currently funded by the Canadian Respiratory Research Network and the industry partners AstraZeneca Canada Ltd, Boehringer Ingelheim Canada Ltd, GlaxoSmithKline (GSK) Canada Ltd, and Novartis. Researchers at RI-McGill University Health Centre Montreal and iCAPTURE Centre Vancouver lead the project. Previous funding partners were the Canadian Institutes of Health Research (CIHR; CIHR/Rx&D Collaborative Research Program Operating Grants- 93326), the Respiratory Health Network of the Fonds de la recherche en santé du Québec (FRQS), and industry partners: Almirall; Merck Nycomed; Pfizer Canada Ltd; and Theratechnologies. With the exception of the GSK authors (please see author contributions), the funders had no role in the study design, data collection, and analysis, or preparation of the manuscript.
The authors thank CanCOLD study participants and individuals in the CanCOLD.


