


The severe acute respiratory syndrome Coronarovirus-2 associated still causes a significant number of deaths and hospitalizations mainly by the development of respiratory failure. We aim to validate lung ultrasound score in order to predict mortality and the severity of the clinical course related to the need of respiratory support.
MethodsIn this prospective multicenter hospital-based cohort study, all adult patients with diagnosis of SARS-CoV-2 infection, performed by real-time reverse transcription polymerase chain reaction were included. Upon admission, all patients underwent blood gas analysis and lung ultrasound by expert operators. The acquisition of ultrasound scan was performed on 12 peculiar anatomic landmarks of the chest. Lung ultrasound findings were classified according to a scoring method, ranging 0 to 3: Score 0: normal A-lines. Score 1: multiple separated B-lines. Score 2: coalescent B-lines, alteration of pleural line. Score 3: consolidation area.
ResultsOne thousand and seven patients were included in statistical analysis (male 62.4 %, mean age 66.3). Oxygen support was needed in 811 (80.5 %) patients. The median ultrasound score was 24 and the risk of having more invasive respiratory support increased in relation to higher values score computed. Lung ultrasound score showed negative strong correlation (rho: -0.71) with the P/F ratio and a significant association with in-hospital mortality (OR 1.11, 95 %CI 1.07–1.14; p < 0.001), even after adjustment with the following variables (age, sex, P/F ratio, SpO2, lactate, hypertension, chronic renal failure, diabetes, and obesity).
ConclusionsThe novelty of this research corroborates and validates the 12-field lung ultrasound score as tool for predicting mortality and severity clinical course in COVID-19 patients. Baseline lung ultrasound score was associated with in-hospital mortality and requirement of intensive respiratory support and predict the risk of IOT among COVID-19 patients.
The Severe Acute Respiratory Syndrome Coronarovirus-2 associated (SARS-CoV-2) continues to result in the accumulation of a significant number of infections worldwide.1 The severity of the disease is mainly linked to lower airway and lung involvement leading to pneumonia, possibly resulting in acute respiratory failure and, in more severe cases, in acute respiratory distress syndrome (ARDS).2 High-resolution computed tomography (HR-CT) represents the gold standard technique for diagnosing and assessing pulmonary extension during COVID-19 interstitial pneumonia.3 However, the advantages of HR-CT scans are counterbalanced by ionizing radiation exposure, time consumption and critical patient transport to and handling in the CT room.4 In this scenario, lung ultrasound (LUS) is a fast-to-use, non-invasive, reproducible method that can detect pulmonary findings that are not limited to those resulting from inflammation by evaluating artefacts.5 Among these, the b-line artefacts and the coexistence of consolidation areas are usually identified at diagnosis and followed during the monitoring of the patient.6,7 Previous studies documented a noteworthy prognostic role in the clinical management of ARDS non-COVID-19.8 During COVID-19 pandemic, a growing body of the literature has proposed several scoring systems to classify the ultrasound signs and compare them with the severity of pulmonary involvement.9-12 Currently, 12-zone ultrasound scanning appears to be the ideal protocol for identifying disease severity.13-15 The purpose of our study was to validate a 12-field LUS score in a large Italian cohort of COVID-19 patients to predict mortality and the severity of the clinical course related to the need for respiratory support.
MethodsStudy design and populationThis multicentre prospective observational cohort study enrolled consecutive patients admitted to ten Italian COVID-19 centres distributed throughout the country between February 1th, 2021, and July 31st, 2021. We included in the study all adult patients with a diagnosis of SARS-CoV-2 infection, confirmed by standard procedure, reverse transcriptase-polymerase chain reaction (RT-PCR) by a nasal or oropharyngeal swab). Patients <18 years old, those in need of intubation at inclusion, or those with other known diagnoses of interstitial lung diseases, primitive or metastatic lung cancer, heart failure or pregnancy were excluded.
All anamnestic, demographic and other clinical data were recorded and all patients performed arterial blood gas analysis upon the admission. Additional detail is provided in an online data supplement.
The patients were followed up with a daily check-up of all medical records until discharge or death. Noninvasive respiratory support needed during hospitalization was categorized into four groups: first, no support; second, nasal cannulas, venturi mask (VM) or non-rebreathing mask (NRM); third, high flow nasal cannula (HFNC); finally, continuous positive airway pressure (CPAP) and/or pressure support non-invasive ventilation (NIV). Oxygen and ventilatory support to acute respiratory failure was provided according current recommendations.16 PaO2/FIO2 ratio (P/F) was calculated based of the ratio between arterial O2 pressure and oxygen inspiratory fraction administered. In patients requiring low-flow oxygen system supplementation FiO2 was estimated according Shapiro formula. [Fraction of Delivered O2= 0.20 + (0.04 x L/min O2)].17
The clinicatrials.gov register number is NCT04871685 (Home - ClinicalTrials.gov).
Lung ultrasound and scoringAll patients underwent LUS at admission to the hospital. LUS was performed by expert operators in each centre who were trained in dedicated courses according to the recommendation of Italian Society Ultrasonography in Medicine and Biology (SIUMB).18 They were blinded to the clinical data or underwent LUS before HR-CT if that was performed. LUS was performed adopting the 12-region model, 6 on each side, with each hemithorax divided into anterior, lateral, and posterior areas (delimited by the anatomical landmarks represented by axillary lines) and each area into upper and lower segments. Other technical factors have been described in an on-line data supplement.
LUS artefacts have been categorized as follows: A-line, horizontal artefacts observed in normal lungs; B-lines: vertical artefacts in a variety of patterns including focal, confluent or “light beam”, which is a lucent, band-shaped and vertical b-line, that move rapidly with sliding; consolidations, single or multifocal, with occasional mobile air bronchograms and white lung. Finally, the state of pleural line was assessed. The findings were classified according to the following scoring method with scores ranging from 0 to 3 (Fig. 1):
. Score 0: normal A-lines with a continuous and regular pleural line. Score 1: multiple separated B-lines. Score 2: coalescent B-lines pattern with alterations of the pleural line.Score 3: consolidation area and possibly a large white lung artefact.")
Lung ultrasound imaging related to LUS score (0–3). Score 0: normal A-lines with a continuous and regular pleural line. Score 1: multiple separated B-lines. Score 2: coalescent B-lines pattern with alterations of the pleural line.Score 3: consolidation area and possibly a large white lung artefact.
Score 0: normal A-lines with a continuous and regular pleural line.
Score 1: multiple separated B-lines.
Score 2: coalescent B-lines pattern with alterations of the pleural line.
Score 3: consolidation area and possibly a large white lung artefact.
The total score was computed as the sum, which could range from 0 to 36.19
Before the beginning of the study, all sonographers looked at the clip models with different patterns to reduce possible bias in the interpretation of the images. In the case of doubtful scores, the clips were collectively discussed and assigned a shared score.
End points of the studyThe primary endpoint of the study was the association of LUS score with in-hospital mortality. The secondary endpoint was the assessment of LUS score association with highest degree of respiratory support the patient required during the hospitalization.
Statistical analysisCategorical data are expressed as numbers and percentages, while continuous variables are expressed as either medians and interquartile ranges or means and standard deviations, based on their distribution, which was assessed graphically and by the Shapiro–Wilk test. The presence of missing data is reported. The endpoint was in-hospital mortality, assessed either from data at discharge or the death certificate. The median follow-up time was calculated by the inverse Kaplan–Meier procedure. Univariable and multivariable logistic regression models were performed to evaluate the associations between in-hospital mortality and exposure variables. Odds ratios and 95 % confidence intervals (OR and 95 % CI) were calculated for all models. Nonlinear associations of LUS scores were tested using multivariable fractional polynomial (MFP) models and restricted cubic spline (RCS). The multivariable model was constructed using the best subset selection algorithm (selection with evaluation of all 2k possible models, where k is the number of variables under analysis), with subsequent choice of the best model according to the Bayesian information criterion (BIC). In addition to this selection, the model was enriched with additional variables of relevant clinical importance and known in the literature as prognostic factors. Internal validation was carried out through bootstrap resampling, with 800 repetitions, to evaluate the optimal LUS score alone (adjusted by age and sex) and the proposed model using the bsvalidation package in STATA.20
A p value <0.05 was considered statistically significant. All analyses were performed using statistical software STATA v16 (StataCorp. 2019. College Station, TX: StataCorp LLC).
Additional detail on the statistical analysis is provided in the online data supplement.
Sample sizeThe minimum sample size was calculated using the pmsampsize statistical package from STATA.21 The evaluation was performed assuming a binary outcome of mortality of approximately 25 % and a c-statistic of the model of 0.85 considering a maximum of 15 covariates. The calculation resulted in a minimum sample size of 398 patients.
EthicsThe study was approved by the local ethics committee (University of Campania Luigi Vanvitelli Prot. 0,009,416/I, Naples, Italy, 21–03–15) and was in accordance with the 1976 Declaration of Helsinki and its later amendments. All patients gave their written consent.
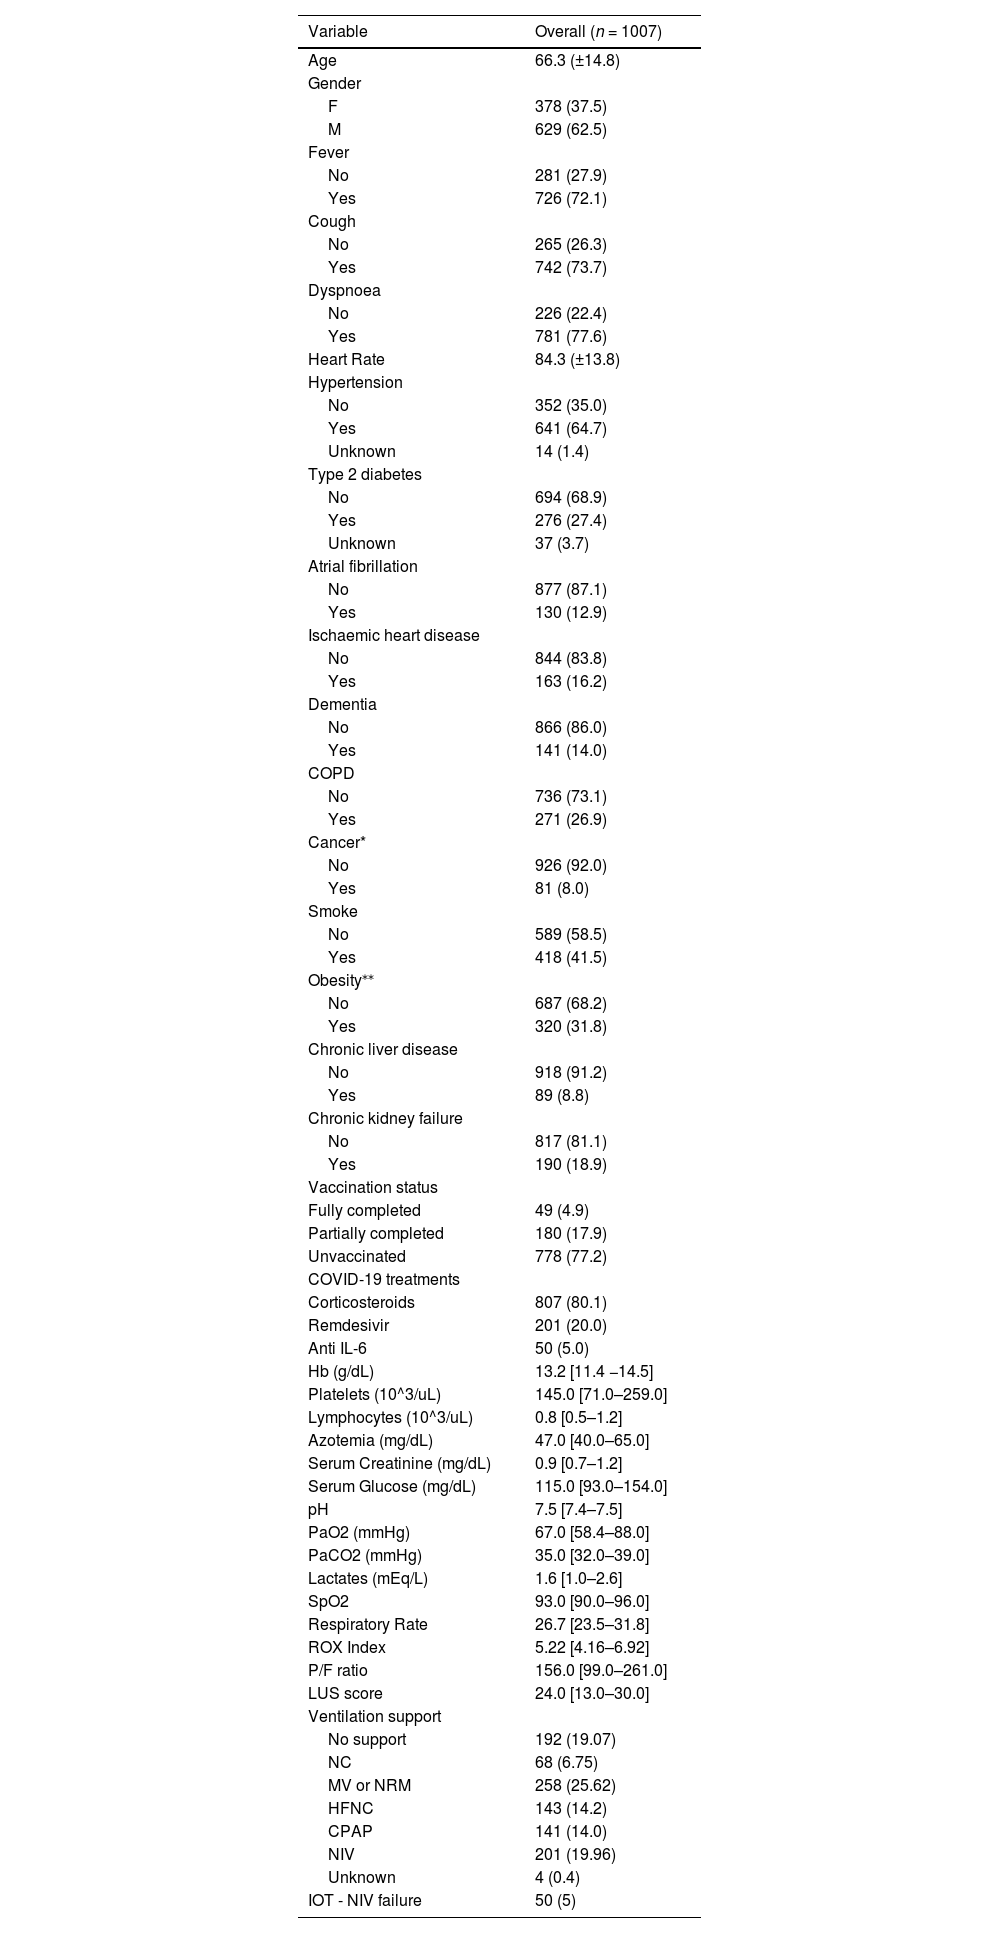
ResultsCharacteristics of the ECOVITA populationA total of 1007 patients are enrolled in the study and evaluated in the statistical analysis. The patients are mainly males (62.4 %), with a mean age of 66.3 years (SD 14.8) and a median duration of hospitalization of 17 days [inter-quartile range (IQR): 10–28 days]. All clinical and laboratory characteristics at admission are reported in Table 1. P/F median for each Center is described in Appendix Table 1.
Clinical and laboratory characteristics at admission.
*Data shown as mean (±SD), median [IQR] or absolute number (%). Cancer active in the last 5 years; **as BMI >=30; CPAP: Continuous Positive Airway Pressure; Hb = haemoglobin; HFNC: High Flow Nasal Cannula; IOT: Oro-tracheal intubation; NC: Nasal Cannula; MV: Venturi Mask; NRM: Non-Rebreathing Mask; NIV: Non-Invasive Ventilation.
The LUS score shows a median value of 24 with an IQR of 13 to 30. Appendix Fig. 1 shows the distribution of the scores with modal peaks at multiple scores of 12. Additionally, Appendix Fig. 2 reports the distribution of LUS scores across each centre. The values of the other respiratory variables (PaO2, PaCO2, lactates, SpO2 and P/F ratio) are shown in Table 1. The LUS scores show a strong negative correlation (rho: −0.71) with the P/F ratio and moderate negative correlations with PaO2 and SpO2 (rho: −0.34 and −0.32, respectively) (Appendix Fig. 3).
LUS scores, ventilatory support and severity of the clinical courseThe variable of respiratory support is used to assess the clinical course of the patients. Although the transition between different support needs is a temporal variable, the brevity of the transitions suggested that we evaluate the worst of the respiratory possibilities as the outcome, thus using an ordinal logistic model. LUS scores show a significant association with respiratory support [Odd ratio (OR): 1.19, 95 % confidence interval (CI): 1.17–1.21; p < 0.001], with an increasing risk of needing more invasive respiratory support as the LUS scores measured on patient arrival increased. Oxygen support is needed in 811 (80.5 %) patients and are subsequently categorized into no support (19.1 %), NC+MV+NRM (32.5 %), HFNC (14.3 %) and CPAP+NIV (34.1 %).
Regarding the LUS score values, the patients who require more respiratory support have higher LUS score values on arrival at the hospital (LUS score median and IQR: no support = 10, 4–16; NC, MV, NRM= 22, 12–24; HFNC= 25, 20–30; CPAP, NIV= 30, 24–36). In addition, a similar trend is evident when assessing LUS score values in patients with different P/F ratios (median LUS score and IQR: P/F < 200 = 26, 24–32; P/F 200–300 = 16, 12–24; P/F > 300= 10, 4–13). (Appendix Table 2). The number of patients requiring oro-tracheal intubation, invasive ventilation and ICU admission is 50 patients (5 %). Baseline respiratory support in patients undergoing IOT for NIV-failure is reported in Appendix Table 3. The median baseline LUS score in patients who are subsequently intubated is 32 (IQR: 28–36). (Appendix Table 4).
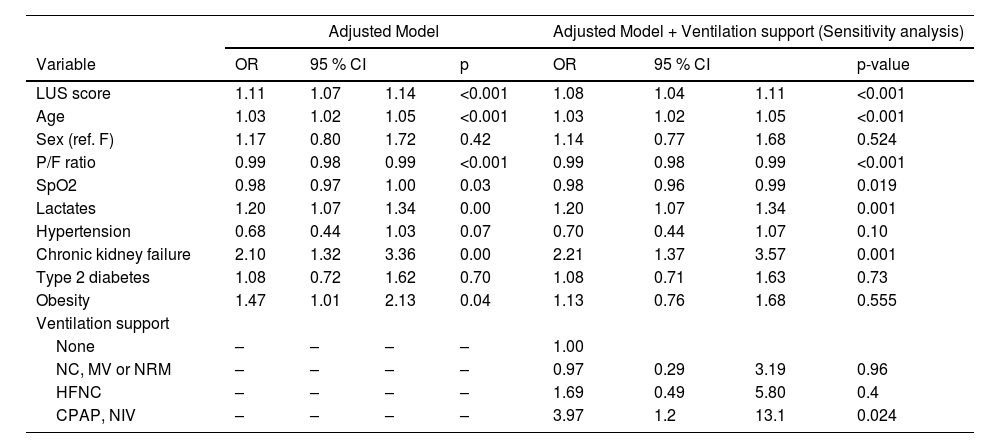
In-hospital mortality, clinical prognostic factors and internal validationDuring the observation period, 265 in-hospital mortality events are recorded, with a cumulative incidence of approximately 26.3 % and a median follow-up time of 21 days (Fig. 2). The univariable logistic regression analysis for in-hospital mortality is reported in the supplementary table (Appendix Table 5). LUS scores show a significant association with in-hospital mortality (OR: 1.18, 95 % CI: 1.16–1.21; p < 0.001). MFP and RCS show no evidence of a nonlinear association. In the multivariable analyses, depending on the best subset selection algorithm and evidence from the literature, we adjusted the logistic regression model for age, sex, P/F ratio, SpO2, lactate, hypertension, chronic renal failure, diabetes, and obesity (Table 2). Additionally, oxygen support, although not measured at baseline but during the observation period, is included in the model for a sensitivity analysis. Even after adjustment, the LUS score continues to be an important prognostic factor (OR: 1.11, 95 % CI: 1.07–1.14; p < 0.001). Data about in hospital mortality according to respiratory support are showed in appendix Table 6. Results of multivariate analysis including main confounding factors are showed in Appendix Table 7.

Multivariable logistic regression model, in-hospital mortality.
OR: Odds Ratio; 95 % CI: 95 % Confidence Interval.
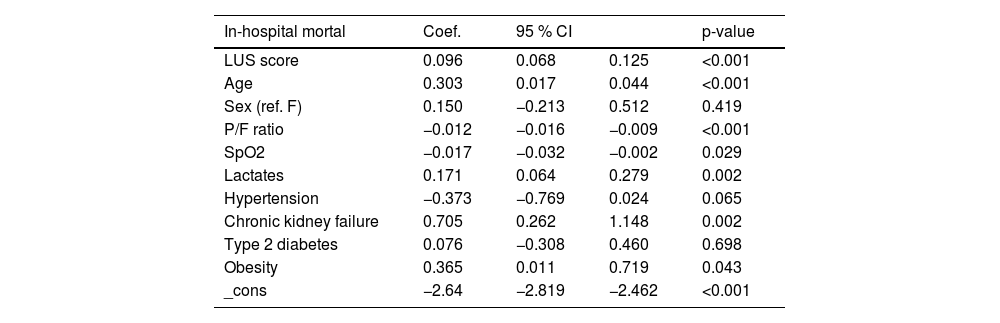
Internal validation of the LUS score alone (adjusted by age and sex) and the proposed model result in Brier scores of 31.6 and 39 and c-statistic values of 0.84 and 0.88, respectively (the calibration slope and coefficients from the model adjusted by bootstrap shrinkage are reported in Fig. 3 and Table 3 respectively). Considering the complete model and classifying as positive (death prediction) a patient with logistic regression predicted value >=0.5 [Pr(D) >=0.5], we obtained a sensitivity and specificity of 64.2 % and 91.1 %, with a positive predictive value of 73.3 % and a negative predictive value of 87 %.
 and the observed outcome risk (y-axis).")
Model adjusted by bootstrap shrinkage.
The aim of this study was to validate the 12-field LUS score to provide a solid reference point in the prediction of COVID-19 disease severity in terms of mortality and recourse to invasive ventilation. The results showed a median ultrasound score of 24 and the risk of having more invasive respiratory support increased in relation to higher values score computed. Moreover, lung ultrasound score showed negative strong correlation (rho: −0.71) with the P/F ratio and a significant association with in-hospital mortality (OR 1.11, 95 %CI 1.07–1.14; p < 0.001), even after adjustment with the following variables (age, sex, P/F ratio, SpO2, lactate, hypertension, chronic renal failure, diabetes, and obesity). Internal validation of the LUS score alone (adjusted by age and sex) and the proposed model resulted in Brier scores of 31.6 and 39 and c-statistic values of 0.84 and 0.88, respectively.
To obtain a large sample, we carried out a pragmatical multicentre study that involved the entire Italian territory in 2021 with a high occupancy of hospital beds.22 We also found the prevalence of comorbidities represented by hypertension followed by chronic obstructive pulmonary disease (COPD), liver diseases and type 2 diabetes according to other studies.23-26 To avoid a bias in computing LUS scores, we ruled out patients with heart failure due to the shared artefact “b-line” with interstitial pneumonia.
The median LUS score (24) showed some fluctuations across different centres due to operator discrepancies and the different units involved in the patient's enrolment (emergency department, infectious or respiratory wards, sub-intensive wards). In particular, the number of patients treated for each center ranges from 13 to 333; five centers were sub-intesive wards or emergency departments whilst other five centers were low or middle intensity wards (internal medicine, infectious diseases, general respiratory medicine). Therefore, the heterogeneity in P/F ratio and LUS score across the centers reflects the clinical scenario and severity of COVID-19 patients. However, the number of patients enrolled for each center did not reflect the number of the COVID-19 patients treated into the hospital during the pandemic.
In recent months, several imaging protocols have been proposed in the literature that have analysed outcomes with 4 different LUS imaging protocols based on 4, 8, 12, and 14 LUS acquisitions. The results have shown how a 12-field acquisition system seems to be a good tradeoff between acquisition time and accuracy.14,15,27
The correlations of LUS scores with the variables under study substantially supported the hypotheses. First, the correlation between LUS scores and the values expressed by blood gases was evident, especially with the P/F ratio and indicates the need for ventilatory support and any need for intubation.28 Similarly, as the LUS scores increased, we observed a progressive increase in the need for ventilatory support and the percentage of patients who underwent intubation. A linear association with mortality was also found with increases in LUS scores. The correlation with a linear increase in the scores suggested not considering a single LUS score cut-off as a predictor of the risk of unfavorable outcomes.
These data, confirming the results of previous studies across a wider series of cases,6,10-13,29 have established the basis for validation of the 12-field LUS score in the context of COVID-19. In addition, a recent meta-analysis conducted on 66 studies with a total population of 4687 enrolled patients confirmed that higher LUS scores were associated with a major risk of death, intensive care unit admission or the need for mechanical ventilation.30
To our knowledge, this is the first study that aimed to validate LUS scores with a large number of patients with COVID-19 while simultaneously applying the ultrasound methodology in the real world of a pandemic. It is important to consider that one of the strengths of the study is that it analysed the LUS scores alone and after adjustment with other variables peix (chosen with statistical methods and with a priori knowledge). This element is missing in many of the previous studies in the literature and the fact that the role of the LUS score is so strong even after adjustment and that the c-statistic remains so high even after internal validation does indeed suggest that this score is very important from a clinical point of view.
The limitations of this study were discussed in on-line data supplement.
We did not evaluate the role of chest X-ray (XR) and HR-CT in this study. However, previous studies have indicated agreement between HR-CT and LUS.31-33 LUS, on the other hand, proved to be superior to XR, which plays a completely marginal role in COVID-19 imaging.33-34 Other tools (i.e. ROX index, NIVO score) developed from different clinical scenarios have been readdressed in COVID-19 showing adequate performance in predicting COVID-19 prognosis, despite large validation cohorts still lacking.35-36 While the implementation of these indexes in clinical decision making may offer rapidly available stratification of the COVID-19 population, LUS encompasses also information about clinical phenotype of COVID-19 (high density versus low density ARDS.37
In conclusion, LUS is a reliable, low-cost method in patients with COVID-19 for assessing the state of severity providing an accurate risk stratification. The results of this research corroborate and validate the LUS score for predicting in-hospital mortality and was directly associated with the requirement of more advanced respiratory support as well with the risk of IOT among COVID-19 patients. The internal validation model allows to a generalization of effectiveness in hospitalized COVID-19 patients.
Author's contributionsL.R., M.L., I.D.S. study design, data interpretation, and writing and reviewing the paper. V.S. statistical analysis and writing the paper. C.A., G.O., F.P., C.A., L.M., U.S., M.C.F., L.R. data collection, data interpretation, and reviewing the paper. C.I., C.R., C.S., N.L., M.G.C., F.M., E.P., E.A., S.T., G.V., M.N., M.L.B., S.M., data collection. L.E.A., F.C.S., R.M.., N.C., A.B., F.G.N., L.P., M.B., G.F.P., G.L., G.C., A.P., V.F., G.F., G.S., A.C., R.N. data interpretation and reviewing of the paper. ECOVITA group data collection and reviewing the paper.
All authors approved the final version of the paper.


