Although treatable and preventable, chronic obstructive pulmonary disease (COPD) is still associated with high morbidity and mortality.1 Dyspnea and exercise incapacity are the cardinal symptoms of the disease.2,3 It has traditionally been related to ventilatory or gas exchange abnormalities,4,5 but results from clinical research studies have changed the current perception. Recent data suggest that cardiac dysfunction and pulmonary vessel impairment may be essential contributors to both symptoms even in non-severe forms of COPD.6,7
Right ventricular dysfunction is an independent predictor of effort intolerance in a general population of patients.8 However, little is known about its frequency and outcomes in milder forms of COPD. COPD population studies have introduced the novel paradigm of “cor pulmonale parvus.”9–11 They demonstrate that COPD patients have small RV dimensions, RV hypertrophy and right ventricular diastolic dysfunction (RVDD).12 RVDD is an early sign of pulmonary vasculopathy and precedes the clinical/echocardiographic manifestation of pulmonary hypertension.13–15 RVDD detection is thus essential for the early diagnosis of pulmonary vasculopathy for COPD management and physical activity improvement.
The aims of the current study are: 1) to detect the frequency of exercise-induced RVDD in non-severe COPD patients without echocardiographic signs of pulmonary arterial hypertension at rest; 2) to find RV echocardiographic parameters - predictors for stress RVDD; 3) to analyse the cardio-pulmonary exercise testing abnormalities, associated with stress RVDD; 4) to determine which echocardiographic parameters are independent factors for the 6-minute walk test (6-MWT) performance.
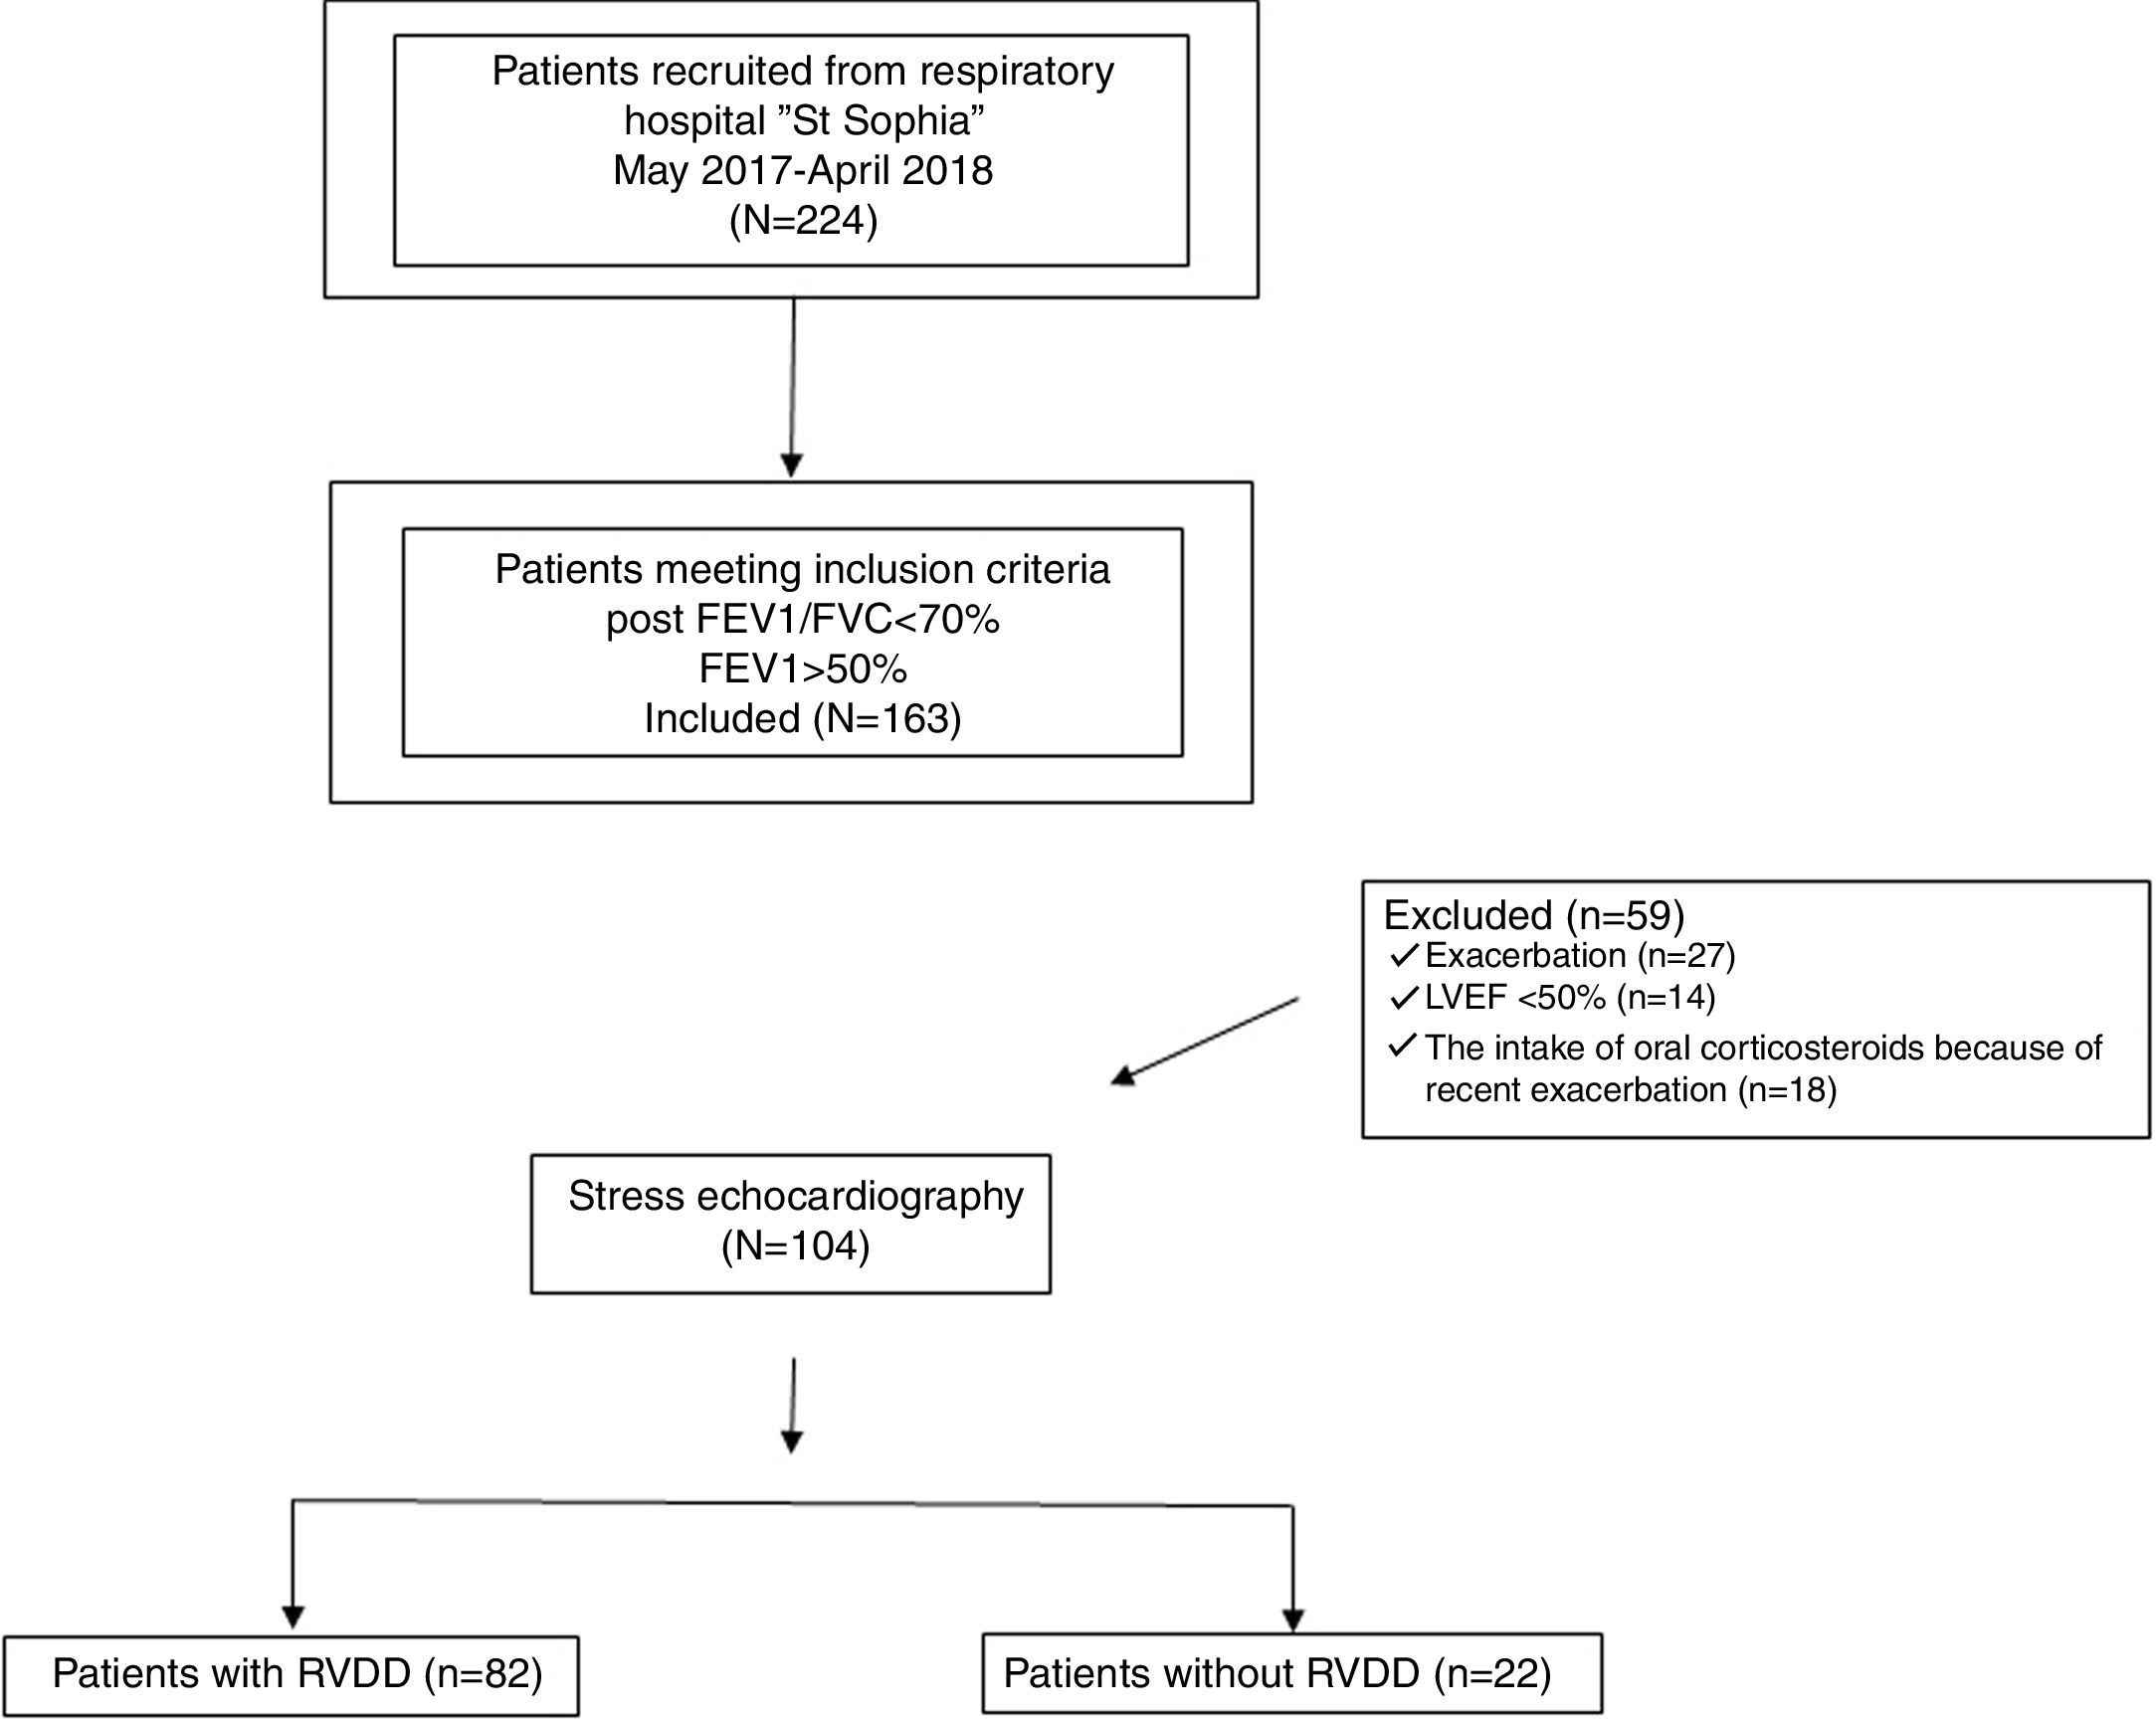
Materials and methodsPatients and study protocolThae study was prospective, conducted with 224 outpatients diagnosed with COPD at the University Hospital for Respiratory Diseases “St. Sophia”, Sofia. All of the subjects had exertional dyspnoea and normal left ventricular systolic function at rest (left ventricular ejection fraction >50%) but only 163 of them demonstrated non-severe COPD – FEV1>50%. Only clinically stable patients participated in the study – none of which had experienced exacerbation of respiratory symptoms or other chronic comorbidity during the previous three months; nor had there been any change in supportive medical therapy during those three months.
The following exclusion criteria were considered: 1) LVEF<50%; 2) over grade 1 LVDD at rest; 3) echocardiographic signs of systolic pulmonary arterial hypertension; 4) valvular heart disease; 5) documented cardiomyopathy; 6) severe uncontrolled hypertension (systolic blood pressure>180mmHg and diastolic blood pressure >90mmHg); 7) atrial fibrillation or malignant ventricular arrhythmia; 8) ischaemic heart disease; 9) anaemia; 10) diabetes mellitus; 11) cancer; 12) chronic kidney disease; 13) recent chest or abdominal surgery; 14) recent exacerbation (during the last three months); 15) recent change (during the last three months) in medical therapy;16) non-invasive positive-pressure ventilatiton support; 17) long-term ambulatory oxygen therapy. The flowchart of the design of the study is presented as Fig. 1.
“The recruitment period was between April 2017 - April 2018, and was approved by the local Ethical Committee (protocol 5/12.03.2018). All the patients had visited the clinic because of routine annual examination. Medical history and current medication were recorded. There was no change in current therapy before or during the study. During the initial visit, inclusion and exclusion criteria were taken into account. Within 3-4 days, patients who were eligible for the study were given an appointment spirometry and body plethysmography. Computed tomography (CT) and six-minute walk tests were done within 5-6 days of the initial visit. Cardio-pulmonary exercise testing (CPET) and stress echocardiography were executed within 7-10 days. CPET was divided ino two sessions within two consecutive days. During the first session subjects were acquainted with the protocol and were introduced to the bicycle. β2 agonists and anticholinergics were withdrawn 24hours before all physiological tests - spirometry, body plethysmography and cardio-pulmonary exercise testing.
ProceduresPulmonary Function TestingAll subjects underwent preliminary clinical examination which included chest X-ray, spirometry, electrocardiogram, and echocardiography. Those eligible for the study underwent spirometry and exercise stress test. Both tests were performed on Vyntus, Carefusion, Germany following the guidelines. Spirometry was performed after bronchodilatation test - application of (400μkg) of salbutamol. Following the ERS guidelines a post-bronchodilatation ratio of FEV1/FVC<70% was assumed for the diagnosis of COPD.16 Only patients with mild/moderate airway obstruction (FEV1>50%) were selected.
CT-emphysema scoreChest CT scans were obtained using Siemens multi-detector helical CT scanners. Patients were in the supine position. Scans were performed in full inspiration with the following parameters: collimation - 1mm; 120–140kV; 75–350mA; 0.75–1 s scan time; 1–2mm slice thickness. Emphysema is characterized by CT low attenuation areas (LAA) compared to normal surrounding lung parenchyma. An automated identification of the LAA, defined as an area with less than 950 Hounsfield unit (HU) density, was performed. Emphysema severity was determined using the Goddard scoring system.17,18 Each lung was divided into three zones: the upper zone, extending from the apices to the level of the aortic arch; the mid-zone, extending to the level of tracheal bifurcation; and the lower zone, extending from the level of tracheal bifurcation to the diaphragm. Lung regions were graded as follows; no emphysema - score 0; ≤25% emphysema - 1; ≤50% - 2; ≤75% -score 3; >75% - score 4. Goddard score calculation is the calculation of the percentage of LAA per surface area, with the following cut-off values: mild emphysema - Goddard I - 1-7 scores; moderate emphysema - Goddard II - 8-15scores; severe emphysema – Goddard III- 16-24scores.
Six-minute walk testing (6-MWT)Six-minute walking test was performed in accordance with ATS guidelines.19 It was done on a separate day after the initial visit for study eligibility criteria and after the performance of the exercise stress test and stress echocardiography. Subjects were instructed and encouraged to walk a 30 meter preliminary measured distance in a hospital corridor. SpO2, heart rate and arterial blood pressure were obtained before and during the recovery period.
Stress test protocol – cardio-pulmonary exercise testing (CPET)All the patients underwent symptom limited incremental exercise stress test following the guidelines.20 Subjects breathed through an oro-nasal mask (Hans Rudolf 7450 SeriesV2™ Mask, CareFusion). Breath-by-breath cardiopulmonary data (Vyntus, CareFusion) were measured at rest, warm up and incremental exercise testing. It was performed on a bicycle after the clinical examination and spirometry. Gas and flow sensors were calibrated before each test. Clinical monitoring of the patients included standard electrocardiography throughout the whole exercise test; manual blood pressure measurements, and heart rate recordings at the end of every stage.
A continuous ramp protocol was applied. After two minutes of unloaded pedaling (rest phase- 0W), a three minute warm-up phase (20W) followed. The test phase included 20W/2min load increments. Patients were instructed to pedal at 60-65 rotations per minute. Patient effort was considered to be maximal if two of the following criteria emerged: predicted maximal HR is achieved; predicted maximal work is achieved;’VE/’VO2 >45, RER >1.10 as recommended by the ATS/ACCP. 21
A breath-by-breath analysis was used for expiratory gases evaluation. Oxygen uptake (’VO2(mL/kg/min)), carbon dioxide production (’VCO2 (L/min)), minute ventilation (‘VE (L/min)) and end-tidal CO2 pressure (PetCO2 (mm Hg)) were collected continuously at rest and throughout the exercise test. Peak values of oxygen consumption and carbon dioxide production were presented by the highest 30-second average value, obtained during the last stage of the exercise test. Peak respiratory exchange ratio (RER) was the highest 30second averaged value between’VO2 and’VCO2 during the last stage of the test. Ten-second averaged’VE and’VCO2 data, from the initiation of exercise to peak, were used to calculate the’VE/’VCO2 slope via least squares linear regression.22 A dual approach for the measurement of the anaerobic threshold (AT) was applied. Both V-slope method and the ventilatory equivalents method for ‘VO2 and’VCO2 were used. The modified Borg scale was applied for peak dyspnea and leg discomfort.
Breathing reserve was calculated as (MVV - peak V’E)/MVV x100 where MVV is maximal voluntary ventilation estimated as FEV1 multiplied by 35.23 Heart rate (HR) reserve – (HRR) was calculated as (peak HR-resting HR) x100/((220-age) – resting HR).
Body plethysmography and dynamic hyperinflation (DH)Body plethysmography (residual volume (RV), functional residual capacity (FRC), total lung capacity (TLC)) was performed on (Vyntus, body plethysmograph, CareFusion, Germany) using European and American Thoracic Society guidelines.16 End-expiratory lung volume (EELV) was calculated from IC maneuvers at rest, every 2minutes during exercise and at peak exercise (Vyntus). IC manoeuvres were used to examine operating lung volumes and dynamic hyperinflation (DH) as previously described.24 Data are presented as 30-s averages during rest, the last 30 s of each second minute during exercise, and at peak exercise. DH was defined as a decrease in IC from rest of more than 150mL or 4.5% pred at any time during exercise.25
Echocardiography methodsEchocardiography included the generally used approaches of M-mode, two-dimensional and Doppler echocardiography. Routine structural and haemodynamic indices of both chambers were measured following the guidelines.26,27 The systolic function of the left ventricle was defined by Simpson's modified rule. The diastolic function of both ventricles was evaluated by the E/A ratio and the average E/e’ ratio at rest. As a more precise approach for diastolic dysfunction detection, tissue Doppler analysis was used. We used e’ value as the average of medial and the lateral measurements for the mitral annulus. The peak of the average E/e’ ratio>15 was considered as a marker for stress induced LVDD.
The dimensions of the right ventricle were assessed from the long-axis parasternal and apical four chamber view.28 Tricuspid annular plane systolic excursion (TAPSE) and S-peak velocity were analysed for RV systolic function evaluation. Right ventricular wall thickness (RVWT) was measured in end-diastole. Systolic pulmonary arterial pressure was calculated by Bernoulli equation and by the acceleration time (AT). 28,29 Right atrium volume index (RAVI) was measured at right ventricle end-systole by Simpson's modified rule. The peak of the average E/e’ ratio>6 was considered as a marker for stress induced RVDD. Stress induced RV diastolic dysfunction was considered if stress induced E/e’ ratio>6. All parameters were measured at end-expiration and in triplicate during different heart cycles. 29
Statistical analysisDescriptive statistics was used for demographic and clinical data presentation. The Kolmogorov-Smirnov test was used to explore the normality of distribution. Continuous variables were expressed as median and interquartile range when data was not normally distributed and with mean±SD if normal distribution was observed. Categorical variables were presented as proportions. Data were compared between patients with and without RVDD. An unpaired Student's t test was performed for normally distributed continuous variables. Mann-Whithney-U test was used in other cases. Categorical variables were compared by the χ2 test or the Fisher exact test. Adjustments were made for age, sex, comorbidity and medication. Receiver operating characteristic (ROC) curves were constructed. ROC analysis was performed to test RV echocardiographic parameters at rest that may accurately distinguish between stress RV E/e’ >6 or <6. Regression analysis was also used with the echocardiographic parameters as qualitative parameters, using their cut-off values. Univariable regression analysis was performed to assess which echocardiographic parameters are associated with stress RV E/e’>6. Multivariable logistic regression analysis by using a forward stepwise approach detected the significant independent predictors of stress RV E/e’>6. Predictive models were constructed. Univariable and multivariable logistic regression analyses were also used to determine the parameters significantly related with the 6MWT. Age, sex, height, weight (BMI), FEV1, Goddard score, ICdyn, stress LV diastolic dysfunction were specifically included as co-variates in both situations.
In all cases a p value of less than 0.05 was considered significant as determined with SPSS® 13.0 Software (SPSS, Inc, Chicago, Ill) statistics
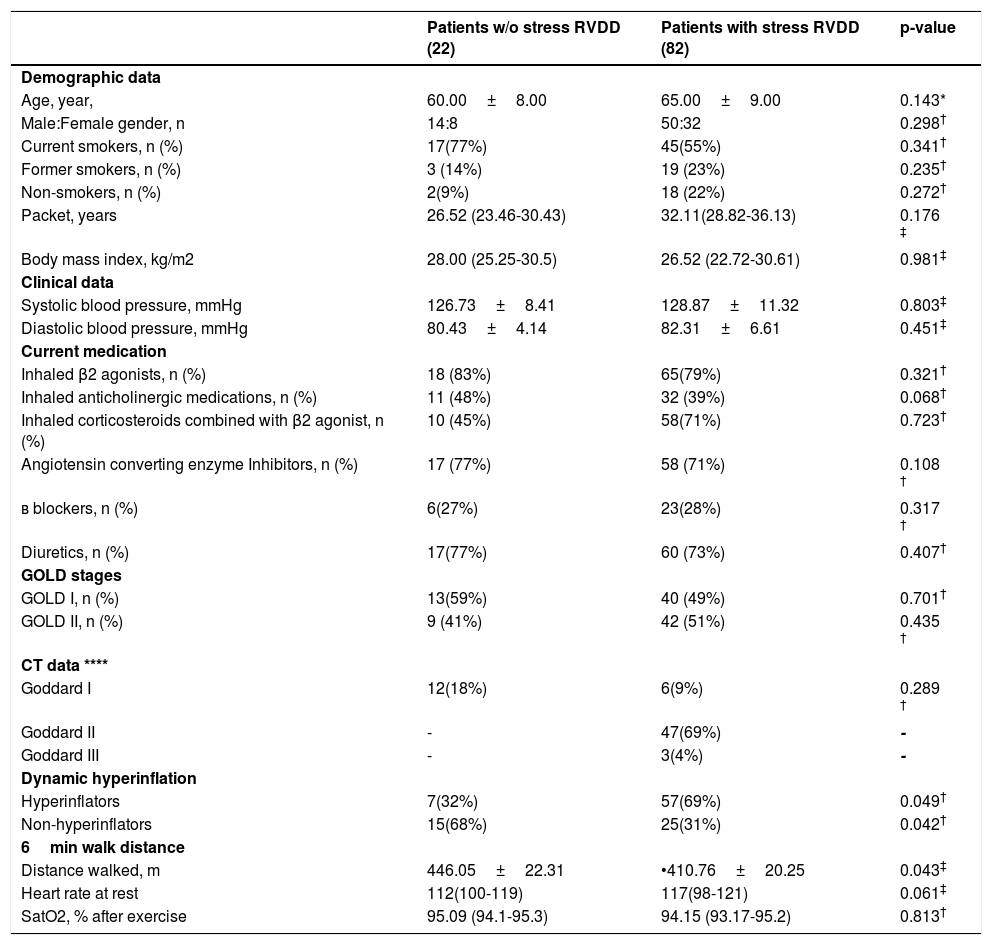
ResultsDemographic and clinical dataSubjects enrolled in the study were Caucasians with a mean age of 62.50±8.5 years and a body mass index of 27.26±6.92kg/m2. They were divided into two groups - subjects with stress induced right ventricular diastolic dysfunction - 78%(82/104) (COPD-RVDD), and those without stress induced diastolic dysfunction 22%(22/104), (COPD -no RVDD). There was no statistically significant difference for the demographic and clinical parameters between the two groups (Table 1.).
Clinical and demogrphic charcteristics of the groups with and w/o stress RVDD.
| Patients w/o stress RVDD (22) | Patients with stress RVDD (82) | p-value | |
|---|---|---|---|
| Demographic data | |||
| Age, year, | 60.00±8.00 | 65.00±9.00 | 0.143* |
| Male:Female gender, n | 14:8 | 50:32 | 0.298† |
| Current smokers, n (%) | 17(77%) | 45(55%) | 0.341† |
| Former smokers, n (%) | 3 (14%) | 19 (23%) | 0.235† |
| Non-smokers, n (%) | 2(9%) | 18 (22%) | 0.272† |
| Packet, years | 26.52 (23.46-30.43) | 32.11(28.82-36.13) | 0.176 ‡ |
| Body mass index, kg/m2 | 28.00 (25.25-30.5) | 26.52 (22.72-30.61) | 0.981‡ |
| Clinical data | |||
| Systolic blood pressure, mmHg | 126.73±8.41 | 128.87±11.32 | 0.803‡ |
| Diastolic blood pressure, mmHg | 80.43±4.14 | 82.31±6.61 | 0.451‡ |
| Current medication | |||
| Inhaled β2 agonists, n (%) | 18 (83%) | 65(79%) | 0.321† |
| Inhaled anticholinergic medications, n (%) | 11 (48%) | 32 (39%) | 0.068† |
| Inhaled corticosteroids combined with β2 agonist, n (%) | 10 (45%) | 58(71%) | 0.723† |
| Angiotensin converting enzyme Inhibitors, n (%) | 17 (77%) | 58 (71%) | 0.108 † |
| в blockers, n (%) | 6(27%) | 23(28%) | 0.317 † |
| Diuretics, n (%) | 17(77%) | 60 (73%) | 0.407† |
| GOLD stages | |||
| GOLD I, n (%) | 13(59%) | 40 (49%) | 0.701† |
| GOLD II, n (%) | 9 (41%) | 42 (51%) | 0.435 † |
| CT data **** | |||
| Goddard I | 12(18%) | 6(9%) | 0.289 † |
| Goddard II | - | 47(69%) | - |
| Goddard III | - | 3(4%) | - |
| Dynamic hyperinflation | |||
| Hyperinflators | 7(32%) | 57(69%) | 0.049† |
| Non-hyperinflators | 15(68%) | 25(31%) | 0.042† |
| 6min walk distance | |||
| Distance walked, m | 446.05±22.31 | •410.76±20.25 | 0.043‡ |
| Heart rate at rest | 112(100-119) | 117(98-121) | 0.061‡ |
| SatO2, % after exercise | 95.09 (94.1-95.3) | 94.15 (93.17-95.2) | 0.813† |
A trend of a higher percentage of current smokers (77% vs 55%) in the patients w/o stress RVDD compared to those with stress RVDD may be observed. In contrast, the number of former smokers is bigger in patients with stress RVDD (23% vs 14%). Twenty-two percent of the patients with stress RVDD are non-smokers, which is much higher than those without stress RVDD (9%). The total number of packet-years, however, predominates in patients with stress RVDD (32.11 vs 26.52), without reaching statistical significance.
There was no substantial distinction between the patients with and without stress RVDD for incidence of GOLD stages. Mild COPD was found in 40(49%) of the patients with stress RVDD vs 13 (59%) in those without RVDD. Moderate COPD was encountered in 42 (51%) of the patients with stress RVDD vs 9 (41%) in those without. Most of the patients without stress RVDD had mild COPD - 13 (59%); 9 (41%) of them had moderate COPD; in patients with stress RVDD the GOLD stages were almost evenly distributed – 40 (49%) of the patients showed mild forms of COPD vs 42 (51%) with moderate COPD. This explains the almost identical percentage of intake of β2-agonists (79% vs 83%) and anti-cholinergic medications (39% vs 48%) in the subjects with/without stress RVDD respectively. Though not of clinical significance there is a trend for a larger intake of combined ICS/β2-agonists in the group with stress RVDD (71% vs 49%).
CT of the chest and Goddard scoring were performed in a total of 68 patients. 12 of these patients were without stress-RVDD and 56 with stress-RVDD; 18 (26%) of the patients were Goddard I; 47 (69%) of the patients were Goddard II; 3 (4%) were Goddard III (Table 1.). All of the patients without stress-RVDD were Goddard I (12/68 - 18%) 8 of them were GOLD I, 4 GOLD II. The patients with stress RVDD were more heterogeneous regarding Goddard CT data: 6 (9%) patients had Goddard I; 47(69%) - Goddard II; 3(4%) - Goddard III. The patients with stress-RVDD in Goddard II and Goddard III were GOLD II; only one patient from Goddard I was GOLD I; the rest were GOLD II.
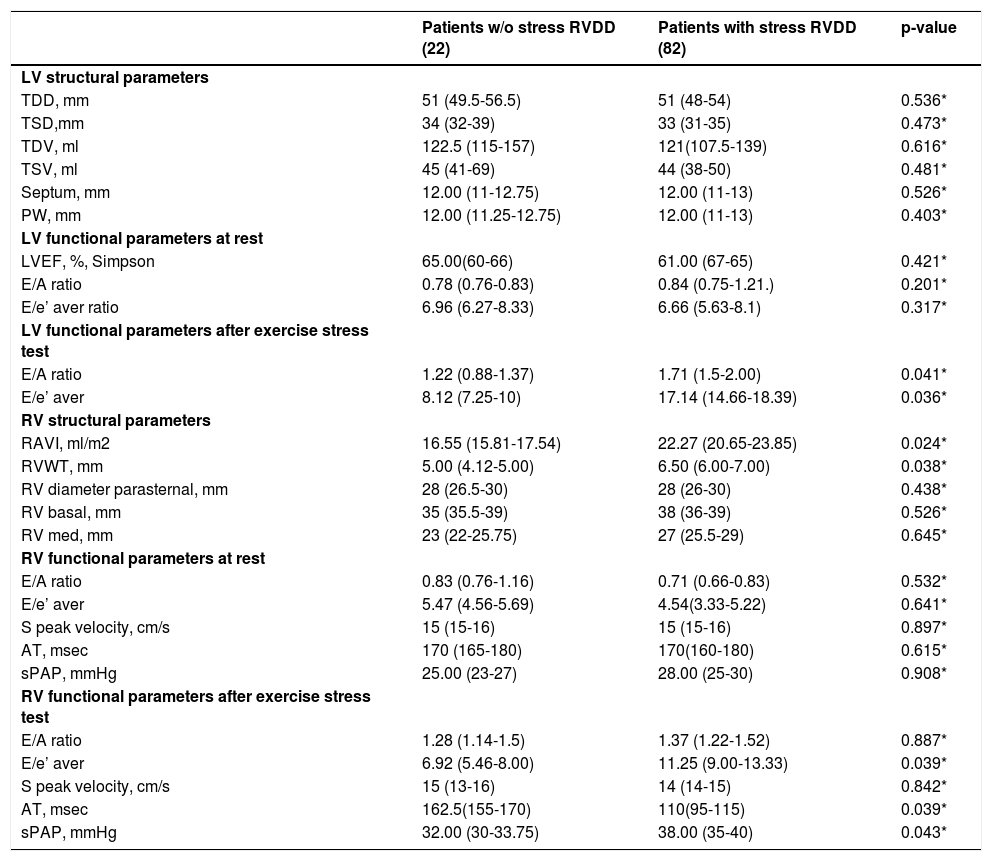
RV parametersThe echocardiographic characteristics are detailed in Table 2. The median right ventricular basilar diameter was 38mm (35-39), right ventricular systolic function - S’ peak velocity 16m/s (15-16) and TAPSE – 22mm (21-24) were within normal limits. Median RAVI was at the upper limit of normal 19.47ml/m2 (21.38-23.61); Median RVWT – 6.5mm (6-7) with approximately 53% of subjects demonstrating evidence of right ventricular hypertrophy. None of the subjects had evidence of right atrial and ventricular enlargement. The pulmonary artery systolic pressure was estimated in all subjects - 27mmHg (25-30)) and was not elevated at rest.
Echocardiographic parameters of the patients with and w/o RVDD.
| Patients w/o stress RVDD (22) | Patients with stress RVDD (82) | p-value | |
|---|---|---|---|
| LV structural parameters | |||
| TDD, mm | 51 (49.5-56.5) | 51 (48-54) | 0.536* |
| TSD,mm | 34 (32-39) | 33 (31-35) | 0.473* |
| TDV, ml | 122.5 (115-157) | 121(107.5-139) | 0.616* |
| TSV, ml | 45 (41-69) | 44 (38-50) | 0.481* |
| Septum, mm | 12.00 (11-12.75) | 12.00 (11-13) | 0.526* |
| PW, mm | 12.00 (11.25-12.75) | 12.00 (11-13) | 0.403* |
| LV functional parameters at rest | |||
| LVEF, %, Simpson | 65.00(60-66) | 61.00 (67-65) | 0.421* |
| E/A ratio | 0.78 (0.76-0.83) | 0.84 (0.75-1.21.) | 0.201* |
| E/e’ aver ratio | 6.96 (6.27-8.33) | 6.66 (5.63-8.1) | 0.317* |
| LV functional parameters after exercise stress test | |||
| E/A ratio | 1.22 (0.88-1.37) | 1.71 (1.5-2.00) | 0.041* |
| E/e’ aver | 8.12 (7.25-10) | 17.14 (14.66-18.39) | 0.036* |
| RV structural parameters | |||
| RAVI, ml/m2 | 16.55 (15.81-17.54) | 22.27 (20.65-23.85) | 0.024* |
| RVWT, mm | 5.00 (4.12-5.00) | 6.50 (6.00-7.00) | 0.038* |
| RV diameter parasternal, mm | 28 (26.5-30) | 28 (26-30) | 0.438* |
| RV basal, mm | 35 (35.5-39) | 38 (36-39) | 0.526* |
| RV med, mm | 23 (22-25.75) | 27 (25.5-29) | 0.645* |
| RV functional parameters at rest | |||
| E/A ratio | 0.83 (0.76-1.16) | 0.71 (0.66-0.83) | 0.532* |
| E/e’ aver | 5.47 (4.56-5.69) | 4.54(3.33-5.22) | 0.641* |
| S peak velocity, cm/s | 15 (15-16) | 15 (15-16) | 0.897* |
| AT, msec | 170 (165-180) | 170(160-180) | 0.615* |
| sPAP, mmHg | 25.00 (23-27) | 28.00 (25-30) | 0.908* |
| RV functional parameters after exercise stress test | |||
| E/A ratio | 1.28 (1.14-1.5) | 1.37 (1.22-1.52) | 0.887* |
| E/e’ aver | 6.92 (5.46-8.00) | 11.25 (9.00-13.33) | 0.039* |
| S peak velocity, cm/s | 15 (13-16) | 14 (14-15) | 0.842* |
| AT, msec | 162.5(155-170) | 110(95-115) | 0.039* |
| sPAP, mmHg | 32.00 (30-33.75) | 38.00 (35-40) | 0.043* |
Mann-Whitney U test.
Abbreviations: RVDD – right ventricular diastolic dysfunction; LV left ventricle; RV – right ventricle; TDD-telediastolic diameter; TSD-telesystolic diameter; TDV-telediastolic volume; TSV – telesystolic volume; PW –posterior wall; RAVI – right atrium volume index; RVWT – right ventricular wall thickness; AT – acceleration time; sPAP – systolic pulmonary arterial pressure.
Fourteen percent (15/104) of the patients demonstrated right ventricular diastolic dysfunction at rest (E/e’>6). Stress-induced myocardial velocities (E/e’>6), measured 1-2minutes after peak load were higher in (82/104) - 78% of the patients in comparison to the rest (22/104) - 22%. Sixty-seven percent of the patients (67%) demonstrated stress-induced elevation of the systolic pulmonary arterial pressure (baseline 26.50±3.75mmHg; after CPET 35.00±4.38mmHg). There was not a significant difference between the two groups regarding functional (systolic and diastolic) parameters of the RV at rest. In contrast, right atrial (RA) geometry was distinctive. The mean values of RAVI in the group without stress-induced RVDD were significantly lower (16.55±1.72ml/m2) in comparison to the group with RVDD (22.27±3.19ml/m2). The same is observed regarding right wall thickness (RWT). In subjects without stress-induced RVDD, RWT was lower (5.00±0.87mm) in comparison to those with stress-induced diastolic dysfunction (6.50±1.00mm). The functional parameters that were distinctive between the groups were the AT and sPAP, measured at peak stress. (Table 2.).
LV parametersOur patients had normal LV dimensions and had preserved LV systolic function Table 2. LV wall thickness was 12mm (11-13). 62% of the subjects demonstrated evidence of left ventricular hypertrophy. In the group with stress-RVDD 67% (55/82) had LVH; in the group without stress-RVDD 45% (10/22) had LVH. If we compare the prevalence of LVH in patients with and without stress-RVDD, no statistically significant difference (p – 0.408) could be established. The left atrial and ventricular dimensions were within normal limits.
Only 30% of the patients had LV diastolic dysfunction at rest (average E/e’>8) and the remaining 70% had normal LV diastolic function at rest. In the group with stress-RVDD 33% (27/82) had LV diastolic dysfunction at rest; in the group without stress-RVDD 18% (4/22) had LV diastolic dysfunction at rest. Regarding LVDD at rest no statistically significant difference between stress-RVDD/without stress-RVDD groups was detected (p – 0.458).
A total of sixty-seven percent (67%) of all the patients had left diastolic dysfunction during exercise (E/e’>15). No significant difference in both structural and functional parameters of the LV at rest may be discerned between the patients with and without stress induced RVDD (Table 2.). Statistically significant difference is present in: LV stress E/A, LV stress E/e’ (Table 2.).
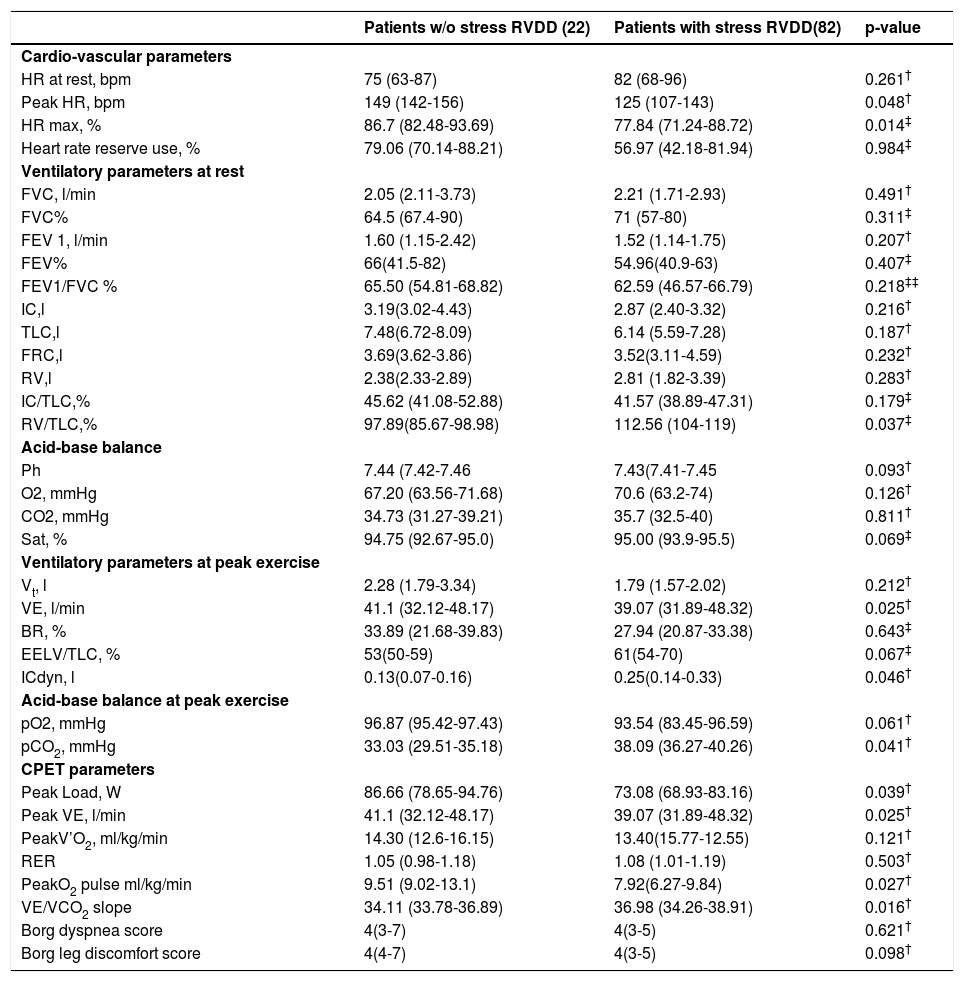
Ventilatory, cardiovascular and cardio-pulmonary exercise testing parameters of patients with and without stress RVDDThe ventilatory, cardiovascular and cardio-pulmonary exercise testing parameters during exercise in the two groups are given in Table 3. The patients with stress RVDD reached a significantly lower peak heart rate median 125 beats per minute (bpm) in comparison to those without (149bpm). The same is true for the percentage of the predicted maximum heart rate that they achieved – 77.84% vs 86.7%. The heart rate reserve respectively is below the normal values – median 56.97 (42.18-81.94) and statistically lower than that in patients without stress RVDD - median 79.06 (70.14-88.21).
Cardio-pulmonary exercise testing parameters at rest and at peak exercise of the patients with and w/o stress RVDD.
| Patients w/o stress RVDD (22) | Patients with stress RVDD(82) | p-value | |
|---|---|---|---|
| Cardio-vascular parameters | |||
| HR at rest, bpm | 75 (63-87) | 82 (68-96) | 0.261† |
| Peak HR, bpm | 149 (142-156) | 125 (107-143) | 0.048† |
| HR max, % | 86.7 (82.48-93.69) | 77.84 (71.24-88.72) | 0.014‡ |
| Heart rate reserve use, % | 79.06 (70.14-88.21) | 56.97 (42.18-81.94) | 0.984‡ |
| Ventilatory parameters at rest | |||
| FVC, l/min | 2.05 (2.11-3.73) | 2.21 (1.71-2.93) | 0.491† |
| FVC% | 64.5 (67.4-90) | 71 (57-80) | 0.311‡ |
| FEV 1, l/min | 1.60 (1.15-2.42) | 1.52 (1.14-1.75) | 0.207† |
| FEV% | 66(41.5-82) | 54.96(40.9-63) | 0.407‡ |
| FEV1/FVC % | 65.50 (54.81-68.82) | 62.59 (46.57-66.79) | 0.218‡‡ |
| IC,l | 3.19(3.02-4.43) | 2.87 (2.40-3.32) | 0.216† |
| TLC,l | 7.48(6.72-8.09) | 6.14 (5.59-7.28) | 0.187† |
| FRC,l | 3.69(3.62-3.86) | 3.52(3.11-4.59) | 0.232† |
| RV,l | 2.38(2.33-2.89) | 2.81 (1.82-3.39) | 0.283† |
| IC/TLC,% | 45.62 (41.08-52.88) | 41.57 (38.89-47.31) | 0.179‡ |
| RV/TLC,% | 97.89(85.67-98.98) | 112.56 (104-119) | 0.037‡ |
| Acid-base balance | |||
| Ph | 7.44 (7.42-7.46 | 7.43(7.41-7.45 | 0.093† |
| O2, mmHg | 67.20 (63.56-71.68) | 70.6 (63.2-74) | 0.126† |
| CO2, mmHg | 34.73 (31.27-39.21) | 35.7 (32.5-40) | 0.811† |
| Sat, % | 94.75 (92.67-95.0) | 95.00 (93.9-95.5) | 0.069‡ |
| Ventilatory parameters at peak exercise | |||
| Vt, l | 2.28 (1.79-3.34) | 1.79 (1.57-2.02) | 0.212† |
| VE, l/min | 41.1 (32.12-48.17) | 39.07 (31.89-48.32) | 0.025† |
| BR, % | 33.89 (21.68-39.83) | 27.94 (20.87-33.38) | 0.643‡ |
| EELV/TLC, % | 53(50-59) | 61(54-70) | 0.067‡ |
| ICdyn, l | 0.13(0.07-0.16) | 0.25(0.14-0.33) | 0.046† |
| Acid-base balance at peak exercise | |||
| pO2, mmHg | 96.87 (95.42-97.43) | 93.54 (83.45-96.59) | 0.061† |
| pCO2, mmHg | 33.03 (29.51-35.18) | 38.09 (36.27-40.26) | 0.041† |
| CPET parameters | |||
| Peak Load, W | 86.66 (78.65-94.76) | 73.08 (68.93-83.16) | 0.039† |
| Peak VE, l/min | 41.1 (32.12-48.17) | 39.07 (31.89-48.32) | 0.025† |
| PeakV’O2, ml/kg/min | 14.30 (12.6-16.15) | 13.40(15.77-12.55) | 0.121† |
| RER | 1.05 (0.98-1.18) | 1.08 (1.01-1.19) | 0.503† |
| PeakO2 pulse ml/kg/min | 9.51 (9.02-13.1) | 7.92(6.27-9.84) | 0.027† |
| VE/VCO2 slope | 34.11 (33.78-36.89) | 36.98 (34.26-38.91) | 0.016† |
| Borg dyspnea score | 4(3-7) | 4(3-5) | 0.621† |
| Borg leg discomfort score | 4(4-7) | 4(3-5) | 0.098† |
chi square test.
§ Abbreviations: RVDD – right ventricular diastolic dysfunction; HR – heart rate; bpm – beats per minute; FEV1 – Forced Expiratory Flow in 1sec; FVC – Forced Vital capacity; IC – inspiratory capacity; TLC – total lung capacity; FRC – functional residual capacity; RV – residual volume; Vt– tidal volume; VE – minute ventilation; EELV - end expiratory lung volume; BR – breathing reserve; V’O2 – oxygen uptake;RER – respiratory exchange ratio.
Although none of the patients in the group studied demonstrated static hyperinflation, 64 (62%) showed DH. There is a predominance of hyperinflators – 69% among the patients with stress RVDD in comparison to those without – 32% (p-0.049). In contrast, non-hyperinflators were the majority (68%) of the subjects without stress RVDD; (31%) of the patients with stress RVDD were also non-hyperinflators (p-0.042) (Table 1.).
According to the objective ATS/ACCP criteria, exercise was considered maximal in all patients. The majority of the patients 85 (82%) stopped exercise due to dyspnea. In patients with stress RVDD, dyspnea was the predominant limiting factor in 80 (98%) of the subjects. Exhausted breathing reserve, however, was detected in only 29 (35%) of them. Only 5 (23%) of the patients without stress RVDD complained of dyspnea. Exhausted breathing reserve was the limiting factor in 1 (5%) of them. Leg fatigue was the reason for exercise cessation in 19 (18%) of the patients. In those with stress RVDD leg fatigue was encountered in 2 (2%), while 17 (77%) of the patients without stress RVDD reported leg fatigue (Table 3.).
The patients with stress RVDD achieved lower load, showed lower minute ventilation at peak load, lower oxygen pulse, lower peak’VO2 and lower’ VO2 on VAT in comparison to the subjects without stress RVDD group. The patients with stress RVDD demonstrated higher VE/VCO2 slope and lower PetCO2 (Table 3.).
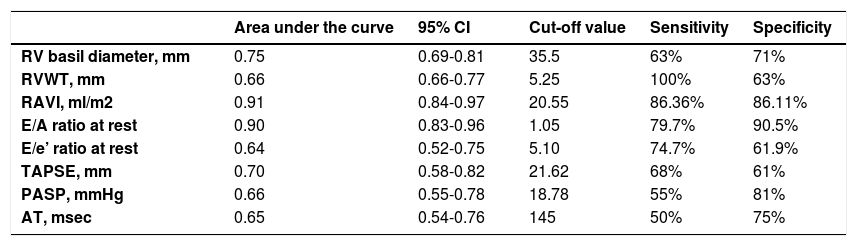
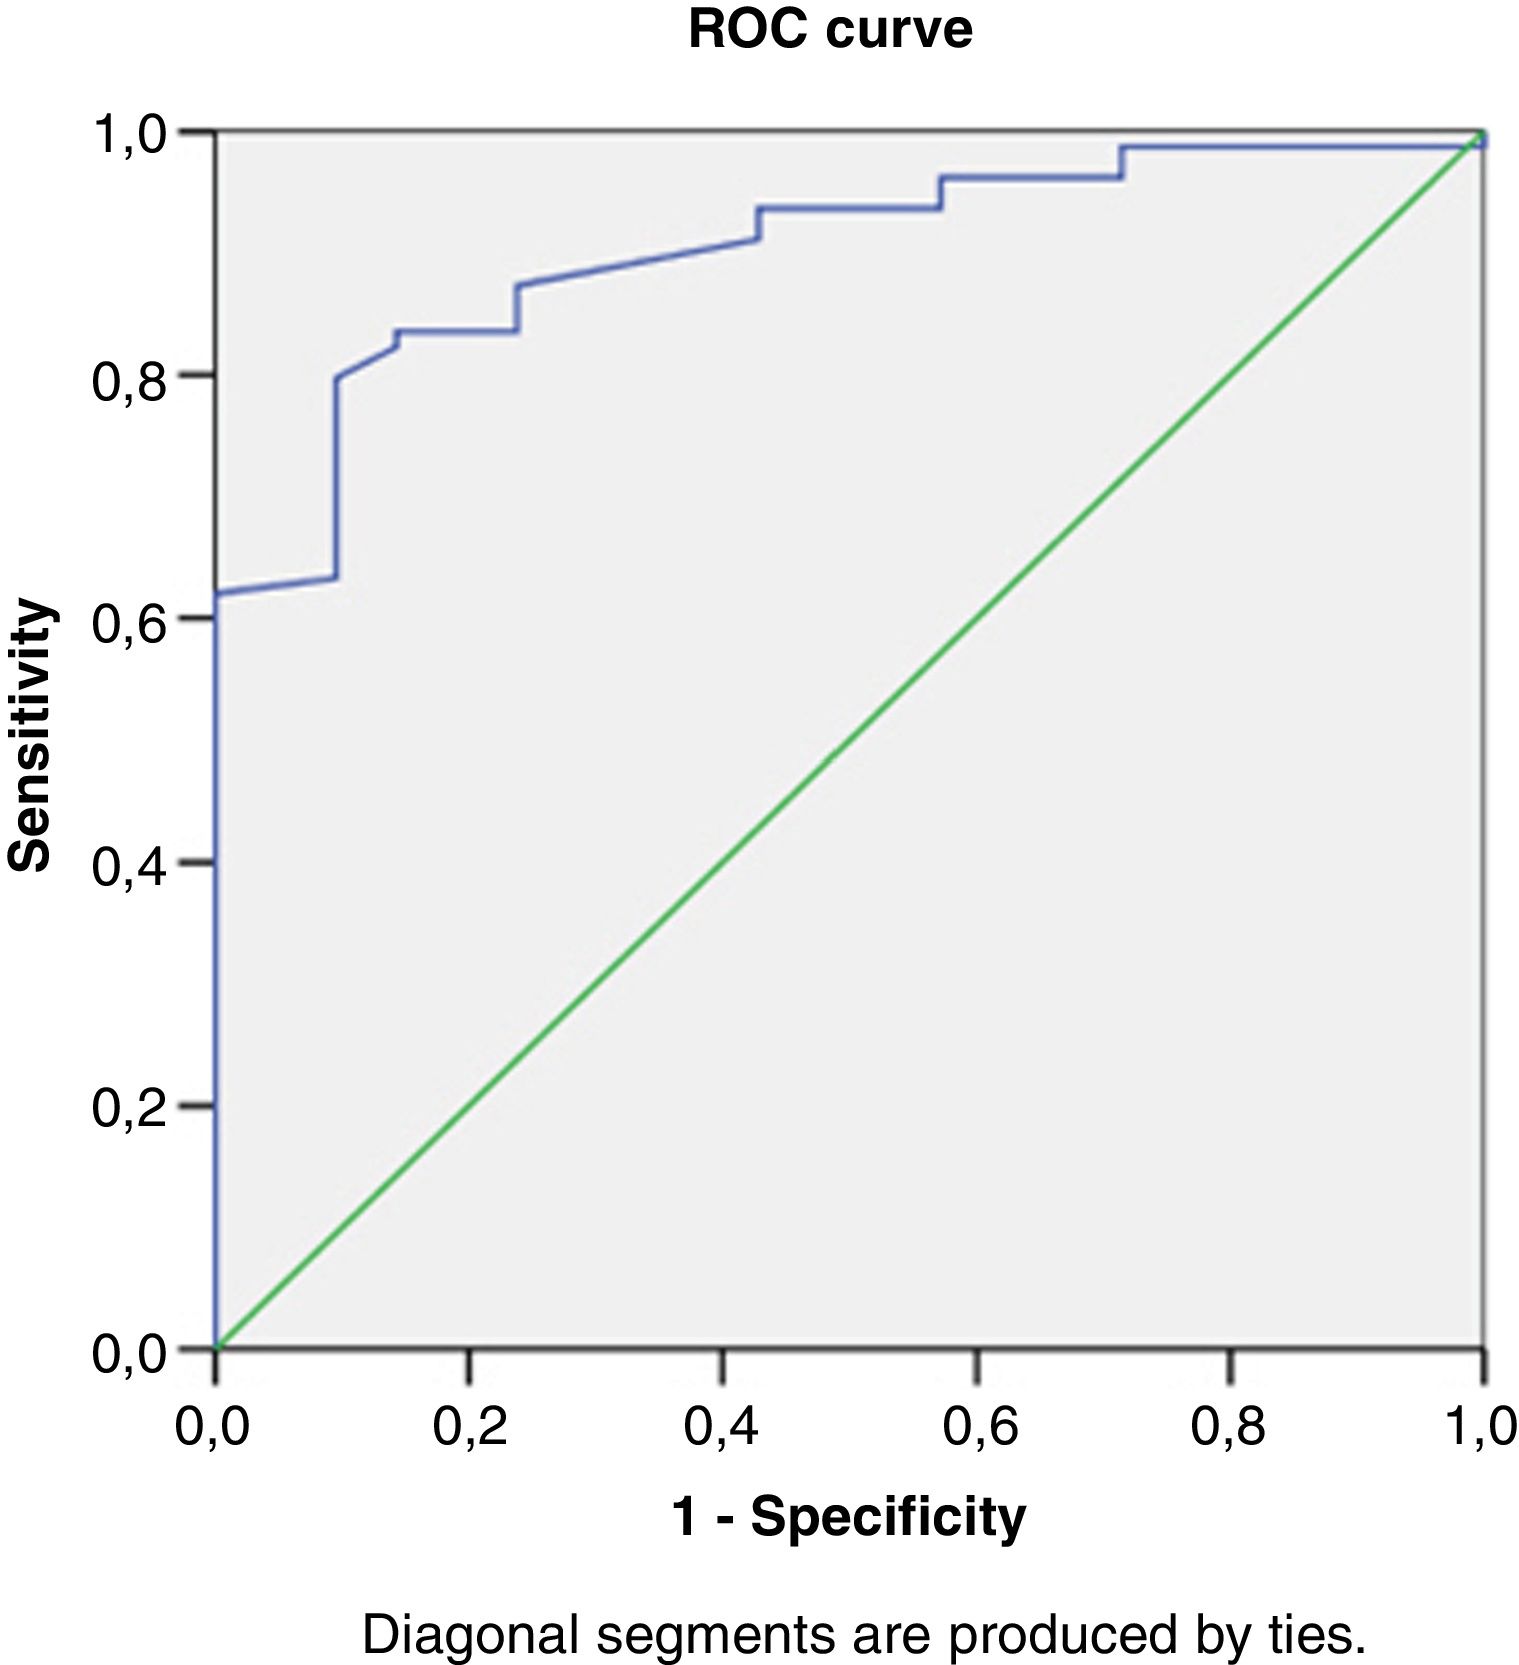
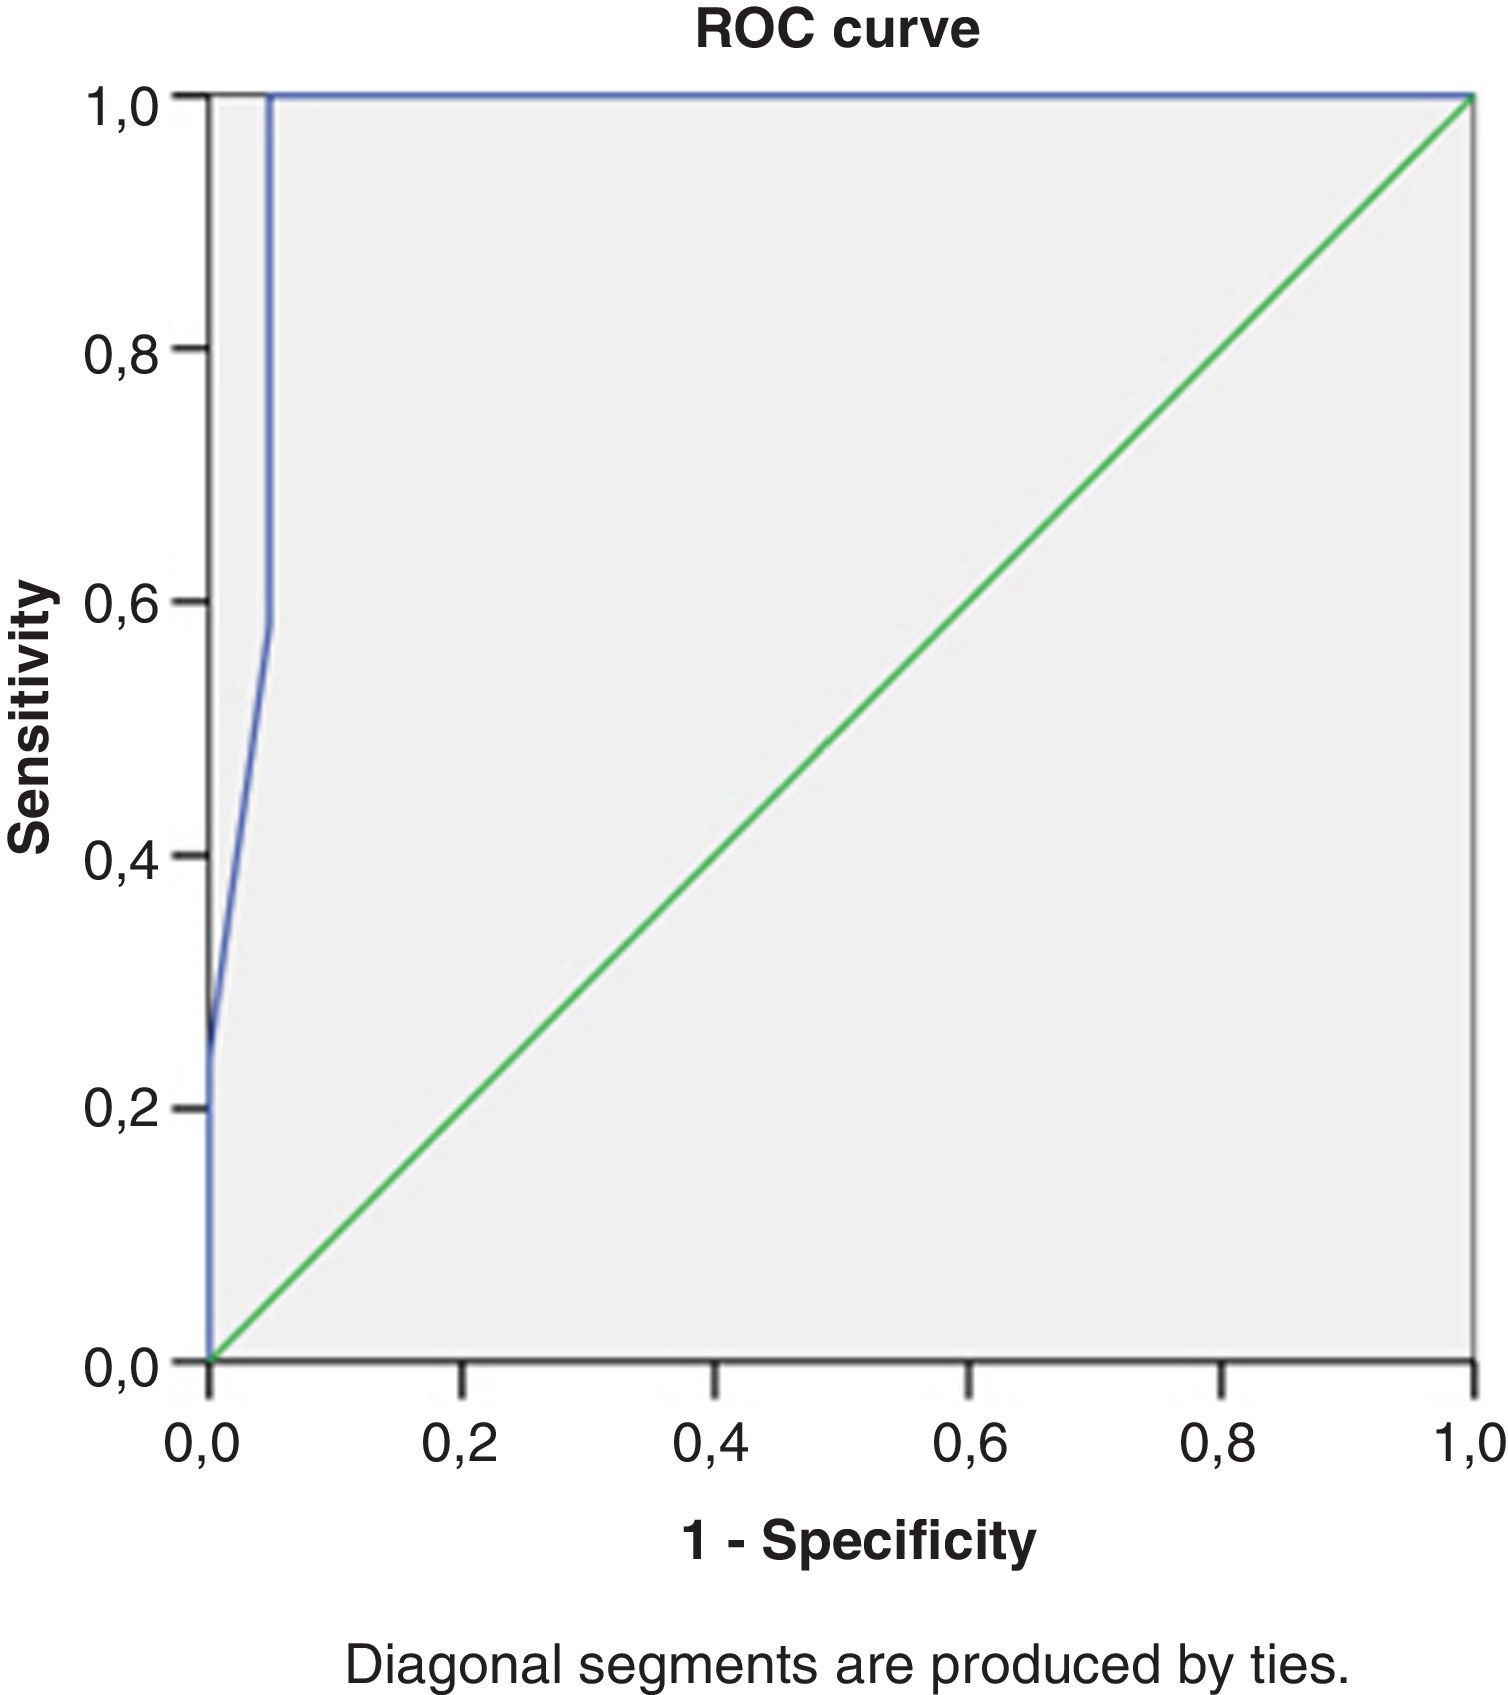
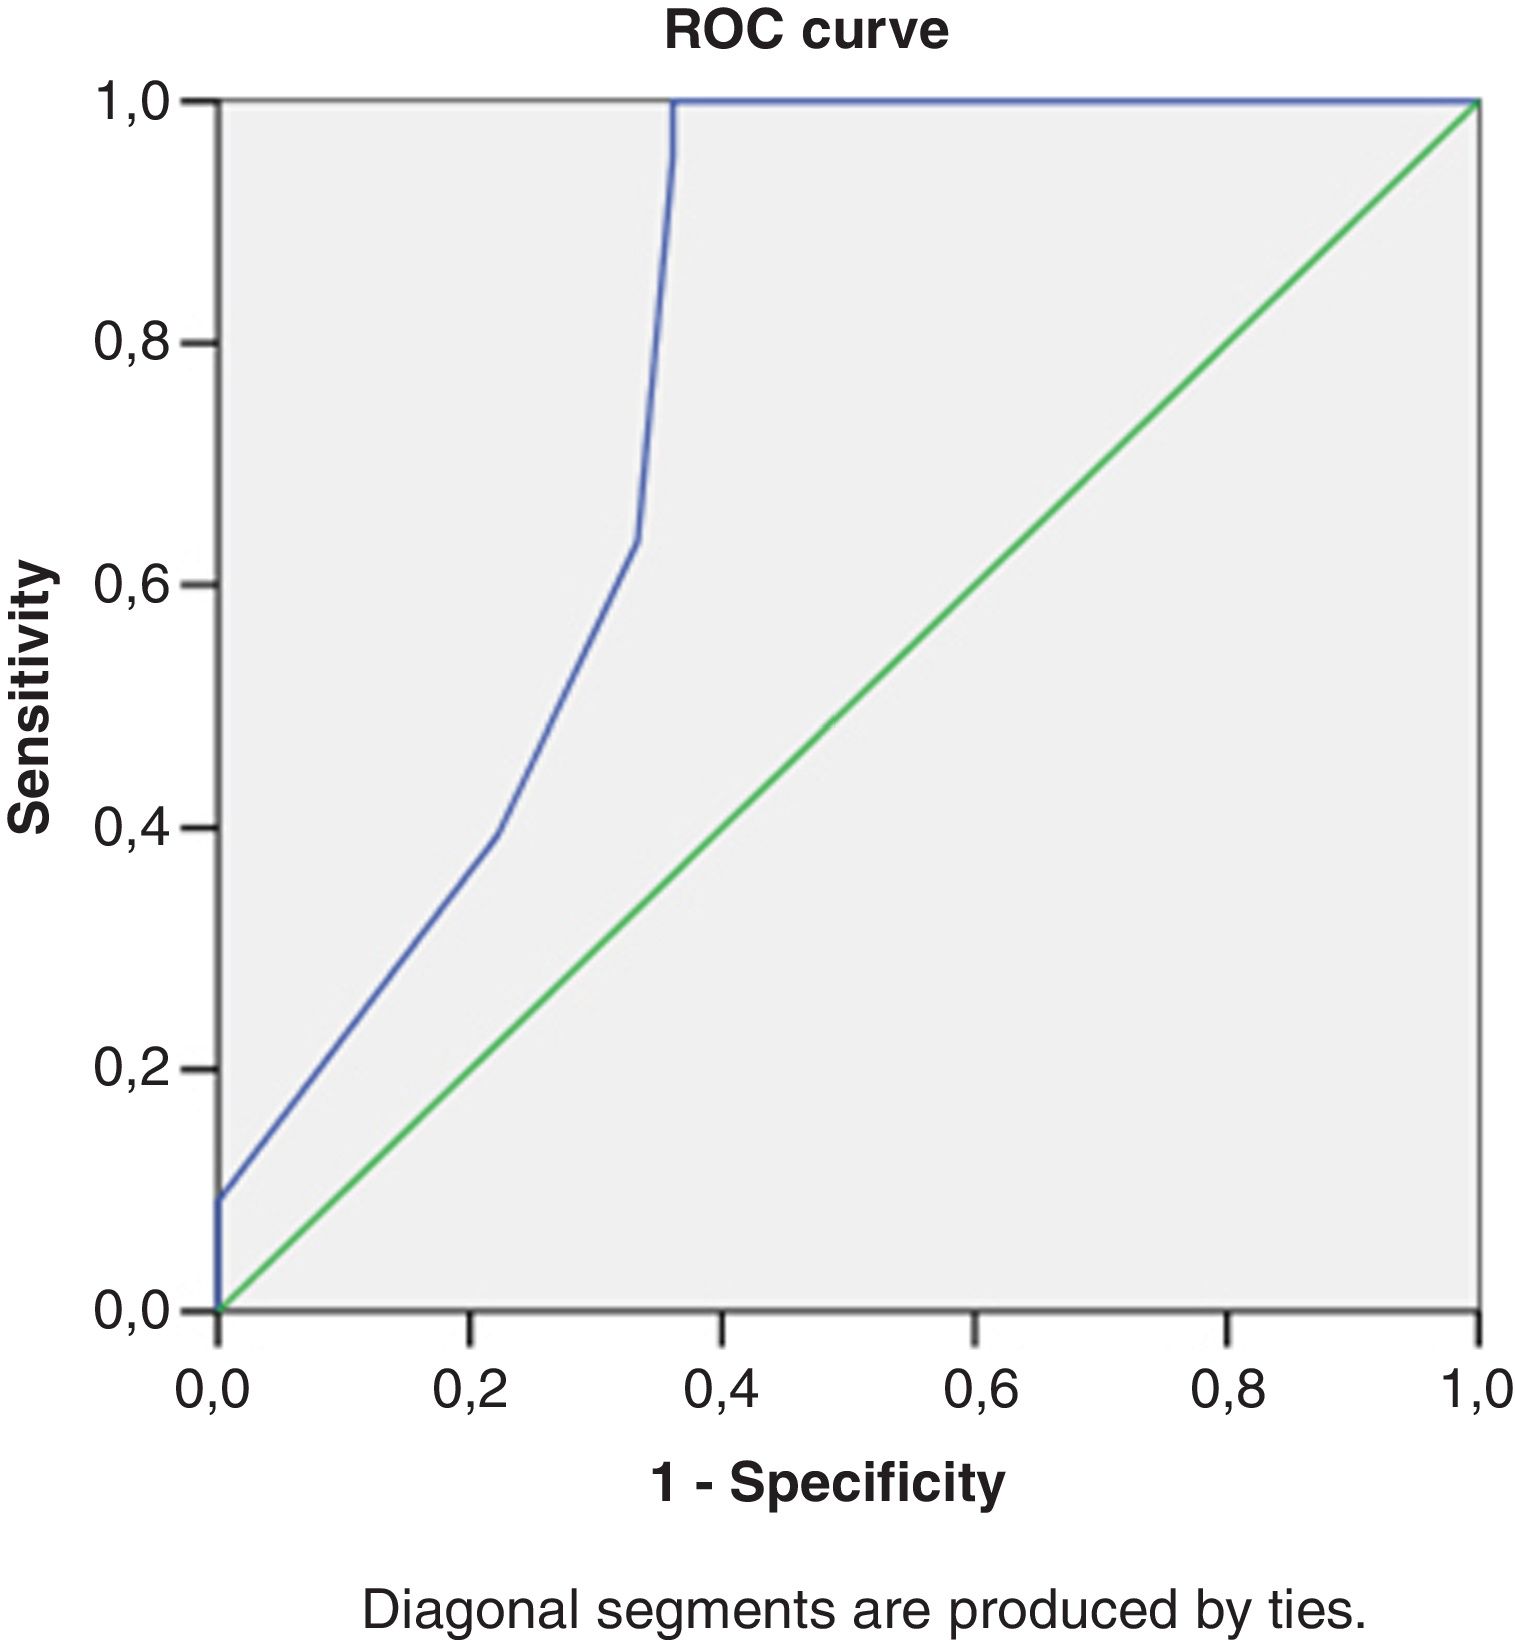
Right heart structural abnormalities and stress RVDDROC analysis was performed in order to assess the predictive value of the right heart structural parameters that are usually measured in clinical practice and the stress induced RVDD (stress E/e’>6). Results are shown in (Table 4.) RAVI and RVWT seem to be the parameters that have the best sensitivity and specificity. A cut- off value of 20.55ml/m2 for RAVI may discriminate the patients with stress RVDD with a sensitivity of 86.36% and specificity 86.11%; E/A ratio at rest (cut-off 1.05) discriminates stress RVDD patients with sensitivity 79.7%; specificity 90.5%). RVWT of 5.25mm is discriminative with a sensitivity 100% and specificity 63%. ROC curves are presented in Figs. 2–4.
Receiver operating characteristic curve analysis using RV echocardiographic parameters at rest to identify subjects with an stress RV E/e’>6.
| Area under the curve | 95% CI | Cut-off value | Sensitivity | Specificity | |
|---|---|---|---|---|---|
| RV basil diameter, mm | 0.75 | 0.69-0.81 | 35.5 | 63% | 71% |
| RVWT, mm | 0.66 | 0.66-0.77 | 5.25 | 100% | 63% |
| RAVI, ml/m2 | 0.91 | 0.84-0.97 | 20.55 | 86.36% | 86.11% |
| E/A ratio at rest | 0.90 | 0.83-0.96 | 1.05 | 79.7% | 90.5% |
| E/e’ ratio at rest | 0.64 | 0.52-0.75 | 5.10 | 74.7% | 61.9% |
| TAPSE, mm | 0.70 | 0.58-0.82 | 21.62 | 68% | 61% |
| PASP, mmHg | 0.66 | 0.55-0.78 | 18.78 | 55% | 81% |
| AT, msec | 0.65 | 0.54-0.76 | 145 | 50% | 75% |
Abbreviations: RVDD – right ventricular diastolic dysfunction; RAVI – right atrium volume index;RVWT – right ventricle wall thickness;AT – acceleration time; PASP –pilmonary arterial systolic pressure;AT – acceleration time;TAPSE – tricuspidal annular plane systolic excursion.
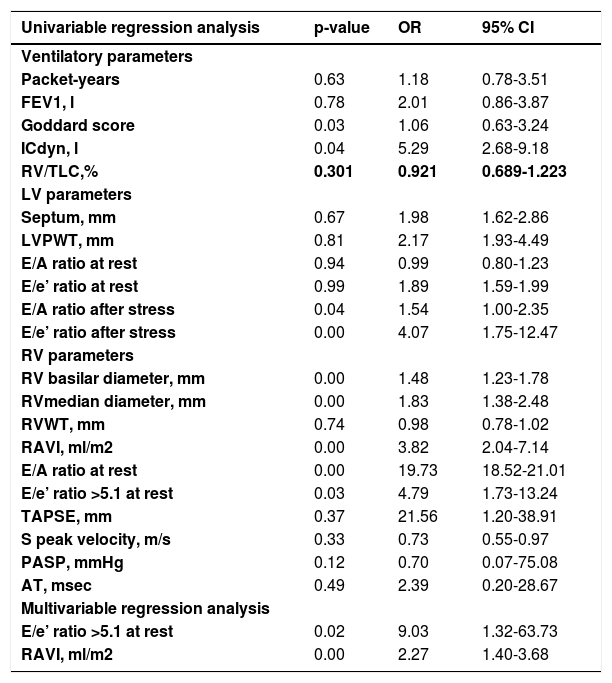
To assesss the association between LV structural (septum and posterior wall thickness) and functional parameters (LV E/A, LV E/e’ at rest; LV E/A, LV E/e’ after stress) and stress induced RVDD, univariate regression analysis was performed (Table 5.). This was also performed with the RV structural parameters and their selected cut-off values. From all the variables only the cut-off value of rest RV E/e’>5.1 is statistically significant and clinically applicable with the odd ratio for stress-RVDD – 4.79; (95% CI - 1.73-13.24). If we apply univariate regression analysis with the echocardiographic measurements as quantitative parameters the RV basilar and median diameter, RAVI, rest RV E/e’ ratio, stress LV E/A, stress LV E/e’, may be used as predictors (Table 5.). The RV E/A ratio showed the highest odds ratio 19.73; (95% CI – 18.52-21.01); followed by RAVI - odds ratio 3.82; (95% CI – 2.04 -7.14). In multivariate regression analysis with a forward step approach RAVI and rest RV E/e’>5.1 remained independent predictors for stress- RVDD. The combination of these two variables predicts stress-RVDD with the accuracy of 92%. This association was independent of LV diastolic dysfunction (LV E/A at rest; LV E/e’ at rest; stress LV E/A; stress LV E/e’), lung function (FEV1), ICdyn, Goddard score, age, sex, and BMI, taken as covariates.
Logistic regression analysis between ventilatory and echocardiographic parameters and stress RV E/e’.
| Univariable regression analysis | p-value | OR | 95% CI |
|---|---|---|---|
| Ventilatory parameters | |||
| Packet-years | 0.63 | 1.18 | 0.78-3.51 |
| FEV1, l | 0.78 | 2.01 | 0.86-3.87 |
| Goddard score | 0.03 | 1.06 | 0.63-3.24 |
| ICdyn, l | 0.04 | 5.29 | 2.68-9.18 |
| RV/TLC,% | 0.301 | 0.921 | 0.689-1.223 |
| LV parameters | |||
| Septum, mm | 0.67 | 1.98 | 1.62-2.86 |
| LVPWT, mm | 0.81 | 2.17 | 1.93-4.49 |
| E/A ratio at rest | 0.94 | 0.99 | 0.80-1.23 |
| E/e’ ratio at rest | 0.99 | 1.89 | 1.59-1.99 |
| E/A ratio after stress | 0.04 | 1.54 | 1.00-2.35 |
| E/e’ ratio after stress | 0.00 | 4.07 | 1.75-12.47 |
| RV parameters | |||
| RV basilar diameter, mm | 0.00 | 1.48 | 1.23-1.78 |
| RVmedian diameter, mm | 0.00 | 1.83 | 1.38-2.48 |
| RVWT, mm | 0.74 | 0.98 | 0.78-1.02 |
| RAVI, ml/m2 | 0.00 | 3.82 | 2.04-7.14 |
| E/A ratio at rest | 0.00 | 19.73 | 18.52-21.01 |
| E/e’ ratio >5.1 at rest | 0.03 | 4.79 | 1.73-13.24 |
| TAPSE, mm | 0.37 | 21.56 | 1.20-38.91 |
| S peak velocity, m/s | 0.33 | 0.73 | 0.55-0.97 |
| PASP, mmHg | 0.12 | 0.70 | 0.07-75.08 |
| AT, msec | 0.49 | 2.39 | 0.20-28.67 |
| Multivariable regression analysis | |||
| E/e’ ratio >5.1 at rest | 0.02 | 9.03 | 1.32-63.73 |
| RAVI, ml/m2 | 0.00 | 2.27 | 1.40-3.68 |
Abbreviations: FEV1 – Forced Expiratory Volume in 1sec; ICdyn – dynamic hyperinflatio; RVDD – right ventricular diastolic dysfunction; LV left ventricle;RV – right ventricle; LVPWT – left ventricular posterior wall thickness; RVWT – right ventricular wall thickness;RAVI – right atrium volume index;AT – acceleration time; PASP –pulmonary arterial systolic pressure;AT – acceleration time;TAPSE – tricuspidal annular plane systolic excursion.
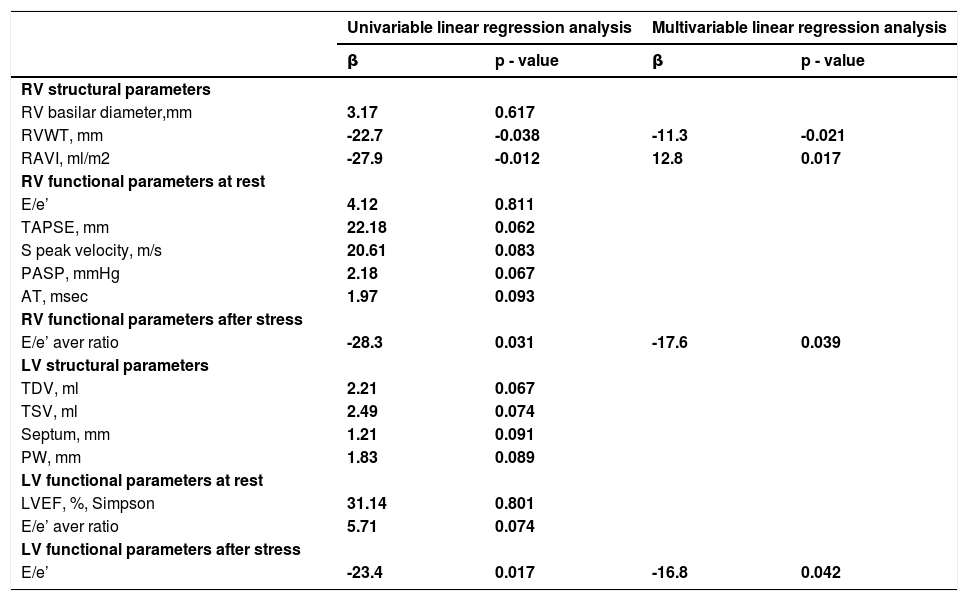
COPD patients with stress-RVDD achieved lower walking distance during the 6MWT. We applied univariate regression analysis between LV and RV echocardiographic parameters at rest and the 6MWT (Table 6.). In univariable analysis the structural parameters of the RV were associated with the 6MWT. A 1mm change in RVWT was associated with a 22.7meter decline in the 6MWT (b=- 22.7 m; p=0.038); RAVI (b=-27.9 m; p=0.012). The RV functional parameters at rest (TAPSE, S-peak velocity, PASP, AT, RV E/e’ ratio), LV structural and LV functional echocardiographic parameters at rest were not associated with the 6MWT. In contrast, stress induced LVDD (stress LV E/e’) and stress induced RVDD (stress RV E/e’) correlated to the walking distance (Table 6.) A unit change in LV E/e’ was associated with a 23.4 meter decline in the 6MWT (b=- 23.4m; p=0.017); A unit change in RV E/e’ was associated with a 28.3meter decline in the 6MWT (b=- 28.3m; p=0.031).
Association between echocardiographic parameters and 6MWT.
| Univariable linear regression analysis | Multivariable linear regression analysis | |||
|---|---|---|---|---|
| β | p - value | β | p - value | |
| RV structural parameters | ||||
| RV basilar diameter,mm | 3.17 | 0.617 | ||
| RVWT, mm | -22.7 | -0.038 | -11.3 | -0.021 |
| RAVI, ml/m2 | -27.9 | -0.012 | 12.8 | 0.017 |
| RV functional parameters at rest | ||||
| E/e’ | 4.12 | 0.811 | ||
| TAPSE, mm | 22.18 | 0.062 | ||
| S peak velocity, m/s | 20.61 | 0.083 | ||
| PASP, mmHg | 2.18 | 0.067 | ||
| AT, msec | 1.97 | 0.093 | ||
| RV functional parameters after stress | ||||
| E/e’ aver ratio | -28.3 | 0.031 | -17.6 | 0.039 |
| LV structural parameters | ||||
| TDV, ml | 2.21 | 0.067 | ||
| TSV, ml | 2.49 | 0.074 | ||
| Septum, mm | 1.21 | 0.091 | ||
| PW, mm | 1.83 | 0.089 | ||
| LV functional parameters at rest | ||||
| LVEF, %, Simpson | 31.14 | 0.801 | ||
| E/e’ aver ratio | 5.71 | 0.074 | ||
| LV functional parameters after stress | ||||
| E/e’ | -23.4 | 0.017 | -16.8 | 0.042 |
Abbreviations: RVDD – right ventricular diastolic dysfunction; LV left ventricle; LVPW –left; RV – right ventricle; RVWT – right ventricular wall thickness; RAVI – right atrium volume index; PASP –pulmonary arterial systolic pressure;AT – acceleration time;TAPSE – tricuspidal annular plane systolic excursion; TSV - telesystolic volume; TDV – telediastolic volume; PW – posterior wall.
In multivariate analysis with covariates LV diastolic dysfunction (LV E/A at rest; LV E/e’ at rest; stress LV E/A; stress LV E/e’), lung function (FEV1), ICdyn, Goddard score, age, sex, and BMI, only RAVI, RWT, stress RV E/e’, stress LV E/e’ remained independent predictors of 6MWT (Table 6.).
In multivariable analysis a 1mm change of RVWT was associated with a 11.3 meter decline in the 6MWT (b=-11.3m; p=0.021). This association was independent of LV diastolic dysfunction (LV E/A at rest; LV E/e’ at rest; stress LV E/A; stress LV E/e’), lung function (FEV1), ICdyn, Goddard score, age, sex, and BMI, taken as covariates. The same is observed regarding RAVI (b=-12.8 m; p=0.017) - a 1ml/m2 increase of RAVI was associated with a 12.8 meter decline in the 6MWT.(Table 6.)
DiscussionIn this study we prove that: 1) 78% of our patients showed stress induced RVDD, while 14% of them had RVDD at rest; 2) patients with stress RVDD demonstrated a higher prevalence of dynamic hyperinflation ICdyn (69%) and moderate (Goddard II) emphysema (69%); 3) patients with stress RVDD performed with worse sub-maximal exercise capacity (6-MWT), they achieved lower load, lower peak’VO2, O2 pulse, higher VE/’VCO2 slope and lower PetCO2 during CPET; 4) in non-severe COPD patients RAVI and rest RV E/e’ ratio>5.1 are independent predictors for stress RVDD; 5) in non-severe COPD patients with stress RVDD, RAVI and RVWT are independent predictors for diminished exercise capacity (6-MWT).
COPD is a condition of augmented vessel vulnerability and arterial stiffness, which do not correspond to the smoking burden and pack-years. Arterial stiffness triggers myocardial fibrosis even without overt cardiovascular disease.30–32 Intrathoracic pressure oscillations during breathing provoke additional wall stress to the heart of COPD patients, which may be the sole trigger for both right and left chamber diastolic remodeling.33,34
Although cor pulmonale is classically assumed as the major cardio-vascular manifestation of COPD, subclinical abnormalities may be found even in mild form of the disease.35,36 MRI studies claim that even invasive PAP measurement delays the diagnosis of lung vascular pathology in the general population.14,15,37 This is also confirmed in COPD patients.38 Hilde et al, have investigated ninety-eight subjects by right heart catheterisation at rest and during exercise. Haemodynamic effort changes in the pulmonary circulation have revealed abnormal physiological responses in the majority of COPD patients.38
We support this, demonstrating that exercise exertion in non-severe COPD patients without pulmonary arterial hypertension at rest facilitates the detection of right ventricular-arterial decoupling. After symptom limited incremental stress protocol, 78% of our patients show signs of RVDD. Patients with stress RVDD have RV hypertrophy and larger RAVI, compared to those without. None of these structural parameters, correlated to the values of mPAP at rest which is routinely accepted as the clinical parameter associated with RV pathology. The data presented by Cuttica and Hilde et al.39,40 is similar; they revealed that RV hypertrophy, dilation and systolic dysfunction, are present even with a slight increase of mPAP (18±3mm Hg).39 Cuttica et al, detect increased RV wall thickness and right atrial area in non-severe COPD with slightly elevated sPAP (mean sPAP 44.16±16.1mmHg).40
In our study, RAVI is also significantly lower in COPD subjects without RVDD in comparison to COPD patients with RVDD. Such findings have been observed in animal models and later validated in patients with respiratory diseases.41–43 Sallach et al, have also reported that RAVI has been related more to E/A ratio, rather than to the elevated E/e’ ratio.44 In contrast, Agoston Coldea et al, have not detected an association with E/A ratio, but a weak relation between RAVI and E/e’ has been established.45 The different results are probably attributed to the different stages of COPD, where different degrees of diastolic dysfunction develop. The conditions under which RVDD is found (stress echocardiography or echocardiography at rest) could also be a possible explanation of the discrepancy.
The link between RVDD and COPD is complex and probably evolves as a result of various mechanisms - mechanical/functional (deterioration in FEV1, emphysema, hyperinflation),10–12 biological (systemic inflammation, hypoxemia, endothelial dysfunction)46 and neuro-humoral (excess sympathetic nerve activity).47
The pathophysiological consequences of diastolic dysfunction are associated with abnormalities of RV diastolic compliance and relaxation. They limit the RV filling and aerobic capacity regardless of the RV function.48 This is of special clinical importance in COPD, where stress RVDD may remain hidden under the umbrella of COPD associated exertional dyspnea. However, only 35% of our COPD patients with stress RVDD demonstrate exhausted breathing reserve. Thus, in non-severe COPD stress RVDD may itself contribute to exertional dyspnea and diminished physical activity, which is demonstrated by our results. The COPD patients with stress RVDD achieved lower load during cardio-pulmonary exercise testing; performed with lower peak VO2, lower oxygen pulse and higher VE/VCO2 slope. They demonstrated a higher PetCO2 and lower peak HR and diminished heart rate reserve in comparison to those without.
RVDD may not only limit aerobic capacity, but also correlate to COPD exacerbation rate. The frequency of exacerbations before or after the study were not in the scope of our study, however, the more common use of ICS in the stress RVDD subjects, leads us to assume that exacerbations are more likely in RVDD/COPD patients. According to the study protocol no change in therapy during or three months before the study have been undertaken, which also supports our assumption. Though no causality could be stated, it is possible to hypothesise that like pulmonary hypertension, pulmonary vasculopathy and RVDD may be independent factors for COPD exacerbation and progression.49
Augmented vessel vulnerability and arterial stiffness in COPD has recently been reported as independent phenomenon which does not correspond to smoking burden and pack-years.46 We confirm this, reporting an even higher incidence of former and never smokers among the stress RVDD group. The data, regarding the link between emphysema, dynamic hyperinflation, smoking status and cor pulmonale is similar. Emphysema and DH have been correlated with diminished end-diastolic RV dimensions and RV output, independent from the smoking status (former, current or never smoker).10–12 Emphysema and hyperinflation act synergistically, especially during exercise (dynamic hyperinflation) – predisposing to RV diastolic dysfunction - reducing the venous return, impairing RV filling and decreasing the RV dimensions – “cor pulmonale parvus”.10–12 In our study, however, neither emphysema (Goddard score), nor DH corresponded independently to worse RV compliance and relaxation (stress RV E/e’ >6) during load. In univariate analysis they were predictors for stress RVDD, but after adjustments both parameters lost significance. Despite the statistically significant difference in RV/TLC ratio between stress/no stress RVDD subjects, it did not correlate to stress RV E/e’ in univariate analysis. Moreover, under static conditions none of our patients demonstrated real hyperinflation. Thus, body-plethysmography and static lung volumes are insufficient for the assessment of the complex lung-heart interreaction during exercise.
It is worth noting that in our modeate COPD patients no static hyperinflagion may be observed. Our statement refers to the cardio-vascular impact of moderate emphysema (Goddard II is predominant – 69% of the subjects) and DH in mild-to-moderate COPD, where these ventilatory abnormalities may not be accompanied by such significant intra-thoracic pressure changes and their direct haemodynamic and mechanistic consequences on the cardio-vascular performance may not be as profound as in moderate-to-severe COPD stages.10–12 Moreover, not all studies have been consistent regarding the link between dynamic hyperinflation and worse cardiac performance during exercise.50 It is suggested that the decline in cardiac output more closely parallels alterations of intra-thoracic pressure rather than the changes in lung volume.51 Thus, it is reasonable to assume that the pathophysiological mechanisms, responsible for cardiac performance during exercise are multi-dimensional and cannot be limited to a single factor.
The subjects in our study had preserved left ventricular systolic function, so it is clear that the right heart structural changes we detected are independent of LV systolic function. As no right heart catheterization was performed, it is difficult to differentiate changes related to LV diastolic dysfunction from primary pulmonary vascular disease.
The functional impact of pulmonary vascular pathology in COPD, however, appears to be independent of the distinction between pulmonary vascular disease and pulmonary venous hypertension, related to left diastolic heart failure. The mean pulmonary artery pressure in both cases, has been associated with a lower 6-MWT, independent of the left heart filling pressures. Furthermore, both primary pulmonary vascular disease and pulmonary venous hypertension due to left diastolic heart dysfunction had negative impact on transplanted patients, compared to subjects with normal pulmonary hemodynamics.52
Last but not least, the detection of RVDD is of clinical importance because it may be an independent factor for limited physical activity in the general population and in COPD, in particular.8,36 Due to the different COPD groups and diagnostic approaches, diverse results of the role of RV structural and echocardiographic parameters on physical capacity have been reported. Cuttica et al, have found a correlation between RVWT, right atrial area and diminished 6 MWT, independent from the lung function.39 Speckle-tracking analysis assumes tricuspid regurgitation as the only predictor of exercise tolerance.35 In contrast, Gokdenis et al, state that RVFW-S is the only marker responsible for 6 MWT.34
Our subjects with RVDD achieved shorter 6MWT. None of the LV structural or functional parameters at rest was associated with the 6MWT. The same is observed regarding the RV functional parameters at rest (PASP, TAPSE, S-peak velocity, AT). In contrast, RAVI, RVWT, stress RV E/e’, stress LV E/e’ were associated with the 6MWT.
Despite being performed under stress conditions our findings correspond to the results of Fenster et al, who performed a study in 51 moderate-to-severe COPD patients (mean FEV1<50%). Authors demonstrated that in more advanced stages of COPD, RVDD at rest, may be a factor for decremented physical activity, independent from LVDD at rest, age, sex, BMI or FEV1.53 The data reported by us is also similar to the findings of Cuttica et al. They analysed 74 non-severe COPD patients (FEV1>65%). Authors did not perform stress echocardiography and did not analyse RV or LV diastolic parameters at rest. They state that RV structural parameters (RVWT and RAVI), suggestive of RV diastolic dysfunction, are independent predictors for 6MWT, irrespective of age, sex, BMI and FEV1.39
According to our study even in the absence of PH at rest, COPD patients may perform with worse exercise capacity due to underlying pulmonary vasculopathy, which may remain undiagnosed and untreated for a long time. Hypoxia, inflammation, microvascular ischemia, and obesity may the triggers for this.54,55 Thus, stress RVDD may develop as a consequence of COPD even in the absence of clinically manifested COPD-related pulmonary vascular disease. Non-severe COPD patients with normal PAP at rest probably experience excessive haemodynamic PAP changes during exertion. This may gradually result in RV structural changes that may be more sensitive indicators for exercise pulmonary haemodynamic abnormalities. The early identification of stress-RVDD may help with the diagnosis of a specific COPD phenotype which is associated with reduced exercise capacity. This is consistent with prior reports of PH in advanced COPD having distinct prognosis. The detection of functional abnormalities responsible for patient centered outcomes may lead to novel therapeutic targets that impact a specific disease phenotype.
Study limitationsThe main limitations of this study are: 1) the relatively small sample size; 2) coronary artery disease may not be excluded as neither invasive (coronary angiography), nor sophisticated imaging modalities (exercise single photon emission computed tomography (SPECT) - myocardial perfusion imaging (MPI)) were performed; 3) COPD patients experience enhanced pressure swings during the respiratory cycle and measurements were performed at the end of expiration, which may influence the results; 4) we do not have invasive measurement of sPAP; 5) measurements were acquired in the early recovery period (approximately 2min) after symptom-limited exercise. The timeline of changes of the pulmonary and intrathoracic pressures during the brief time interval from peak exercise to their measurement in early recovery is not well known and underestimation is possible;5) the cross-sectional design does not establish causality.
ConclusionIn conclusion, we demonstrate that in non-severe COPD patients a high prevalence of stress induced RVDD is detected. RAVI and rest RV E/e’>5.1 are the best predictors for stress E/e’>6; RAVI and RVWT are associated with decrements in exercise capacity. The early diagnosis and proper management of subclinical RVDD may be a step forward in the prevention of the cardio-vascular complications in non-severe COPD patients.
Our statements are not definite, but a challenge for prospective studies with larger samples.
The investigation was performed in Medical University, Sofia; University Hospital “Saint Sophia”, First Therapeutic Clinic
The design of the study was proposed by all authors. All authors have equally contributed to the recruitment and selection of patients. R.Cherneva performed the spirometry and the cardio-pulmonary exercise testing and Zh. Cherneva – echocardiography at rest and at peak stress. All authors have equally contributed to analysis of the data and writing of the manuscript. There was no funding.
All the authors state no conflict of interests and leave the copyright of the article if accepted.
Ethics approval for the study protocol was received from the Ethics Committee of the Medical University, Sofia protocol 5/12.03.2018.
Ethical responsibilitiesNone.
We acknowledge the valuable support of Professor Vukov, who performed the statistical analysis.