


Silicosis is an irreversible and incurable disease. Preventive measures to eliminate exposure are the only effective way to reduce morbidity and mortality. In such situations, having a biomarker for early diagnosis or to predict evolution would be very useful in order to improve control of the disease. The elevation of serum angiotensin-converting enzyme (sACE) in silicosis has been described in previous studies, although its relationship with severity and prognosis is not clear.
AimsTo determine the levels of sACE in a cohort of patients with exposure to silica dust with and without silicosis, and to assess their impact on the prognosis of the aforementioned patients.
MethodProspective observational study on patients treated in a silicosis clinic from 2009 to 2018. sACE levels and pulmonary function tests were performed. Radiological progression was assessed in patients who had already had 2 X-rays of the thorax and / or two CT scans with at least a 1-year interval, from the time of inclusion in the study.
ResultsA total of 413 cases of silicosis were confirmed, as well as 73 with exposure to silica dust but without silicosis. The mean sACE level for healthy subjects was 27.5±7.3U/L, for exposed patients without silicosis it was 49.6±24.2U/L, for simple silicosis it was 57.8±31,3U/L and for complicated silicosis it was 74.5±38.6U/L. Patients with a higher sACE generally progressed radiologically during follow-up (73.3±38.0 vs. 60.4±33.7; p<.001) and so the category of silicosis changed (73,9±38.1 vs. 62.5±34.6; p<.021).
ConclusionssACE was elevated in patients with silicosis, and the greater its severity, the higher it was, which is associated with disease progression measured radiologically or as a category change of silicosis.
Silicosis is a chronic interstitial lung disease caused by prolonged exposure to free crystalline silica dust. It is a type of pneumoconiosis and is included in the list of interstitial lung diseases (ILD).1 There have been recent reports of new exposures to silica dust, giving rise to outbreaks of silicosis in many countries.2 In Spain there is no national registry of silicosis but the statistics from the National Institute of Silicosis (NIS) show that it has increased annually since 2008, not just from coal mining but also from other industries such as those which handle granite, slate and artificial conglomerates.3 In 2018, out of the 270 cases reported by the NIS, 46% were from these sectors and came from our region (Galicia).4 Silicosis diagnosis is given upon finding radiological anomalies, which is not a very accurate method for detecting whether there are silicosis nodules in the lung tissue5,6 after a histopathological examination has been performed. Although there are steps in place to standardise Computed Tomography (CT) for silicosis diagnosis,7 it is considered crucial to have a biomarker available for early detection and/or to predict its progression and that of other respiratory diseases.8-10 There is still no biomarker identified that would be useful to diagnose and prognose patients with silicosis.9,10
The macrophage plays a key role in silicosis pathophysiology. Indeed, it is likely that silicosis is a consequence of alveolar macrophage activation scavenging inhaled RCS. Macrophages alongside endothelial cells are considered the main sources of increased serum ACE levels.11
In addition, ACEs are upregulated in several diseases characterized by granuloma, which include silicosis. Macrophages within the granuloma were reported to have an approximately sevenfold increase in ACE mRNA compared with kidney macrophages in an animal model.12 The increase in activity of ACEs in serum is considered to be a marker of lung injury in a number of pulmonary diseases.11 Most ACEs are bound to the plasma membranes of the endothelial cells, particularly in pulmonary vessels, epithelial cells (such as those of the proximal renal tubule), neuroepithelial cells and the prostate carrying out their main role of blood pressure homeostasis. Their proteolytic split13 leads to the release and appearance of soluble ACEs in locations such as blood, urine, lymph, pulmonary edema, and cerebrospinal fluid. Lieberman,14 in 1975, observed an increase in ACEs in approximately two-thirds of patients with sarcoidosis. It was subsequently shown that it rose in other granulomatous diseases such as tuberculosis, fungal infections, Gaucher disease and asbestosis,15 which puts a great deal of limitation on the use of ACE in sarcoidosis diagnosis.
The majority of studies did not find any correlation between ACE levels or sarcoidosis activity16 and severity.17 Since 1978,18 when the increase of ACEs in silicosis was first reported, several studies have been published that have associated them with silicosis,19,20 with disparate results as regards severity,20,21 while only one study has evaluated ACE behaviour and its relationship with the progression of fibrosis and of the disease.21
No tools are currently available that can enable silicosis progression to be easily monitored.22 The aim of this study is to determine ACE levels in a patient cohort exposed to silica dust (with and without silicosis), and in a group of non-exposed subjects, in order to subsequently evaluate whether the results of the study can be used as predictors of disease progression.
MethodA prospective study of a cohort of Caucasian subjects was conducted in the period from January 2009 to December 2018, all of whom had been exposed to silica or diagnosed with silicosis based on the guidelines for silicosis diagnosis and monitoring.1 A control group was also included, consisting of hospital workers not exposed to silica with similar ages and smoking history to the cohort subjects.
Anybody who had suffered from an acute illness in the previous three months, who had been diagnosed with sarcoidosis, for whom an ACE determination could not be made, and who refused to participate in the study, was excluded.
The study was approved by the Galician Network of Research Ethics, Spain (Research Ethics Committee of Galicia: 2009/467) and was carried out following the Declaration of Helsinki principles and its updates, and the current legislation on biochemical research.
In the initial visit, the following sociodemographic variables were collected: smoking history (i.e., “never smoked”, “ex-smoker” and “active smoker”), body mass index, comorbidity based on the Charlson Index,23 history of other specific diseases (e.g., tuberculosis of the lung, those caused by non-tuberculous mycobacteria and pulmonary hypertension), history of exposure to silica dust, silicosis diagnosis and severity, lung function and, finally, radiography (X-rays) and/or chest CT scans and blood tests. The ILO classification was used for diagnosis, requiring a profusion of at least 1/1 to be able to make a silicosis diagnosis, which was then classified into “simple” or “complicated” according to the size of the opacity. When it was <10 mm in size, it was considered to be simple chronic silicosis, or complicated chronic silicosis if >10mm.1,24
In the follow-up consultations up to December 2018, the radiological progression in silicosis was evaluated, as well as any hospital admissions, Emergency or Primary Care Centre attendances due to any respiratory diseases, and death.
The X-rays and CT scans were interpreted by radiologists with considerable experience in silicosis. The definition of a large opacity is when the longest dimension exceeds 10 mm. Categories of large opacities are defined below:
Category A: one large opacity where the longest dimension is up to 50 mm, or several large opacities with the sum of their longest dimensions not exceeding 50 mm.
Category B: one large opacity where the longest dimension exceeds 50 mm but does not exceed the equivalent area of the upper-right zone, or several large opacities with the sum of their longest dimensions exceeding 50 mm but not exceeding the equivalent area of the upper-right zone.
Category C: one large opacity which exceeds the equivalent area of the upper-right zone, or several large opacities which, when combined, exceed the equivalent area of the upper-right zone.24
When CT was used to classify large opacities, they were classified as category A when there were one or more opacities >10mm and they were less than one-quarter of the area (a quadrant) from the right-hand side of the CT scan at carina level. Category B was an opacity greater than “A”, taking up less than half of the area (2 quadrants) from the right-hand side of the CT scan at carina level. It was category C when one or the sum of the opacities constituted more than half of the area from the right-hand side of the CT scan at carina level.7 Any progression was interpreted as progression regardless of the level of nodule abundance, with a change in the category when the diagnosis went from simple to complicated silicosis (A, B or C), from complicated silicosis A to complicated silicosis B or C, or from complicated silicosis B to complicated silicosis C.25 The lung function tests, spirometry and diffusing capacity for carbon monoxide (DLCO) were carried out following the recommendations of the Spanish Society of Chest Diseases and Thoracic Surgery (SEPAR) and the European Respiratory Society (ERS).26,27 The results analysed were forced vital capacity (FVC), forced expiratory volume in one second (FEV1), FEV1/FVC ratio, total lung capacity (TLC) and diffusing capacity for carbon monoxide (DLCO). An FEV1/FVC ratio <70 was considered an obstructive limitation to the air flow and an analysis was made for any decrease in FVC of >10% in order to consider difference in FVC as clinically important.28 Although we had the ACE levels for all the subjects, not all of them had information on BMI, smoking or lung function.
Statistical analysisA descriptive and analytical analysis was performed on the data. The results of the qualitative variables are represented as frequency and percentages, and the quantitative variables appear as mean and standard deviation. Results among patients were compared in terms of their baseline characteristics and the outcome of their lung function tests. The chi-squared test was used to compare the qualitative variables, and the Student's t-test was for the quantitative ones. These same tests were used to analyse the relationship between the ACE levels in these patients and the prognostic and progression variables. Stepwise logistic regression was performed to assess which variables might be associated with progression, including any independent variables which yielded a statistical significance of 0.05. Finally, variables associated with ACE levels and progression were ANA, BMI, type of job and COPD-Asthma diagnosis results. A ROC curve analysis was performed to calculate AUC, sensitivity and specificity for the ACE values which would identify silicosis, and to predict mortality. The statistical analysis was performed with SPSS software v19.0. In the contrasts made, it was considered that there were statistically significant differences with a P<0.05.
ResultsIn the period from 2009 to 2018, a total of 516 patients with an ACE determination were evaluated, 73 of whom had silica exposure, 201 simple silicosis, and 212 complicated silicosis (A: 132, B: 52, and C: 28); the other 30 were healthy controls with no history of silica exposure. All the subjects were male, with a mean age of 51.0 ±11.0 years.
As regards work history, 364 (75%) had jobs in quarries, 58 (11.9%) were stone carvers in ornamental stone works, and 64 (13.2%) were employed elsewhere, 12 of them having to work with artificial stone. The mean time of exposure to silica was 23.7 years (SD: 9.8). The mean follow-up of the patients was 4.8±2.2 years, during which time 41 (18.6%) patients had died.
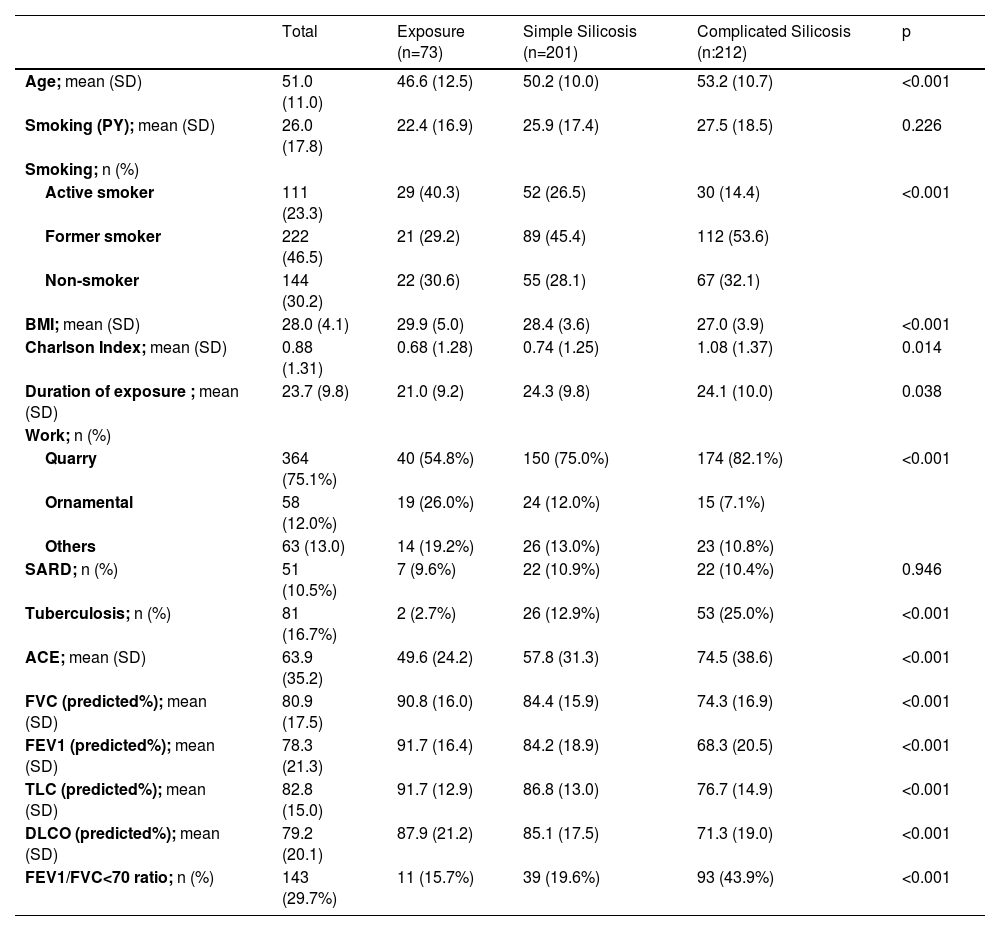
The demographic, clinical, and functional characteristics are shown in Table 1.
Demographic, clinical, and functional characteristics of patients with and without silicosis.
SD: standard deviation; PY: pack-years, calculated by multiplying the number of packs of cigarettes smoked per day by the number of years the person has smoked; BMI: body mass index; SARD: Systemic Autoimmune Rheumatic Disease; sACE: Serum angiotensin converting enzyme; FVC: forced vital capacity; FEV1: forced expiratory volume in 1 sec; TLC: total lung capacity; DLCO: lung diffusion capacity; FEV1/FVC: forced expiratory volume in 1 sec / forced vital capacity ratio.
For the non-exposed healthy controls, the mean ACE level was 27.5±7.3 IU/L; for the 73 patients who had been exposed, it was 49.6±24.2 IU/L; for the 201 simple silicosis patients, it was 57.8±31.3 IU/L; finally, in the 212 complicated silicosis sufferers, it was 74.5±38.6 IU/L (Fig. 1). No association was observed between exposure time and ACE levels.
 in silicosis, exposed without silicosis and control groups.")
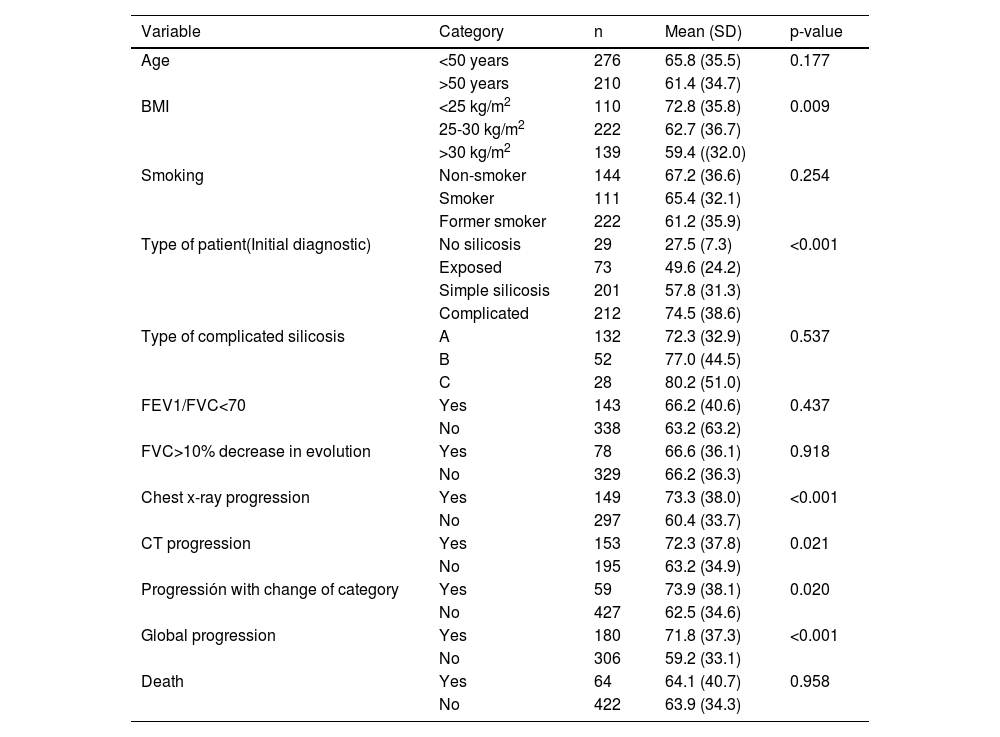
Significantly higher ACE levels were observed in patients with the most severe forms of silicosis than those with milder ones or those who had been exposed to silica but had not been diagnosed with the condition; the same was also true of those that had radiological progression versus those that did not and those that changed silicosis category compared with those that remained in the same category. In the rest of the parameters analysed, no differences were observed in the serum ACE levels (Table 2).
Distribution of serum ACE values (IU/L) in the silicosis patients according to diagnostic category, pulmonary function and progression.
Dx: diagnosis; BMI: body mass index; Chest x-ray: Chest radiology; CT: computed tomography. Global progression: includes subjects with some type of progression (radiology, CT, or change in category of silicosis); FVC: forced vital capacity; FEV1/FVC: forced expiratory volume in 1 sec/forced vital capacity ratio.
As Table 2 shows, in the 149 patients that showed progression in the chest X-rays, the mean ACE was 73.3±38.0 IU/L, while in the 297 with no progression, the mean ACE was 60.4±33.7 IU/L (p<0.001). In the 153 that did not show progression in the CT scan, the mean ACE was 72.3±37.8, while in the 195 with no progression, the mean ACE was 63.2±34.9 IU/L (P=0.021). As regards progression with a silicosis category change, in the 59 whose disease had progressed, the mean ACE was 73.9 IU/L (38.1 IU/L), whereas in the 427 for whom it remained unchanged, it was 62.5 IU/L (34.6 IU/L) (P= 0.020). As regards any kind of progression, in the 180 that had gone through one, the mean ACE was 71.8±37.3 IU/L, whereas, in the 306 that had not, it was 59.2±33.1 IU/L (p<0.001).
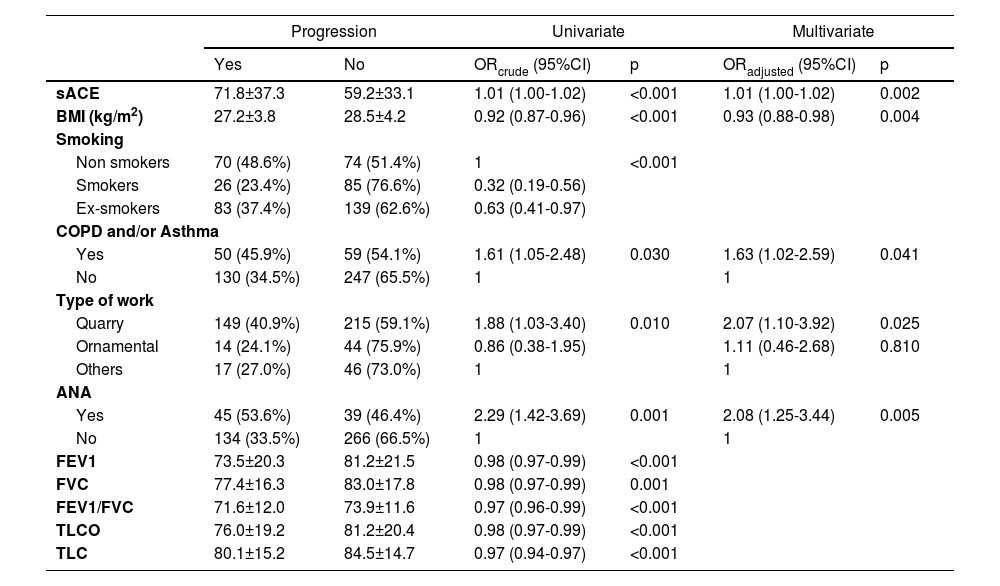
A multivariate stepwise logistic regression analysis was performed with the variables that were significant when it came to progression in the univariate analysis (Table 3). The variables with p<0.05 included in the final predictive model of progression were ANA (OR 2.05 [95% CI; 1.23-3.40]), ACE levels (OR 1.01 [95% CI; 1.00-1.02]), BMI (OR 0.93 [95% CI; 0.88-0.98]), type of job (quarry vs others; OR 2.07 [95% CI; 1.10-3.92]), and the diagnoses of COPD-Asthma (OR 1.63 [95% CI; 1.02-2.59]).
Variables that were significant as regards progression.
BMI: body mass index; COPD: Chronic Obstructive Pulmonary Disease; sACE: Serum angiotensin converting enzyme; ANA: antinuclear antibodies; FEV1: forced expiratory volumen in 1 sec; FVC: forced vital capacity; FEV1/FVC: forced expiratory volumen in 1 sec/ forced vital capacity ratio; DLCO: lung diffusion capacity; TLC: total lung capacity.
A ROC curve analysis was performed, including AUC for the ACE values to identify silicosis and to predict mortality. The ROC curve obtained to identify silicosis can be seen in Fig. 2. The AUC for silicosis diagnosis was 0.716 (95% CI; 0.664 – 0.767), whereas for the identification of complicated silicosis it was 0.635 (95% CI; 0.582-0.688). With an ACE cut-off value of 40 IU/L, the sensitivity was 75% with a specificity of 58%, while with a cut-off value of 70 IU/L, the sensitivity was 41.4% and the specificity was 84.3% for the final silicosis diagnosis.
Discussion curve of the ACE serum levels for silicosis identification (silicosis vs exposed).")
The data from this study shows that serum ACE levels can be useful for the diagnostic and prognostic assessment of patients with silica exposure since higher levels are associated with silicosis diagnosis, greater disease severity, and radiological progression and a change in silicosis category.
The ACE levels of the 516 patients in this study were higher for workers exposed to silica dust inhalation than for non-exposed subjects and were more severe the higher the silicosis category was (i.e., simple or complicated), similar to the findings of Nordman et al.17 and to recent reports on decorative stone workers by Hoy RF et al.29 Also, as Nordman et al.21 have already demonstrated, the ACE levels were higher in those that showed progression of the disease when evaluated by a simple chest X-ray, CT scan or a change in silicosis category.
Tobacco consumption and age, similar to the figures in Nordman et al,21 had no effect on the ACE results. Along the same lines, Tiwari et al.13 found no association between the levels of ACE and the duration of silica exposure whereas Beshir et al30 did. This difference is apparent due to the fact that Tiwari et al. used a mean exposure time of only 1.1±1.9 years, whereas Beshir et al. had a longer period, of 10 years; in this study, however, the mean time of silica exposure was 23.7 years.
As with Tiwari et al.,13 no relationship could be observed in the subjects of this study either between the serum ACE activity and occupation or the state of lung function. In this study, when there was an obstruction, it did not affect the ACE levels, nor were higher levels observed in patients for whom the FVC had worsened to a greater extent during the follow-up.
The lack of correlation between radiographic progression and the decrease in FVC in evolution has been shown by other authors; Karatas and al31 pointed out that among the patients that had radiographic progression (n=62), only 46.8% showed pulmonary function loss. Likewise, León et al.32 did not find any correlation between changes in FVC and radiologic progression either.
However, other authors found lower ACE levels in more severe silicosis with massive progressive fibrosis (MPF). Thus, Bucca et al.19 observed higher ACE levels in the 76 subjects with silicosis than in the 30 healthy ones, regardless of silica exposure, chest X-ray, age, lung function, smoking habits or the presence of COPD. The said study showed lower values of ACE in the radiologically more severe forms, although it was not statistically significant, which they argued was due to the fibrosis substituting the cellular component of the lesions, leading to a reduced release of hydrolytic enzymes because of the destruction of macrophages. Lower levels were also observed in MPF in the study by Szechiński J et al.20 Thirteen patients were classified as having simple silicosis, and their mean ACE level in serum was 44.2, while 10 patients were classified with MPF, with a mean ACE level of 39.4. Until now, only the paper by Nordmnan et al.21 in 1984 attempted to study the behaviour of ACE and its relationship with silicosis progression. Said study carried out a retrospective evaluation of the radiological progression in 49 patients with silicosis. The ACE was higher in the 18 patients with progression (50.5±16.4 U/L) than in those without progression (41.5±9.5 U/L). According to the multivariate analysis in that study, the fibrosis progression explained the increase in ACE more than the profusion of nodules.
The cause of the rise in serum ACE levels in silicosis is not known with certainty. Given that the endothelial cells of the capillaries have a high ACE content, the inclusion of capillaries derived from the fibrotic tissue, and the cytotoxic effect of silica particles on the protagonist macrophages could lead to their rupture and subsequent release of ACE.28
The renin-angiotensin-aldosterone system (RAAS) plays a critical role in fibrogenesis and inflammation in many organs, including the lung, and has recently gained importance after ACE-2 was identified as a receptor of Coronavirus in severe acute respiratory syndrome.33
ACE-2, like ACE, is present in alveolar epithelial cells (type 1 and 2) and in the endothelial capillaries.34 Angiotensin II can be degraded by ACE-2 in
Angiotensin (1-7), which has functions that are different to angiotensin II, a vasodilator and anti-proliferative type.34 It has been proposed that the ACE-2/Ang (1-7) / Mas Receptor axis, could act as a contra-regulator or protector of the ACE / Ang II / AT1 axis in inflammation and fibrosis.35,36
In idiopathic pulmonary fibrosis, it has been observed that RAAS plays a role in the genesis of pulmonary fibrosis by way of the ACE/Ang II/AT1 axis, as well as via the ACE2/Ang (1-7)/Mas axis, which has a protective effect.37
Our work has some limitations. Data for some variables was missing for some patients and the time frame to assess progression was not identical in all patients. Furthermore, we did not have accurate data about the protection system used to reduce silica exposure. On the other hand, the information collected was the information used in clinical practice, so this was a real-world data study.
In conclusion, this paper suggests that the determination of plasma ACE levels could be a very useful tool as part of a predictive model for silicosis diagnosis, together with other factors such as the presence of ANA, a BMI <30, type of job and a history of COPD and/or bronchial asthma. It could also be a useful non-invasive method to evaluate the severity and risk of silicosis progression.
Further studies are needed to investigate if changes in ACE / ACE-2 levels could attenuate the pulmonary fibrosis which exists in silicosis.38,39


