


Quantifying breathing effort in non-intubated patients is important but difficult. We aimed to develop two models to estimate it in patients treated with high-flow oxygen therapy.
Patients and MethodsWe analyzed the data of 260 patients from previous studies who received high-flow oxygen therapy. Their breathing effort was measured as the maximal deflection of esophageal pressure (ΔPes). We developed a multivariable linear regression model to estimate ΔPes (in cmH2O) and a multivariable logistic regression model to predict the risk of ΔPes being >10 cmH2O. Candidate predictors included age, sex, diagnosis of the coronavirus disease 2019 (COVID-19), respiratory rate, heart rate, mean arterial pressure, the results of arterial blood gas analysis, including base excess concentration (BEa) and the ratio of arterial tension to the inspiratory fraction of oxygen (PaO2:FiO2), and the product term between COVID-19 and PaO2:FiO2.
ResultsWe found that ΔPes can be estimated from the presence or absence of COVID-19, BEa, respiratory rate, PaO2:FiO2, and the product term between COVID-19 and PaO2:FiO2. The adjusted R2 was 0.39. The risk of ΔPes being >10 cmH2O can be predicted from BEa, respiratory rate, and PaO2:FiO2. The area under the receiver operating characteristic curve was 0.79 (0.73–0.85). We called these two models BREF, where BREF stands for BReathing EFfort and the three common predictors: BEa (B), respiratory rate (RE), and PaO2:FiO2 (F).
ConclusionsWe developed two models to estimate the breathing effort of patients on high-flow oxygen therapy. Our initial findings are promising and suggest that these models merit further evaluation.
Strong breathing effort made by critically ill patients may cause harm in various ways.1,2 It can fatigue the respiratory muscles and increase whole-body oxygen consumption and carbon dioxide production,3 which may be relevant in patients with cardiopulmonary dysfunction. It can cause pulmonary edema, for example, in patients with severe chronic obstructive pulmonary disease undergoing weaning from mechanical ventilation.4 It might also directly injure the diaphragm and the lungs, but this concept has yet to be validated in humans.5,6 All these reasons suggest that strong breathing effort should be recognized and treated.1,2,7,8 Based on small physiological studies, different interventions may be considered, from titrating the sedation and the ventilatory support to instituting controlled mechanical ventilation with full neuromuscular blockade.9-13 Indeed, the primary goal of positive pressure ventilation is to relieve excessive work of breathing.14
During spontaneous breathing, inspiratory muscle contractions produce simultaneous deflections of the esophageal pressure (ΔPes), which reflect the magnitude of the effort.15 In healthy subjects, ΔPes is only a few cmH2O during quiet breathing but >10–15 cmH2O during vigorous exercise or carbon dioxide inhalation.16-19 In critically ill patients, the upper limit for a “safe” ΔPes is unknown. Nonetheless, according to experts’ opinions (summarized in Table A.1 in the supplemental digital content),8,10,20-29 breathing effort with a ΔPes >10–15 cmH2O is probably too strong to be tolerated for a long time.
However, esophageal manometry is not widely available.30 Estimating breathing effort without it is complex, especially in non-intubated patients, when tidal volume and ventilator waveforms cannot help.31-33 Doctors mostly rely on their gestalt or overall impression,14 which is subjective and prone to inaccuracies. For instance, in a previous study from our group, the efforts of non-intubated critically ill patients were often misclassified:22 many of those with a ΔPes >10–15 cmH2O were considered “normal”, while some of those with a ΔPes ≤10 cmH2O were considered “strong” despite their lower ΔPes. Another study reported only fair to moderate agreement among doctors in deciding whether their patients passed a spontaneous breathing trial and could thus be extubated.34
This study had two objectives. First, to create a model that could estimate ΔPes (i.e., the effort to breathe) in patients who are not intubated and receiving high-flow oxygen therapy. Second, to simplify this model into another one that could predict the likelihood of ΔPes being >10 cmH2O (i.e., strong breathing effort).
Material and methodsIn this multicenter cohort study, we combined the data of 273 adult patients from seven prospective studies conducted in our mixed or respiratory Intensive Care Units (ICUs) and described in Tables A.2 and A.3 in the supplemental digital content. One hundred and eight patients were from six completed studies,35-40 and 165 from an ongoing study (NCT03826797). Most of these studies enrolled patients with acute hypoxemic respiratory failure and without a history of chronic lung disease, acute cardiogenic pulmonary edema, and hemodynamic instability. All the completed studies have been approved by the appropriate Institutional Review Committees.35-40 The ongoing study was approved by the Area Vasta Emilia Nord (AVEN) Ethics Committee in Modena, Italy, in December 2016 under protocol number 266/2016. The present analysis, which includes patients enrolled until the end of 2022, was approved by the same AVEN Ethics Committee in May 2023. Written informed consent was obtained from all the patients.
In all studies, ΔPes was the average of three or more consecutive readings during high-flow oxygen therapy through nasal cannula (HFNC). In one study,36 data were recorded from the same patients more than once, on the same occasion, but with different gas flows. All repeated measures were averaged so that each patient contributed one data set to the analysis.
We conducted two analyses. In the first analysis, we used multivariable linear regression to develop a model for ΔPes. In the second analysis, we used multivariable logistic regression to develop a model for the risk of ΔPes being >10 cmH2O. We validated this model internally and simplified it into a score.
We prepared our manuscript following the Transparent Reporting of a multivariable prediction model for Individual Prognosis Or Diagnosis (TRIPOD) statement.41
Model for ΔPes in cmH2OThe outcome to be predicted was ΔPes (in cmH2O). The candidate predictors were all measured within a few minutes of ΔPes by the same investigators. They included age, sex, diagnosis of the coronavirus disease 2019 (COVID-19), heart rate, mean arterial pressure, respiratory rate, arterial pH (pHa), arterial carbon dioxide tension (PaCO2), arterial oxygen tension (PaO2), arterial bicarbonate concentration (HCO3−a), arterial base excess concentration (BEa), arterial oxygen saturation (SaO2), and arterial tension to the inspiratory fraction of oxygen ratio (PaO2:FiO2). The product term or interaction between COVID-19 and PaO2:FiO2 was also considered based on scientific reasoning.42 Unfortunately, other potentially relevant predictors, such as the recruitment of accessory muscles or the severity of dyspnea, were unavailable in the dataset. Only 260 patients with complete data were considered for further analysis. The proportion of patients with missing data (5 %) was deemed negligible and may not have yielded significant biases.
Statistical analysis methodsData are reported as median (Q1-Q3) and count (percentage).
Firstly, we studied the association between each candidate predictor and outcome separately with univariable linear regression. We used fractional polynomial regression analysis to explore potentially meaningful non-linear associations. We selected the most appropriate second-degree function by minimizing deviance in polynomial regression. However, we observed only a slight improvement in the model fit. To maintain simplicity and avoid overfitting, we opted to develop a model based on linear associations between the candidate predictors and the outcome. Afterward, we built a multivariable linear regression model. In cases of high correlation among candidate predictors (i.e., Spearman's rho >│0.80│), we excluded the variable that was least important based on mechanistic reasoning. Predictors were selected using a backward stepwise elimination strategy, with a p < 0.05 at the Wald test as the stopping rule. Based on the residual analysis, the linearity and normality assumptions were met, but the equal variance assumption was not. Therefore, we computed robust standard errors for the regression coefficients. The fit of the model was evaluated both in terms of calibration and overall performance. Calibration was assessed by plotting the observed ΔPes against the predicted ΔPes. In a well-fitting model, the predictions cluster around the 45° diagonal, or identity line, and the slope of the plot is close to 1.41,43 Overall performance was evaluated with the adjusted R2, which reflects the amount of outcome variability explained by the model adjusted for the number of predictors included.41,43
Model for ΔPes >10 cmH2OWe built a multivariable logistic regression model using the same candidate predictors and variable selection technique mentioned previously. The dichotomous outcome to be predicted was strong breathing efforts, defined as those with a ΔPes >10 cmH2O as in our previous work.22 The apparent predictive performance of the model was assessed in terms of calibration, discrimination, and overall performance.41,43 Calibration was evaluated by plotting the observed proportion of patients with strong breathing efforts against the predicted risk. In a perfectly calibrated model, this plot has an intercept of 0 and a slope of 1. Discrimination was assessed with the area under the receiver operating characteristics curve (AUROC). This area can range from 0 to 1, where 0.5 indicates random guessing, and 1 indicates perfect discrimination. Overall performance was assessed with the scaled Brier score, computed as 1 – Brier score / Brier score max. It ranges from 0 % to 100 %, with higher values indicating a better-performing model.41,43
Internal model validationWhen testing performance, using the same dataset used to develop a model often leads to overly optimistic results. To obtain unbiased estimates, we used a bootstrap resampling technique. Firstly, we repeated the entire modeling process, including variable selection, on 200 bootstrap samples drawn with replacement from the original dataset. Secondly, we computed the optimism of each bootstrap model by comparing its performance in the same bootstrap sample or the original dataset. Finally, we subtracted the average optimism of the 200 bootstrap samples from the initial apparent performance of the model under validation to obtain its optimism-corrected performance.41,43
Model presentationWe created a score by dividing each regression coefficient by the smallest one and produced a table to transform each possible total point score into an outcome probability.41,43
All statistical analyses were run with Stata/SE 17.0 (StataCorp LLC; College Station, TX). A two-tailed p-value <0.05 was considered statistically significant.
Other details on methods are presented in the supplementary material.
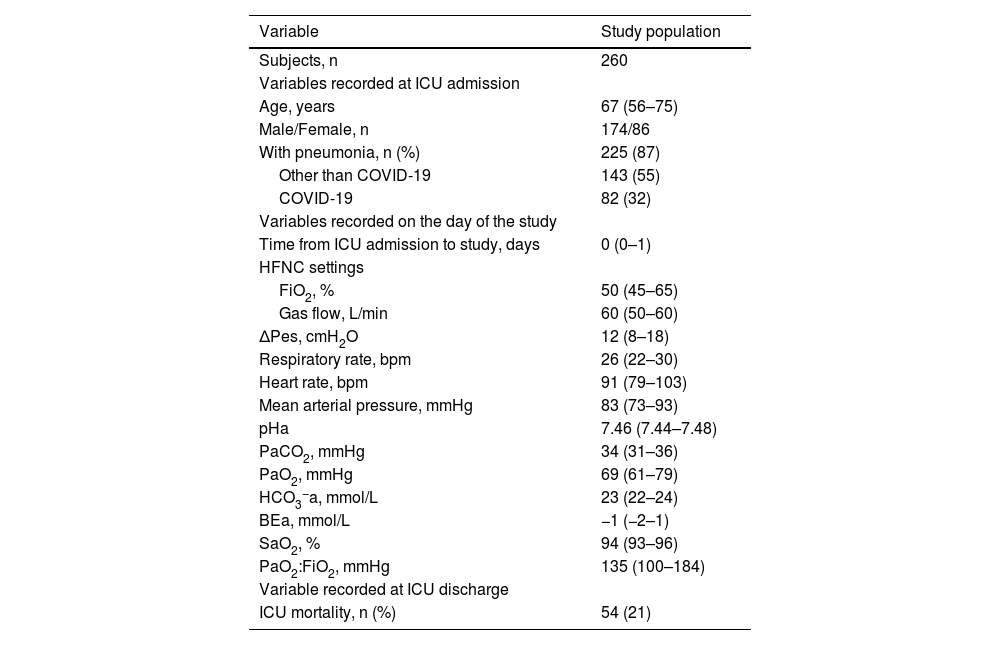
Results260 patients were included in the study (Table 1). Most of them had a PaO2:FiO2 ≤300 mmHg (245 [94 %]) and pneumonia (225 [87 %]). On average, ΔPes was 12 (8–18) cmH2O. It was ≤10 (7 [6–9]) cmH2O in 107 (41 %) and >10 (16 [13–25]) cmH2O in 153 (59 %).
Main characteristics of the study population.
Continuous variables are presented as medians (Q1-Q3). Categorical variables are reported as absolute numbers and percentages. BEa: arterial base excess concentration. COVID-19: novel coronavirus disease 2019. ΔPes: maximal inspiratory deflection of the esophageal pressure. FiO2: inspiratory fraction of oxygen. HCO3−a: arterial bicarbonate concentration. HFNC: high-flow nasal cannula (oxygen therapy). ICU: Intensive Care Unit. PaCO2: arterial carbon dioxide tension. PaO2: arterial oxygen tension. PaO2:FiO2: arterial tension to the inspiratory fraction of oxygen ratio. pHa: arterial pH. SaO2: arterial oxygen saturation.
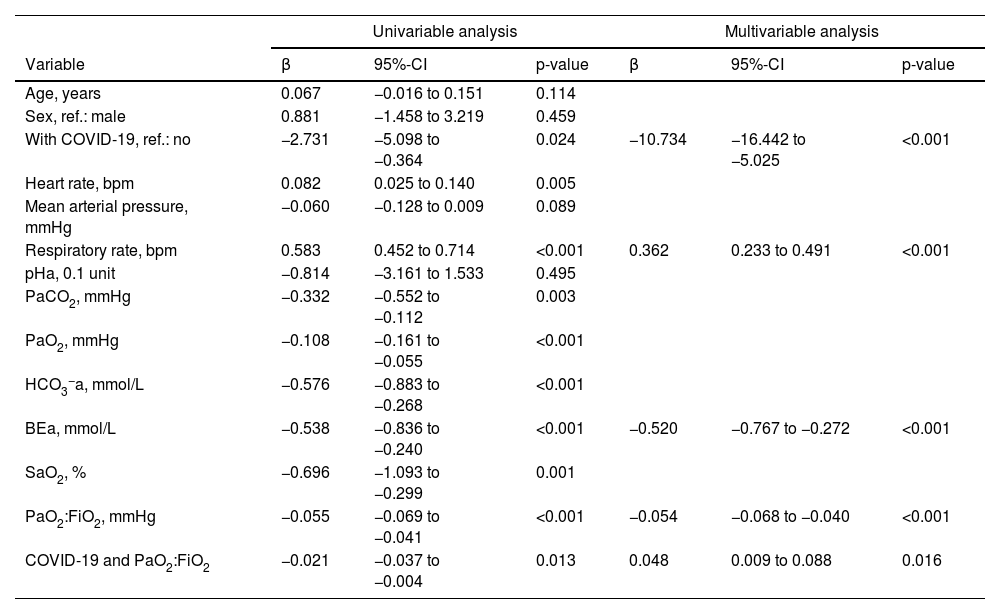
In univariable linear regression analysis, ΔPes decreased with a diagnosis of COVID-19 but increased with a higher respiratory rate, higher heart rate, and lower PaCO2, PaO2, HCO3−a, BEa, SaO2, and PaO2:FiO2. It was not strongly associated with age, sex, mean arterial pressure, and pHa. The product term between COVID-19 and PaO2:FiO2 was significant (Table 2).
Linear regression analysis to predict ΔPes.
Univariable and multivariable linear regression analysis to predict ΔPes (in cmH2O) during high-flow nasal cannula oxygen therapy. BEa: arterial base excess concentration. β: regression coefficient. CI: confidence interval. COVID-19: novel coronavirus disease 2019. ΔPes: maximal inspiratory deflection of the esophageal pressure. FiO2: inspiratory fraction of oxygen. HCO3−a: arterial bicarbonate concentration. PaCO2: arterial carbon dioxide tension. PaO2: arterial oxygen tension. PaO2:FiO2: arterial tension to the inspiratory fraction of oxygen ratio. pHa: arterial pH. SaO2: arterial oxygen saturation.
In multivariable model development, SaO2 and HCO3−a were excluded because of collinearity issues with PaO2 and BEa. Age, sex, heart rate, mean arterial pressure, pHa, PaCO2, and PaO2 were eliminated by backward selection. A diagnosis of COVID-19, BEa (mmol/L), respiratory rate (bpm), and PaO2:FiO2 (mmHg), and the product term between COVID-19 and PaO2:FiO2 remained in the model (Table 2). We found that in patients without COVID-19, ΔPes (in cmH2O) can be estimated as 14.25 – 0.52 × BEa + 0.36 × respiratory rate – 0.05 × PaO2:FiO2. In those with COVID-19, ΔPes (in cmH2O) can be estimated as 3.52 – 0.52 × BEa + 0.36 × respiratory rate – 0.01 × PaO2:FiO2. The calibration slope was 1, and the adjusted R2 was 0.39 (Fig. 1 and Fig. A.1).
 tested on the development population, while Panel B shows the calibration plot for the logistic regression model for breathing efforts with a ΔPes >10 cmH2O tested on the development population. Each dot on the plot represents a tenth of the predicted values, each one based on data from 26 patients. The bars represent the 95 % confidence intervals, and the red line is the identity line.")
Calibration plot of observed against predicted outcomes.
Panel A shows the calibration plot for the linear regression model for ΔPes (in cmH2O) tested on the development population, while Panel B shows the calibration plot for the logistic regression model for breathing efforts with a ΔPes >10 cmH2O tested on the development population. Each dot on the plot represents a tenth of the predicted values, each one based on data from 26 patients. The bars represent the 95 % confidence intervals, and the red line is the identity line.
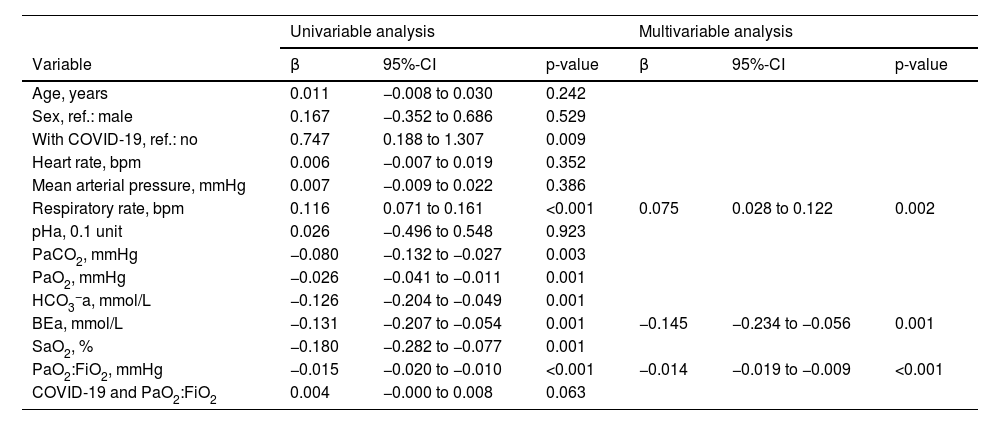
On univariable logistic regression analysis, variables associated with the risk of strong breathing efforts were the same as those associated with ΔPes, except for heart rate and the product term between COVID-19 and PaO2:FiO2, which were not significant (Table 3).
Logistic regression analysis to predict the risk of strong breathing efforts.
Univariable and multivariable logistic regression analysis to predict the risk of breathing efforts with a ΔPes >10 cmH2O during high-flow nasal cannula oxygen therapy. BEa: arterial base excess concentration. β: regression coefficient. COVID-19: novel coronavirus disease 2019. ΔPes: maximal inspiratory deflection of the esophageal pressure. FiO2: inspiratory fraction of oxygen. HCO3−a: arterial bicarbonate concentration. PaCO2: arterial carbon dioxide tension. PaO2: arterial oxygen tension. PaO2:FiO2: arterial tension to the inspiratory fraction of oxygen ratio. pHa: arterial pH. SaO2: arterial oxygen saturation.
During multivariable model development, BEa (mmol/L), respiratory rate (bpm), and PaO2:FiO2 (mmHg) remained in the model while all other variables, including a diagnosis of COVID-19 and the product term between COVID-19 and PaO2:FiO2, were removed (Table 3). We found that the individual probability of outcome can be calculated as 1 / {1 + exp [– (0.461 – 0.145 × BEa + 0.075 × respiratory rate – 0.014 × PaO2:FiO2)]}. The corresponding percentage risk can be obtained by multiplying this probability by 100.
When the fit of the model was tested on the same data set used to develop it (apparent performance), the calibration intercept was −0.00 (−0.29 to 0.29), the calibration slope was 1.00 (0.72 to 1.28), the AUROC was 0.79 (95 % CI, 0.73–0.85), and the scaled Brier score was 29 % (Fig. 1). On internal validation (optimism-corrected performance), the calibration intercept was 0.00 (−0.33 to 0.33), the calibration slope was 0.85 (0.60 to 1.12), the AUROC was 0.76 (0.71–0.81), and the scaled Brier score was 23 % (Fig. A.2). The prediction model was simplified into the following score: 33.7 – 10.6 × BEa + 5.5 × respiratory rate – PaO2:FiO2. The outcome probabilities of different total points scores are reported in Fig. A.3.
DiscussionWe developed two models that can estimate the breathing effort (ΔPes in cmH2O) or the risk of strong efforts (probability of ΔPes being >10 cmH2O) in patients with high-flow oxygen therapy. These models are based on a few variables readily available in an ICU, and yet their performance was fairly good, which makes them suitable for further evaluation.
Research on how to estimate the breathing effort in patients has been primarily limited to those receiving invasive mechanical ventilation. There is very little evidence on this topic for non-intubated patients. Therefore, doctors evaluating non-intubated patients rely mostly on their clinical impression.14 They look for signs that suggest an elevated effort, such as diaphoresis, hypoxia, tachycardia, tachypnea, altered mentation, shortness of breath, and recruitment of accessory and expiratory muscles. However, these signs are poorly defined,44 and their relative importance is unclear. Reaching a definite conclusion when they conflict with each other can be difficult. Furthermore, none of these signs alone is accurate, particularly in critically ill patients, due to many confounding factors. On the other hand, doctors also rely on criteria derived from their experience, which are inherently vague and arbitrary.14 This often leads to clinical decisions being based more on implicit and subjective than explicit and objective rules.45 Therefore, it is not surprising that doctors may disagree when rating the breathing effort made by their patients, or when debating whether to proceed to intubation.22,34,46-49
Strengths of our models and their potential clinical applicationsThis was our first attempt at filling this gap in research. We developed two simple but composite models to estimate the effort of breathing during high-flow oxygen therapy when esophageal manometry is unavailable. One model predicts the actual ΔPes while the other predicts the risk of ΔPes being >10 cmH2O. The association between the selected variables and breathing effort is biologically plausible.1,2 Other variables, such as PaCO2, had some predictive value on their own but did not ameliorate model performance. We use the acronym BREF to refer to these models. BREF stands for BReathing EFfort but also reminds the common predictors: BEa (B), respiratory rate (RE), and PaO2:FiO2 (F). Doctors may use these models, as well as any updated version, as an aid for their decision-making process. For instance, to determine whether a patient requires admission to the intensive care unit, how often he or she should be reassessed, and whether to increase ventilatory support or proceed to intubation. Those with limited experience or working outside the ICU may find them particularly helpful.50 In other fields of medicine, clinical prediction rules are used this way.51,52 Results may be interpreted as follows: breathing efforts with ΔPes up to 10 cmH2O are probably safe; those with ΔPes from 11 to 15 cmH2O warrant close monitoring as they can lead to fatigue; those with ΔPes higher than 15 to 20 cmH2O should not be tolerated for long. These values reflect our current best practices and may be revised as new knowledge becomes available.
Limitations of our models and implications for future researchThis work also has several limitations that need to be addressed. Firstly, our models require performing an arterial blood gas analysis, which is invasive and resource-consuming. Secondly, the performance was only moderately good and needs to be validated in a new study population.41,43 However, the models may be updated into a second version, including other predictors, and this will hopefully improve their accuracy. Thirdly, the clinical usefulness of any prediction model depends on the accuracy of the unaided doctor and the consequences of decisions based on it, which are yet to be determined. Fourthly, these models may not be suitable for patients excluded from our study population, including those with acute cardiogenic pulmonary edema or a history of chronic lung disease. Lastly, having a dichotomous outcome can facilitate the interpretation of the results but with many drawbacks.41,43 For instance, it carries the risk of characterizing patients with a ΔPes slightly lower or higher than 10 cmH2O as being very different rather than very similar. The exact threshold of ΔPes that separates normal and strong efforts, if such a threshold exists, remains unknown. Various suggestions have been proposed, ranging from 8 to 18 cmH2O (see Table A.1), but none of them is supported by solid evidence. Also, it may cause a loss of information, which may explain why a diagnosis of COVID-19 was associated with ΔPes at linear regression analysis but not with strong breathing efforts at logistic regression analysis. For these reasons, dichotomizing a continuous outcome is generally discouraged.41,43 Hence, our model for ΔPes in cmH2O should be preferred over the other.
ConclusionsWe have developed two models to estimate the breathing effort of critically ill patients on high-flow oxygen therapy. Our initial findings are promising and suggest that these models merit further evaluation. This may include testing them on a new population, updating them, and determining their clinical usefulness.
R.T. received travel support from SEDA Ltd, owns the patent n. 02021000007478 released by the Italian Ministry of Enterprises and Made in Italy, and is a co-founder of IREC Ltd (VAT number 02959080355); G.M.C. received payment or honoraria for lectures, presentations, speakers bureaus, manuscript writing, or educational events from Getinge e MSD; E.C. owns the patent n. 02021000007478, released by the Italian Ministry of Enterprises and Made in Italy, and is a co-founder of IREC Ltd (VAT number 02959080355). All other authors declare no conflicts of interest related to this manuscript.
Prior presentations: Some results of this work have been presented at the 33rd SMART Meeting Anesthesia, Resuscitation, and Intensive Care held on May 4th-6th, 2023, in Milan, Italy, and at the 1st Jordi Mancebo PLUG Physiology Symposium held on September 28th-30th, 2023, in Barcelona, Spain.


