


This study evaluates the performance of individual and combinations tests used for pediatric tuberculosis diagnosis at a reference center.
Materials and MethodsDiagnostic test outcomes from children with presumed pulmonary tuberculosis evaluated from January 2005 - July 2010 were compared to a standard diagnosis made by an expert panel of physicians.
ResultsPresence of at least one sign/symptom, history of contact, or abnormal chest X-ray (aCXR) individually showed the highest sensitivity (85.7%). While the combination of history of contact, at least one sign/symptom, positive tuberculin skin test, and aCXR had low sensitivity of 20%, but the specificity and a positive predictive value were 100%, respectively. The combination of tests used in the International Union Against Tuberculosis and Lung Disease and the Brazilian Ministry of Health systems showed sensitivity of 28.6% and 71.4% and specificity of 95.8% and 97.0%, respectively.
ConclusionsIn the absence of a gold standard, the combination of clinical history, tuberculin skin test, and aCXR, as well as the Brazilian scoring system serve as simple, low-cost approach that can be used for pediatric TB diagnosis by first-contact care providers.
Tuberculosis (TB) remains a major global public health problem and according to the World Health Organization (WHO) in 2017, 10.0 million people developed TB disease, 1.0 million of which were children (aged <15 years). In cases of deaths caused by TB, (aged <15 years) 15% of total deaths and 10% of total deaths in HIV positive cases these values are higher than their share of estimated cases, suggesting poorer access to diagnosis and treatment.1
Many clinical and laboratory tests have been proposed for the diagnosis of pediatric TB, but a gold standard is lacking.2 Currently, pediatric TB diagnosis is based on history of contact, clinical signs, chest radiography, tuberculin skin testing (TST), and microbiological examination. However, children with TB can present clinical signs and abnormalities on chest x-rays (aCXR) that are nonspecific. Moreover, respiratory specimens are difficult to collect and bacteriologic yield is low in pediatric patients, greatly reducing rates of bacteriological confirmation.3,4
There is a great need to identify diagnostic tests that are more sensitive and specific for the diagnosis of pulmonary TB in pediatric patients. A number of scoring systems have been proposed for the diagnosis of pediatric TB, though no single system has been adequately validated.5–8 The Brazilian Ministry of Health (BMoH) system has been evaluated for its use in HIV-infected and uninfected children.9 In 1998, the International Union Against Tuberculosis and Lung Disease (IUATLD) proposed a system10 based on different scores according to the local TB epidemiology, which has yet to be validated in other settings.7
In this context the aim of this study was to evaluate the performance of single and combinations tests used in the diagnosis of pediatric TB, as well as two scoring systems in a Reference Center in Brazil.
Materials and methodsStudy populationThe study model was a descriptive, survey of a cohort in a low HIV prevalence setting. Study cohort included children of 14 years of age and under, evaluated for pulmonary TB between January 2005 and July 2010 at the Clinical Hospital of the Federal University of Paraná, the reference center for pediatric tuberculosis in Curitiba, Brazil.
Data collectData on epidemiological, clinical, laboratory, radiological and treatment outcomes were extracted from medical records using a standardized questionnaire. Medical records for all children fulfilling inclusion criteria in this time period were able to be recovered. However, patients were excluded if the record didn’t contained key data for expert panel diagnosis, if they were transferred to another service or were lost to follow-up before the attending physician made the diagnosis.
Evaluation of diagnostic testsFor diagnostic test evaluation, a presumed pulmonary TB was considered if the subjects presented one of more of the following signs or symptoms: cough for two weeks or more, fever, sweating, pneumonia or wheezing with no improvement after treatment with antibiotics or bronchodilators, loss of appetite, adynamia, and loss or stabilization of weight. In children 2 years and under who had received BCG vaccination, TST greater than or equal to 10 mm was considered positive; in children over 2 years of age, independent of vaccination state, TST greater than or equal to 5 mm was considered positive.9
Evaluation of scoring systemsData from subject medical records were also used to apply two common scoring systems used for diagnosis of pediatric tuberculosis, the IUATLD[10] and BMoH[9] systems. For the BMoH system, both a cutoff of 30 (including “possible” and “very likely” TB classifications) and a cutoff of 40 (only “very likely TB” subjects) were evaluated. As Curitiba City is classified as having low TB prevalence,11 the IUATLD scoring system for areas of low prevalence was employed here. Additionally, because the IUATLD system does not include follow-up, we evaluated subjects at initial appointment (IUATLD I) and at the subsequent consultation when physician diagnosis was made (IUATLD S), as some subjects presented change in evaluation parameters after administration of non-tuberculosis treatments. For both IUALTD evaluations, a score of 9 or more was considered a TB case.
As a way of creating diagnostic groups for this study, a panel of experts (consisting of an infectious disease specialist and a pulmonologist, both specializing in pediatric TB) evaluated subject data and diagnosed them as a TB, latent TB, or no TB case. In cases where there was disagreement in the diagnosis provided by the two-person panel, a third expert issued a final decision. Experts had access to all patients’ data, including TB treatment outcome through a standardized form and classified cases according to their clinical experience.
All analyses were carried out in SAS v9.2. The statistical relationship of sociodemographic characteristics of the different children´s groups suspected of pulmonary tuberculosis were evaluated by Pearson´s chi-squared and Pearson´s chi-squared with Yates correction and Mann-Whitney. Positive predictive value (PPV) and negative predictive value (NPV) of diagnostic tests were calculated using the prevalence of pediatric TB at the study site (11%), as well as rates found in other healthcare settings (1% and 5%).9 To assess the degree of agreement between expert diagnoses, a Kappa statistic was calculated and interpreted according to the criteria of Landis and Koch.12
ResultsFrom a total of 236 children with presumed pulmonary TB, 21.2% (50/236) were excluded from the study cohort for the following reasons: 24 lost to follow-up before diagnosis, 20 incomplete medical records, and 6 inconclusive diagnoses by expert panel.
Of the remaining 186 children, 34 (18.3%) were classified as not TB, 131 (70.4%) as latent TB and 21 (11.3%) as TB cases. Diagnostic agreement between experts varied from substantial to almost perfect (Kappa = 0.94, 0.75, 0.69).
The subjects were then divided into two groups for analysis: active TB group, including the 21 TB cases, and No TB (NTB) group including in this group the 131 latent TB infection and 34 not TB cases.
The Sociodemographic characteristics did not differ between the two groups and is important to highlight that the proportion of boys in the TB group was 52% and in the NTB group 50% (p = 0.95); white skin color ratio was 91.7% in the TB group and 79.8% in the NTB group (p = 0.38); the median age in year of TB group was 5.7 (0.7–13.9) and in NTB group was 5.8 (0.4–14.9) (p = 0.94) and finally the median number people living in a house was 5 (4–13) in TB group and 5 (3–10) in NTB group (p = 0.13).
Analysis of epidemiological history showed that 85% of the TB and 91.6% of NTB groups had history of contact with at least one index case. In both groups, a household contact was most common (70% of TB group, 79.3% of NTB group), with the greatest percentage of index cases being parents for both groups (27.7% TB group, 43.5% NTB group). In the TB group, 38.9% of children had contact with more than one adult TB case, which was significantly higher (p = 0.02) than the percentage of NTB cases with more than one contact (18.4%).
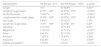
A significantly higher percentage of TB group versus NTB group was positive for all signs and symptoms evaluated, except for dry cough (Table 1) (p < 0.001).
Signs and symptoms present in TB and Not TB groups.
| Sign/Symptom | TB Groupn = 21% | Not TB Groupn = 165% | p-value |
|---|---|---|---|
| Cough | 16 7 | 64 38.8% | 0.001a |
| Length of cough (days) | 21.0d1 – 330e | 60.0d30 – 730e | <0.001b |
| Productive cough | 14 66.7% | 45 27.3% | <0.001a |
| Length productive cough (days) | 21.0d3 – 330e | 60.0d30 – 730e | <0.001b |
| Dry cough | 2 9.5% | 20 12.1% | 1.00a |
| Length dry cough (days) | 15.0d1 – 180e | 30.0d30 – 30e | 0.52b |
| Sweating | 10 47.6% | 26 15.8% | 0.001a |
| Weight loss | 11 52.4% | 25 15.1% | <0.001a |
| Fever | 9 42.9% | 22 13.3% | 0.002a |
| Anorexia | 7 33.3% | 14 8.5% | 0.002a |
| Adynamia | 5 23.8% | 7 4.2% | 0.003a |
| Altered auscultationc | 7 33.3% | 7 4.2% | <0.001a |
To evaluate other potential diagnoses, 46% of subjects that presented at least one sign or symptom were initially treated for other conditions (e.g pneumonia, asthma) prior to final TB diagnosis (data not shown). TB group subjects had significantly less improvement after this initial non-TB treatment (p < 0.01). However, it is worth noting that 35% percent of TB group subjects improved clinically, and for these subjects the return of symptoms or the maintenance of altered radiological exams was critical to the later TB diagnosis. No significant difference was found between groups when analyzing co-morbidities that could interfere with the diagnosis of TB (28.6% TB and 24.4% NTB; p = 0.78), and only 2 subjects were HIV-positive, both in the TB group.
All subjects in the TB group had previously received the BCG vaccination, while 95.1% of the NTB group had been vaccinated (p = 0.6). The TST was positive in 82.4% of the TB group and 57.1% of the NTB group (p < 0.001), and the average diameter of positive responses was significantly larger in the TB group (TB group = 19.5 ± 5 mm. NTB group = 15.4 mm ± 5 mm; p < 0.001). aCXR was observed in 85.7% of the TB group and 7.9% of NTB group (p < 0.001). In the TB group, smear and culture positive was observed in 23.5% (n = 4/17) and 26.7% (n = 4/15), respectively. In the NTB group, all subjects evaluated were sputum smear (n = 0/44) and culture negative (n = 0/25).
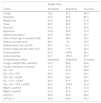
When analyzing the accuracy of single tests for TB diagnosis, the presence of at least one sign or symptom (85.7%), history of adult contact (85.7%) and aCXR (85.7%) showed the highest sensitivity. Evaluating combinations of tests, we found that the BMoH system with a cut-off of 30 showed a higher sensitivity (95.2%) than any single or combined test. While alone, the aCXR showed high accuracy (91.4%), the combination of at least one sign/symptom, history of contact and aCXR increased accuracy (95.1%).
The sensitivity, specificity, and accuracy for individual and combinations of tests are described in Table 2. The sensitivity and accuracy provide useful information to compare performance of diagnostic tests, but not the positive predictive value (PPV) or negative predictive value (NPV).13
Sensitivity, specificity, and accuracy of single and combinations of tests.
| Single Tests | |||
|---|---|---|---|
| Test(s) | Sensitivity | Specificity | Accuracy |
| Cough | 76.2 | 61.2 | 62.9 |
| Sweating | 47.6 | 84.2 | 80.1 |
| Weight loss | 52.4 | 84.9 | 81.2 |
| Fever | 42.9 | 86.7 | 81.7 |
| Anorexia | 33.3 | 91.5 | 85.0 |
| Adynamia | 23.8 | 95.8 | 87.6 |
| Altered auscultation | 33.3 | 95.8 | 88.7 |
| One or more sign or symptom (SS) | 85.7 | 56.4 | 59.7 |
| History of contact (HC) | 85.7 | 7.9 | 16.7 |
| Altered chest x-ray (aCXR) | 85.7 | 91.1 | 91.4 |
| Positive tuberculin skin test (TST) | 60.0 | 17.6 | 22.2 |
| Smear positive | 23.5 | 100.0 | 69.1 |
| Culture positive | 26.7 | 100.0 | 67.7 |
| Combinations of tests | Sensitivity | Specificity | Accuracy |
| Cough + weight loss + anorexia | 14.3 | 98.8 | 89.2 |
| Cough + sweating + anorexia | 14.3 | 95.8 | 86.6 |
| SS + HC | 71.4 | 61.8 | 62.9 |
| SS + HC + TST | 35.0 | 72.1 | 68.1 |
| SS + HC + aCXR | 60.0 | 99.4 | 95.1 |
| HC + TST + aCXR | 35.0 | 97.0 | 90.3 |
| SS + HC + TST + aCXR | 20.0 | 100.0 | 91.4 |
| BMoH: cutoff 30 | 95.2 | 91.5 | 91.9 |
| BMoH: cutoff 40 | 71.4 | 97.0 | 94.1 |
| IUATLD I | 28.6 | 95.8 | 88.2 |
| IUATLD S | 23.8 | 98.8 | 90.3 |
Legend: BMoH: Brazilian Ministry of Health; IUATLD: International Union Against Tuberculosis and Lung Disease.
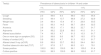
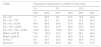
Therefore, we assessed these accuracy tests using the prevalence of our study cohort as well as simulating prevalence rates found in other healthcare settings (Table 3 and Table 4). Overall, single-test PPV was low. However, looking at test combinations, presence of at least one sign/symptom, history of contact, positive tuberculin skin test and aCXR had a PPV of 100%. Both BMoH and IUTLD systems showed higher NPV values, but lower PPV values, than this combination in all prevalence scenarios.
Positive predictive value and negative predictive value for individual tests at various prevalence rates.
| Test(s) | Prevalence of tuberculosis in children 14 and under | ||||||||
|---|---|---|---|---|---|---|---|---|---|
| 1% | 5% | 11% | |||||||
| PPV | NPV | PPV | NPV | PPV | NPV | ||||
| Cough | 2.0 | 99.6 | 9.4 | 98.0 | 19.5 | 95.4 | |||
| Sweating | 3.0 | 99.4 | 13.7 | 96.8 | 27.2 | 92.9 | |||
| Weight loss | 3.4 | 99.4 | 15.4 | 97.1 | 29.9 | 93.5 | |||
| Fever | 3.2 | 99.3 | 14.5 | 96.7 | 28.4 | 92.5 | |||
| Anorexia | 3.8 | 99.3 | 17.1 | 96.3 | 32.7 | 91.7 | |||
| Adynamia | 5.4 | 99.2 | 22.8 | 96.0 | 41.0 | 91.1 | |||
| Altered auscultation | 7.4 | 99.3 | 4.7 | 91.3 | 10.3 | 81.7 | |||
| One or more sign or symptom (SS) | 2.0 | 99.8 | 9.8 | 96.7 | 19.5 | 97.0 | |||
| History of contact (HC) | 0.9 | 98.2 | 4.7 | 91.3 | 10.3 | 81.7 | |||
| Altered chest X-ray (aCXR) | 8.9 | 99.8 | 33.7 | 99.2 | 54.4 | 98.1 | |||
| Positive tuberculin skin test (TST) | 0.7 | 97.8 | 3.7 | 89.3 | 8.3 | 78.1 | |||
| Smear positive | 100.0 | 99.2 | 100.0 | 96.1 | 100.0 | 91.4 | |||
| Culture positive | 100.0 | 99.3 | 100.0 | 96.3 | 100.0 | 91.7 | |||
Legend: VPP:Positive Predictive Value; VPN: Negative Predictive Value.
Positive predictive value and negative predictive value for combinations of tests at various prevalence rates.
| Test(s) | Prevalence of tuberculosis in children 14 and under | ||||||||
|---|---|---|---|---|---|---|---|---|---|
| 1% | 5% | 11% | |||||||
| PPV | NPV | PPV | NPV | PPV | NPV | ||||
| SS + HC | 1.9 | 99.5 | 9.0 | 97.6 | 18.8 | 94.6 | |||
| SS + HC + TST | 1.3 | 99.1 | 6.2 | 95.5 | 13.4 | 90.0 | |||
| SS + HC + aCXR | 49.8 | 99.6 | 83.8 | 97.9 | 92.4 | 95.3 | |||
| HC + TST + aCXR | 10.5 | 99.3 | 37.8 | 96.6 | 58.8 | 92.4 | |||
| SS + HC + TST + aCXR | 100.0 | 99.2 | 100.0 | 95.7 | 100.0 | 91.0 | |||
| BMoH: cutoff 30 | 10.2 | 100.0 | 37.2 | 99.7 | 58.1 | 99.4 | |||
| BMoH: cutoff 40 | 19.2 | 99.7 | 55.4 | 98.5 | 74.5 | 96.5 | |||
| IUATLD I | 6.4 | 99.3 | 26.3 | 96.2 | 45.6 | 91.6 | |||
| IUATLD S | 16.6 | 99.2 | 50.9 | 96.1 | 70.9 | 91.3 | |||
Legend: VPP: Positive Predictive Value; VPN: Negative Predictive Value; SS: One or more sign or symptom; HC: History of contact; TST: Positive tuberculin skin test; aCXR: Altered chest X-ray; BMoH: Brazilian Ministry of Health; IUATLD: International Union Against Tuberculosis and Lung Disease.
In this study, an expert panel of physicians was employed to directly compare the performance of different tests used in the diagnosis of pediatric TB. We found that while the presence of one or more sign or symptom, history of TB contact, and aCXR had the highest single test sensitivities, the combination of these tests with TST showed highest accuracy and resulted in a PPV of 100% in TB prevalence rates varying from 1% to 11%.
Evaluating the two diagnostic scoring systems, our findings reaffirmed high sensitivity of the BMoH system with cut off of 30 and high specificity with a cut off 40, as well as an NPV above 95%.14 Our study is the first to evaluate the IUATLD system in a Brazilian population, which was previously shown a range of sensitivity and specificity of this system in different populations.10 In our cohort, this system showed low sensitivity and high specificity. aCXR was the single diagnostic test that showed highest sensitivity, accuracy and PPV. While this strongly supports the use of CXR in diagnosis, it is important to note that the clinical implementation of this examination can be cumbersome, as good image quality and trained readers are required for reliable interpretation.15 The IUATLD system was developed for low-resource settings and does not include CXR.10 Compared to our analysis of combinations of tests excluding CXR, the IUATLD system had the highest PPV, confirming that this system can be useful as a TB diagnostic approach in regions where CXR is not available.
To further evaluate the tests as a point of care diagnosis approach, we also assessed performance in the absence of CXR and TST results. We found that—compared to the combination of signs/symptoms, history of contact, aCXR, and TST—signs/symptoms and history of contact alone showed a doubling in sensitivity and a reduction in specificity. Moreover, while PPV was greatly reduced, NPV increased in the absence of CXR and TST results. Together, these findings indicate that presence of signs/symptoms and history of contact are useful tests in point of care diagnosis for ruling out TB suspects.
The presence of at least one sign or symptom alone also showed high single test sensitivity, though each signs and symptoms evaluated individually had a much lower sensitivity. In previous studies, the individual sign or symptom with the best performance has varied.16–20 Together with our data, this suggests it is important to consider all signs and symptoms rather than focus on a particular one when diagnosing pediatric patients. Further, many cases of pediatric TB may be asymptomatic.21,22 Along with our findings showing the increased sensitivity, accuracy, and PPV of signs and symptoms in combination with other diagnostic tests, this indicates that signs and symptoms are best interpreted along with other diagnostic tests.
Pediatric TB may have high mortality if not detected and treated, though with proper treatment, outcomes are generally good and few adverse effects are observed.23 Therefore, diagnostic tests should prioritize the avoidance of false negatives over false positives.9 Therefore in this study we focused on identifying tests with high sensitivity and accuracy, rather than specificity.
In our cohort, a slightly larger percentage of NTB cases had history of TB contact, yet TB contact was part of the test combination that showed the highest accuracy. It has previously been shown that history of TB contact is an important risk factor for childhood TB in low-incidence settings, though it is less informative in high-incidence settings.19,22,24 At our teaching hospital, the majority of pediatric patients evaluated for TB are contacts of adult TB cases, and thus it is not surprising that history of contact alone is insufficient for diagnosis. The TB cases had a significantly higher rate exposure to multiple contacts (p = 0.02), which may have led to a greater burden of exposure and illness. Thus, while TB contact is an important diagnostic test, our results indicate that it is best applied in combination with other tests. Thus, the use of diagnostic scores as auxiliary tools in the diagnosis of TB is favored, since in isolation both TST and contact history are little help in the diagnosis, especially in places of high incidence of TB.
Others potential limitations of our study is that TST was conducted and read at different locations prior to patient arrival at the hospital. However, in Brazil these tests can only be conducted, in the public health system, by a trained health official using standardized tool. Thus, we believe variability in interpretation to be low. Additionally, chest radiographs were read by the attending physician of each subject, and therefore also may vary in their interpretation. BMoH, since its first publication has undergone some changes, especially related to the TST, the last change was in 2019. This score should still be validated with the current data.
ConclusionIn conclusion, using an expert panel to define the gold standard for TB diagnosis, we were able to compare the performance of individual and combinations of pediatric diagnostic tests. These are simple, low-cost triage tests that can be used as a rule-out diagnostic by first-contact care providers, including physicians and community health workers, as recommended by WHO. Moreover, the BMoH system also performed well in our cohort. Thus, it should continue to be widely used in Brazil in settings with low HIV prevalence.
FundingThis work was supported by Project ICOHRTA (International Clinical, Operational, and Health Services Research and Training Award) and Fogarty International Center grants # U2RTW006885 ICOHRTA and #R25TW009338. Dr Isabela Almeida, received founds for this work under the pos-doc schollarship. Process – CNPq /INCT 465318/2014-2.
Ethical approvalThis study was approved by the Ethics Committee of the Clinical Hospital of the Federal University of Paraná (CAAEE 0126.0208.000-08. 26/06/2008).
Conflicts of interestThe authors declare that there is no conflict of interest.
The authors thank the support of Project ICOHRTA and Fogarty International Center grants. The National Council for Scientific and Technological Development – CnpQ and The Brazilian Tuberculosis Research Network – REDE-TB.


