
Indoor and outdoor mould exposure can affect respiratory symptoms, but its contribution to COPD outcomes such as exacerbation rates or antibiotics courses is not well defined. Some patients with COPD develop chronic pulmonary aspergillosis (CPA), but the contribution of environmental exposure is not known.
MethodsWe correlated activities or exposures related to mould with COPD outcomes in patients with COPD with or without CPA using a questionnaire.
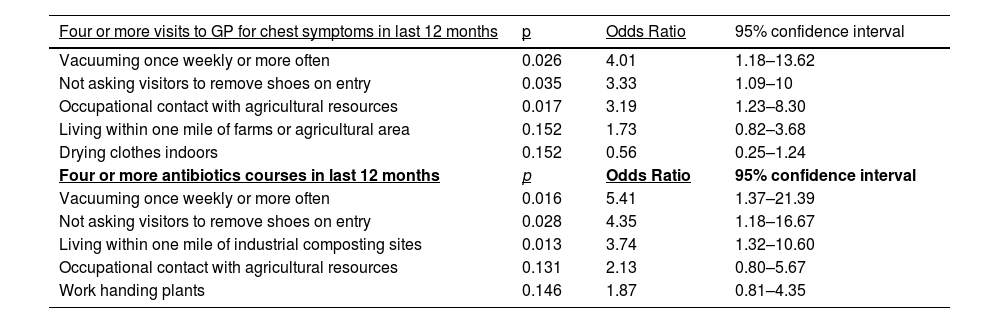
ResultsOne hundred and forty patients were included and 60 had CPA in addition to COPD. Seventy-six were male and mean age was 66.9 years (range 40–87). Thirty-nine (28%) were active cigarette smokers. On multivariate analysis, occupational contact with agricultural resources (p = 0.017), vacuuming once weekly or more often (p = 0.026) and not asking visitors to remove shoes on home entry (p = 0.035) were significantly more common in participants reporting ≥ 4 office visits for COPD symptoms in the last year. Living within one mile of industrial composting sites (p = 0.013), vacuuming once weekly or more often (p = 0.016) and not asking visitors to remove shoes on home entry (p = 0.028) were significantly more common in participants reporting ≥4 antibiotics courses in the last year. Patients with CPA showed a trend for residence within one mile of farms or agricultural areas (P = 0.088, OR 2, 95% CI 0.9–4.4).
ConclusionActivities potentially leading to mould exposure were common in a population with COPD with or without CPA and were associated with adverse COPD outcomes. Environmental mould exposure may play a role in the development of CPA in patients with COPD.
Environmental exposure to mould has been shown to have detrimental effects on people with lung conditions. The association has been well documented in children, adolescents and adults with asthma, with less evidence available for other chronic lung conditions.1–3 Indoor vs. outdoor exposure, and rural vs. urban surroundings, may have different contributions in various settings.4,5 Amongst the multitude of environmental fungi, Aspergillus has been linked with pathology in patients with chronic lung disease, in the forms of invasive, chronic and allergic pulmonary aspergillosis.6,7
Aspergillus is a common environmental mould, prevalent in most surroundings, but existing in higher concentrations in damp or dusty environments, such as decaying vegetation, compost, or as visible mould indoors. In addition, some occupations may lead to more fungal exposure than others, as has been documented in cases of allergic bronchopulmonary aspergillosis.8,9 Fungal exposure may have additional detrimental effects besides the respiratory system, such as constitutional or neurological symptoms, and real or perceived exposure to mould can be a source of distress for patients and healthy individuals alike.10,11
In contrast to the links between fungal exposure and asthma, the effect of environmental mould on the symptoms and course of chronic obstructive pulmonary disease (COPD) is not clear. COPD is associated with significant morbidity and mortality: in addition to chronic progression of respiratory decline, acute exacerbations result in outpatient or hospital visits, admissions to hospitals and frequent antibiotic use, which promotes antimicrobial resistance. Multiple hospital admissions with exacerbations are associated with substantial mortality; therefore, preventing them is a key COPD treatment target.12–14
Patients with COPD have a higher frequency of Aspergillus sensitisation than smokers without COPD, and Aspergillus-sensitised patients are more likely to have worse lung function and bronchiectasis than the non-sensitised.15 It is possible that fungal sensitisation in COPD is caused by substantial fungal exposure in the environment. There is evidence that Aspergillus-specific T-lymphocytes are more abundant in the blood of people who have been exposed to Aspergillus through specific indoor or outdoor activities.16 In addition, the same resistant Aspergillus strains were cultured from respiratory secretions of COPD patients and from patients with invasive aspergillosis and their homes.17,18 In a small number of COPD patients, quantity of fungi in floor dust was associated with poorer lung function.19 If specific activities linked to mould exposure can be shown to affect COPD symptoms or outcomes, this information can inform advice on avoidance of certain high-risk exposures which in turn can lead to a reduction in the number of exacerbations and prevention of deterioration of lung function.
Chronic pulmonary aspergillosis (CPA) is a slowly progressive debilitating condition affecting mainly patients with chronic lung disease like COPD or previous tuberculosis. Unless recognised and treated, it can progress and lead to poor quality of life. It is not clear why some patients with COPD develop CPA; genetic associations have been suggested.20 The importance of the environment in the development of CPA has not been investigated, although it has been shown that immunocompromised patients with self-reported domestic fungal exposure were more likely to develop invasive aspergillosis.21 Therefore, it is possible that particular high-risk exposures may predispose to CPA in patients with COPD.
The aim of this study is to describe the effect of self-reported indoor, outdoor, and occupational fungal exposure on COPD outcomes such as exacerbations, antibiotics courses and hospital visits and to explore the connection between fungal exposure and the development of CPA.
MethodsParticipants and recruitment methodsPatients with COPD attending the clinics of the North West Lung Centre, Manchester University NHS Foundation Trust, were eligible. Recruitment started in June 2019. Consecutive participants were approached after their clinic appointment and asked to complete a questionnaire after written consent. Recruitment was from a specialist COPD clinic and a specialist CPA clinic. The patient populations attending the two clinics are different and distinct, as the specialist CPA clinic is a national CPA referral centre (National Aspergillosis Centre). The diagnosis of CPA was confirmed with the treating physician and from the medical notes after the clinic appointment.
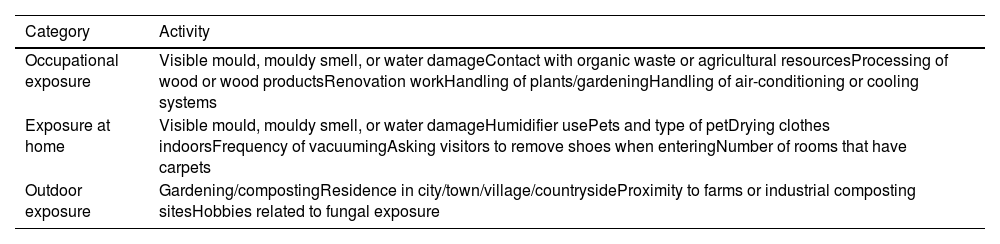
The standardised questionnaire included questions on potential exposure to mould at work, at home or outdoors (Table 1). For all categories, current as well as prior, exposure was recorded. In addition, COPD outcomes included self-reported number of General Practitioner (GP) appointments for respiratory symptoms, numbers of antibiotics courses received, numbers of Emergency Department visits and number of hospital admissions for respiratory complaints over the previous 12 months. Participants with more than four visits or antibiotics courses were recorded as ‘five or more’ rather than the exact number to reduce recall bias. Smoking history and number of years with COPD diagnosis were documented. The full questionnaire is provided in the Appendix. During development, the questionnaire was shown to 10 patients with COPD and changes made according to feedback.
Activities included in questionnaire.
Information recorded from the medical notes included demographics, the most recent lung function tests including FEV1 and FVC, peripheral eosinophil count, Aspergillus serology when available, and presence of concomitant CPA.
In March 2020, face-to-face recruitment ceased due to the COVID-19 pandemic. At that stage, we reverted to recruitment using the Research for the Future Programme (NIHR Clinical Research Network, North West E Health, Health Innovation Manchester and Northern Care Alliance NHS Group). From that point on, recruitment was through online questionnaire.
The study received ethical approval from the NHS Health Research Authority (REC Reference 19/SC/0103).
Statistical analysisThe association of all types of activities, clinical information, and demographics with each of the COPD outcomes was performed with chi square test for categorical variables, with T-Test for continuous normally distributed variables and Mann-Whitney U test for not normally distributed variables. Normality was checked with the Shapiro-Wilk test. All parameters with a p value < 0.1 were included in further analysis (binary logistic regression when the outcomes were considered as < 4 or ≥ 4 events per year, and linear regression when the outcomes were considered as a continuous variable). A p value of < 0.05 was considered statistically significant. All patients with COPD were included in the analysis for COPD outcomes. Patients with COPD/CPA were compared to those with COPD without CPA for the analysis of risk factors associated with CPA. Statistical analyses were performed using IBM SPSS Statistics for Windows, Version 23.0. Armonk, NY: IBM Corp.
ResultsOne hundred and four patients were recruited face-to-face and 36 through online questionnaire. Seventy-six (54%) were male and mean age was 66.9 years (range 40–87). The mean time (±SD) since the diagnosis of COPD was 11.5 (±9.4) years. Thirty-nine (28%) were active cigarette smokers, 13 (9%) were active e-cigarette smokers and four (3%) were active cannabis smokers.
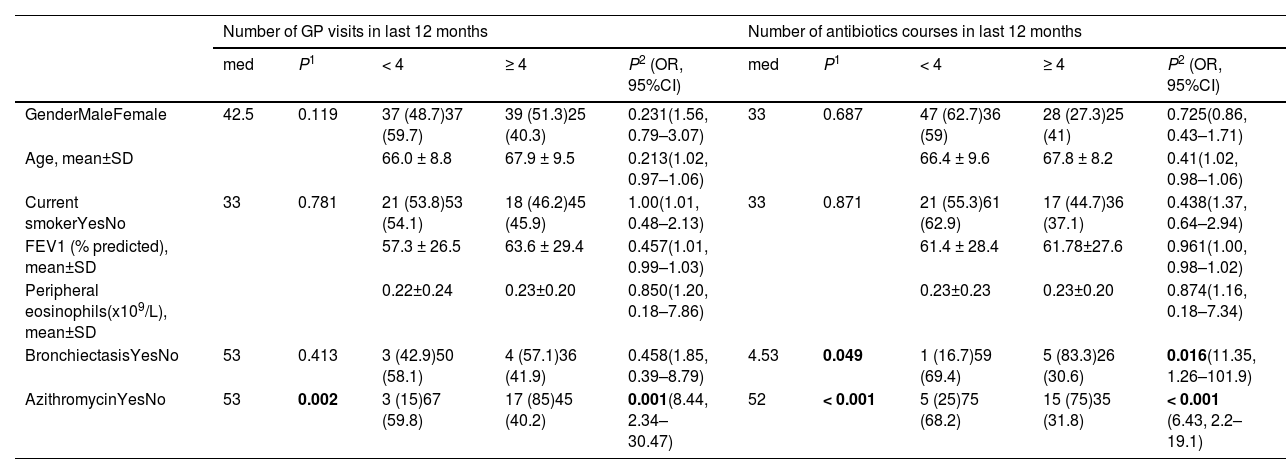
Mean FEV1 (±SD) was 60.5% (±29) predicted. One hundred and twenty-one (87%) saw their GP in the preceding year for respiratory complaints and 64 (46%) attended four times or more. One hundred and ten (81%) received antibiotics for a chest infection in the last year, and 54 (40%) had four or more courses. Forty-four (32%) visited the emergency department with respiratory symptoms and 38 (18%) were admitted to hospital in the last 12 months. Sixty (43%) had the diagnosis of CPA in addition to COPD. Table 2 shows GP visits and antibiotics courses in relation to demographics, lung function, smoking status, and laboratory parameters. Emergency department visits in relation to these parameters are shown in the Appendix (Table 1A).
COPD outcomes in relation to demographics and pertinent clinical information.
| Number of GP visits in last 12 months | Number of antibiotics courses in last 12 months | |||||||||
|---|---|---|---|---|---|---|---|---|---|---|
| med | P1 | < 4 | ≥ 4 | P2 (OR, 95%CI) | med | P1 | < 4 | ≥ 4 | P2 (OR, 95%CI) | |
| GenderMaleFemale | 42.5 | 0.119 | 37 (48.7)37 (59.7) | 39 (51.3)25 (40.3) | 0.231(1.56, 0.79–3.07) | 33 | 0.687 | 47 (62.7)36 (59) | 28 (27.3)25 (41) | 0.725(0.86, 0.43–1.71) |
| Age, mean±SD | 66.0 ± 8.8 | 67.9 ± 9.5 | 0.213(1.02, 0.97–1.06) | 66.4 ± 9.6 | 67.8 ± 8.2 | 0.41(1.02, 0.98–1.06) | ||||
| Current smokerYesNo | 33 | 0.781 | 21 (53.8)53 (54.1) | 18 (46.2)45 (45.9) | 1.00(1.01, 0.48–2.13) | 33 | 0.871 | 21 (55.3)61 (62.9) | 17 (44.7)36 (37.1) | 0.438(1.37, 0.64–2.94) |
| FEV1 (% predicted), mean±SD | 57.3 ± 26.5 | 63.6 ± 29.4 | 0.457(1.01, 0.99–1.03) | 61.4 ± 28.4 | 61.78±27.6 | 0.961(1.00, 0.98–1.02) | ||||
| Peripheral eosinophils(x109/L), mean±SD | 0.22±0.24 | 0.23±0.20 | 0.850(1.20, 0.18–7.86) | 0.23±0.23 | 0.23±0.20 | 0.874(1.16, 0.18–7.34) | ||||
| BronchiectasisYesNo | 53 | 0.413 | 3 (42.9)50 (58.1) | 4 (57.1)36 (41.9) | 0.458(1.85, 0.39–8.79) | 4.53 | 0.049 | 1 (16.7)59 (69.4) | 5 (83.3)26 (30.6) | 0.016(11.35, 1.26–101.9) |
| AzithromycinYesNo | 53 | 0.002 | 3 (15)67 (59.8) | 17 (85)45 (40.2) | 0.001(8.44, 2.34–30.47) | 52 | < 0.001 | 5 (25)75 (68.2) | 15 (75)35 (31.8) | < 0.001 (6.43, 2.2–19.1) |
Significant values in bold. GP: general practitioner; OR: odds ratio; CI: confidence interval; med: median values; SD: standard deviation; FEV1: forced expiratory volume in one second. Numbers are n (%) unless otherwise specified.
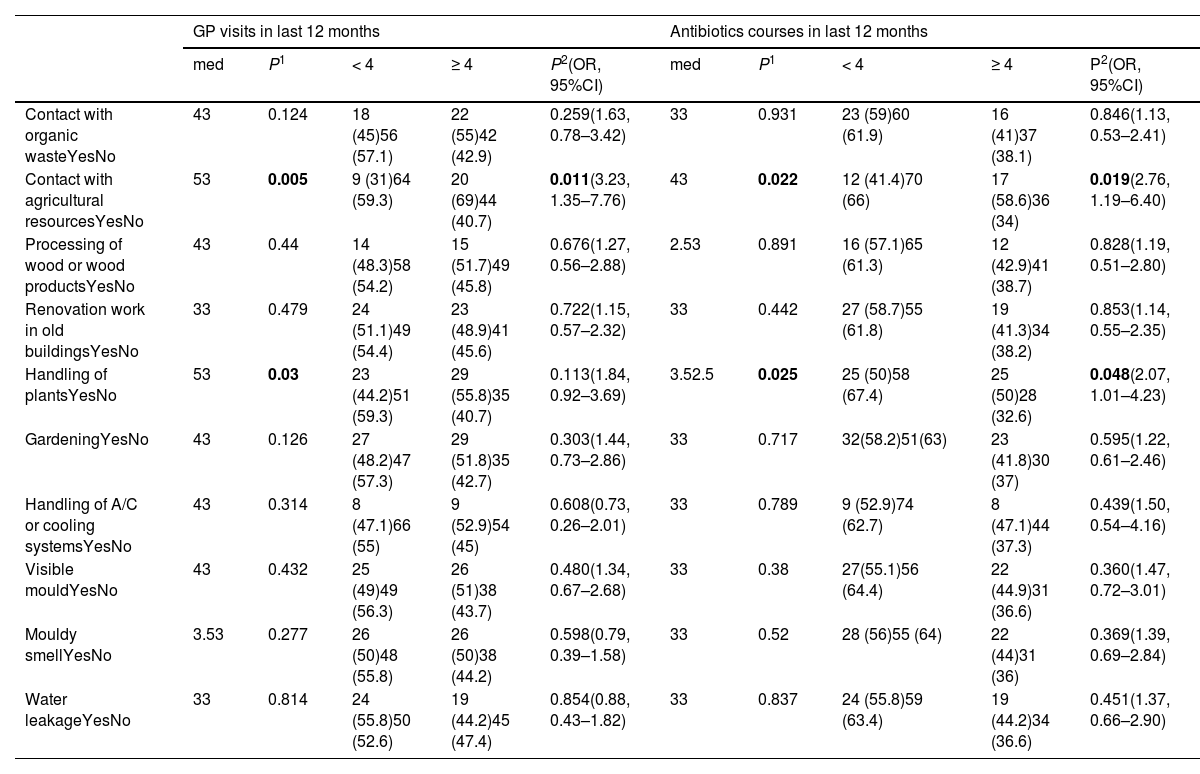
Seventeen patients were working at the time of the interview, 25 did not disclose their occupation status and 98 were retired or unemployed. Occupational exposures, either present or previous, reported by participants were: gardening (40%), handling plants (37%), mouldy smell at workplace (37%), visible mould at workplace (36%), renovation work in old buildings (34%), water leakage (31%), contact with organic waste (29%), contact with agricultural resources (21%), processing wood and wood products (21%) and handling air-conditioning and cooling systems (12%). Table 3 shows the association between COPD outcomes and occupational mould exposures.
COPD outcomes in relation to occupational exposure to mould, previous or current.
| GP visits in last 12 months | Antibiotics courses in last 12 months | |||||||||
|---|---|---|---|---|---|---|---|---|---|---|
| med | P1 | < 4 | ≥ 4 | P2(OR, 95%CI) | med | P1 | < 4 | ≥ 4 | P2(OR, 95%CI) | |
| Contact with organic wasteYesNo | 43 | 0.124 | 18 (45)56 (57.1) | 22 (55)42 (42.9) | 0.259(1.63, 0.78–3.42) | 33 | 0.931 | 23 (59)60 (61.9) | 16 (41)37 (38.1) | 0.846(1.13, 0.53–2.41) |
| Contact with agricultural resourcesYesNo | 53 | 0.005 | 9 (31)64 (59.3) | 20 (69)44 (40.7) | 0.011(3.23, 1.35–7.76) | 43 | 0.022 | 12 (41.4)70 (66) | 17 (58.6)36 (34) | 0.019(2.76, 1.19–6.40) |
| Processing of wood or wood productsYesNo | 43 | 0.44 | 14 (48.3)58 (54.2) | 15 (51.7)49 (45.8) | 0.676(1.27, 0.56–2.88) | 2.53 | 0.891 | 16 (57.1)65 (61.3) | 12 (42.9)41 (38.7) | 0.828(1.19, 0.51–2.80) |
| Renovation work in old buildingsYesNo | 33 | 0.479 | 24 (51.1)49 (54.4) | 23 (48.9)41 (45.6) | 0.722(1.15, 0.57–2.32) | 33 | 0.442 | 27 (58.7)55 (61.8) | 19 (41.3)34 (38.2) | 0.853(1.14, 0.55–2.35) |
| Handling of plantsYesNo | 53 | 0.03 | 23 (44.2)51 (59.3) | 29 (55.8)35 (40.7) | 0.113(1.84, 0.92–3.69) | 3.52.5 | 0.025 | 25 (50)58 (67.4) | 25 (50)28 (32.6) | 0.048(2.07, 1.01–4.23) |
| GardeningYesNo | 43 | 0.126 | 27 (48.2)47 (57.3) | 29 (51.8)35 (42.7) | 0.303(1.44, 0.73–2.86) | 33 | 0.717 | 32(58.2)51(63) | 23 (41.8)30 (37) | 0.595(1.22, 0.61–2.46) |
| Handling of A/C or cooling systemsYesNo | 43 | 0.314 | 8 (47.1)66 (55) | 9 (52.9)54 (45) | 0.608(0.73, 0.26–2.01) | 33 | 0.789 | 9 (52.9)74 (62.7) | 8 (47.1)44 (37.3) | 0.439(1.50, 0.54–4.16) |
| Visible mouldYesNo | 43 | 0.432 | 25 (49)49 (56.3) | 26 (51)38 (43.7) | 0.480(1.34, 0.67–2.68) | 33 | 0.38 | 27(55.1)56 (64.4) | 22 (44.9)31 (36.6) | 0.360(1.47, 0.72–3.01) |
| Mouldy smellYesNo | 3.53 | 0.277 | 26 (50)48 (55.8) | 26 (50)38 (44.2) | 0.598(0.79, 0.39–1.58) | 33 | 0.52 | 28 (56)55 (64) | 22 (44)31 (36) | 0.369(1.39, 0.69–2.84) |
| Water leakageYesNo | 33 | 0.814 | 24 (55.8)50 (52.6) | 19 (44.2)45 (47.4) | 0.854(0.88, 0.43–1.82) | 33 | 0.837 | 24 (55.8)59 (63.4) | 19 (44.2)34 (36.6) | 0.451(1.37, 0.66–2.90) |
Significant values in bold. GP: general practitioner; med: median numbers; OR: odds ratio; CI: confidence interval; A/C: air conditioning. Numbers are n (%) unless otherwise specified.
Area of residence was reported as ‘town’ in 67 (48%), ‘city’ in 30 (21%), ‘village’ in 28 (20%) and ‘countryside’ in 15 (11%). Eighty-eight (63%) lived in a home built more than 40 years ago. The most frequent form of accommodation was house (n = 88, 63%), followed by flat (n = 28, 20%) and bungalow (n = 21, 15%). Reported potential mould exposures at home were: having a garden (85%), vacuuming weekly or more often (85%), not asking visitors to remove shoes when entering the property (83%), drying clothes indoors (64%), gardening (55%), living within one mile of farms or agricultural areas (51%), having carpets in most rooms (49%), using compost when gardening (41%), visible mould in the home (39%), owning pets (38%), composting of garden waste (23%), mouldy smell at home (18%), water damage (15%), living within one mile of an industrial composting site (16%) and use of a humidifier (11%).
Among pet owners, 59 (42%) had dogs and 46 (33%) had cats. Fifty-five participants reported visible mould in the home, specifically: 31 (22%) in the bedroom, 26 (19%) in the bathroom, nine (6%) in the kitchen and seven (5%) in the living room. Hobbies exposing to mould were reported by 14 (9%); these included walking in parks, farming, gardening, golf, decorating, renovating and animal breeding. Tables 4 and 5 show the association between COPD outcomes and domestic and outdoor exposure to mould, respectively. Table 6 shows the results of the multivariate analysis for the various COPD outcomes. The correlation between another COPD outcome, emergency department visits, and various exposures is included in the Appendix (Table 2A).
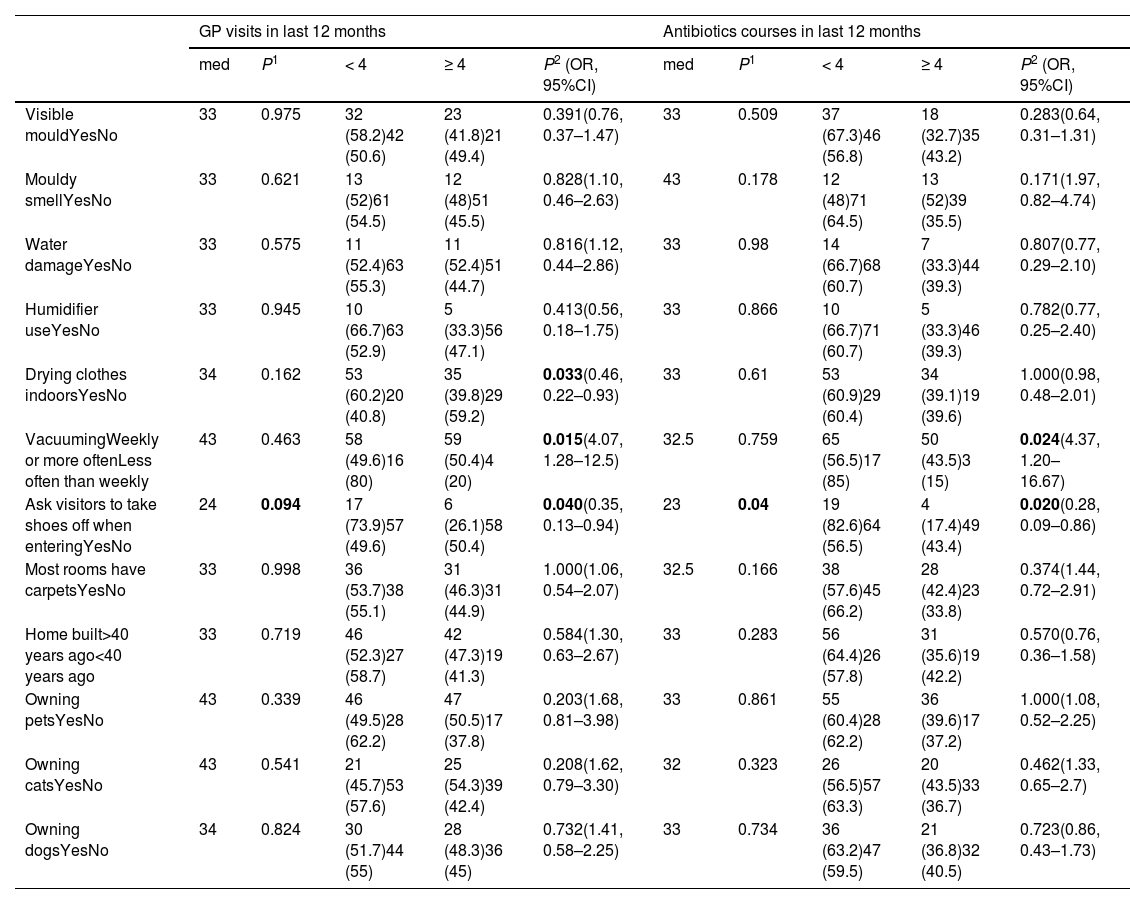
COPD outcomes in relation to domestic exposure to mould.
| GP visits in last 12 months | Antibiotics courses in last 12 months | |||||||||
|---|---|---|---|---|---|---|---|---|---|---|
| med | P1 | < 4 | ≥ 4 | P2 (OR, 95%CI) | med | P1 | < 4 | ≥ 4 | P2 (OR, 95%CI) | |
| Visible mouldYesNo | 33 | 0.975 | 32 (58.2)42 (50.6) | 23 (41.8)21 (49.4) | 0.391(0.76, 0.37–1.47) | 33 | 0.509 | 37 (67.3)46 (56.8) | 18 (32.7)35 (43.2) | 0.283(0.64, 0.31–1.31) |
| Mouldy smellYesNo | 33 | 0.621 | 13 (52)61 (54.5) | 12 (48)51 (45.5) | 0.828(1.10, 0.46–2.63) | 43 | 0.178 | 12 (48)71 (64.5) | 13 (52)39 (35.5) | 0.171(1.97, 0.82–4.74) |
| Water damageYesNo | 33 | 0.575 | 11 (52.4)63 (55.3) | 11 (52.4)51 (44.7) | 0.816(1.12, 0.44–2.86) | 33 | 0.98 | 14 (66.7)68 (60.7) | 7 (33.3)44 (39.3) | 0.807(0.77, 0.29–2.10) |
| Humidifier useYesNo | 33 | 0.945 | 10 (66.7)63 (52.9) | 5 (33.3)56 (47.1) | 0.413(0.56, 0.18–1.75) | 33 | 0.866 | 10 (66.7)71 (60.7) | 5 (33.3)46 (39.3) | 0.782(0.77, 0.25–2.40) |
| Drying clothes indoorsYesNo | 34 | 0.162 | 53 (60.2)20 (40.8) | 35 (39.8)29 (59.2) | 0.033(0.46, 0.22–0.93) | 33 | 0.61 | 53 (60.9)29 (60.4) | 34 (39.1)19 (39.6) | 1.000(0.98, 0.48–2.01) |
| VacuumingWeekly or more oftenLess often than weekly | 43 | 0.463 | 58 (49.6)16 (80) | 59 (50.4)4 (20) | 0.015(4.07, 1.28–12.5) | 32.5 | 0.759 | 65 (56.5)17 (85) | 50 (43.5)3 (15) | 0.024(4.37, 1.20–16.67) |
| Ask visitors to take shoes off when enteringYesNo | 24 | 0.094 | 17 (73.9)57 (49.6) | 6 (26.1)58 (50.4) | 0.040(0.35, 0.13–0.94) | 23 | 0.04 | 19 (82.6)64 (56.5) | 4 (17.4)49 (43.4) | 0.020(0.28, 0.09–0.86) |
| Most rooms have carpetsYesNo | 33 | 0.998 | 36 (53.7)38 (55.1) | 31 (46.3)31 (44.9) | 1.000(1.06, 0.54–2.07) | 32.5 | 0.166 | 38 (57.6)45 (66.2) | 28 (42.4)23 (33.8) | 0.374(1.44, 0.72–2.91) |
| Home built>40 years ago<40 years ago | 33 | 0.719 | 46 (52.3)27 (58.7) | 42 (47.3)19 (41.3) | 0.584(1.30, 0.63–2.67) | 33 | 0.283 | 56 (64.4)26 (57.8) | 31 (35.6)19 (42.2) | 0.570(0.76, 0.36–1.58) |
| Owning petsYesNo | 43 | 0.339 | 46 (49.5)28 (62.2) | 47 (50.5)17 (37.8) | 0.203(1.68, 0.81–3.98) | 33 | 0.861 | 55 (60.4)28 (62.2) | 36 (39.6)17 (37.2) | 1.000(1.08, 0.52–2.25) |
| Owning catsYesNo | 43 | 0.541 | 21 (45.7)53 (57.6) | 25 (54.3)39 (42.4) | 0.208(1.62, 0.79–3.30) | 32 | 0.323 | 26 (56.5)57 (63.3) | 20 (43.5)33 (36.7) | 0.462(1.33, 0.65–2.7) |
| Owning dogsYesNo | 34 | 0.824 | 30 (51.7)44 (55) | 28 (48.3)36 (45) | 0.732(1.41, 0.58–2.25) | 33 | 0.734 | 36 (63.2)47 (59.5) | 21 (36.8)32 (40.5) | 0.723(0.86, 0.43–1.73) |
Significant values in bold. GP: general practitioner; med: median numbers; OR: odds ratio; CI: confidence interval. Numbers are n (%) unless otherwise specified.
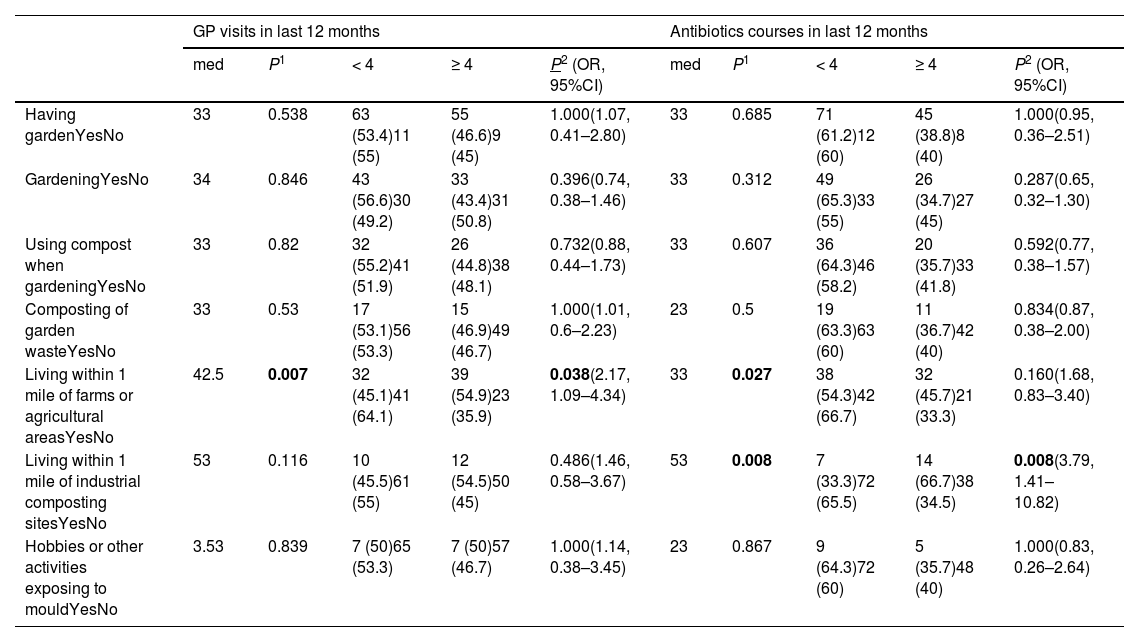
COPD outcomes in relation to outdoors exposure to mould.
| GP visits in last 12 months | Antibiotics courses in last 12 months | |||||||||
|---|---|---|---|---|---|---|---|---|---|---|
| med | P1 | < 4 | ≥ 4 | P2 (OR, 95%CI) | med | P1 | < 4 | ≥ 4 | P2 (OR, 95%CI) | |
| Having gardenYesNo | 33 | 0.538 | 63 (53.4)11 (55) | 55 (46.6)9 (45) | 1.000(1.07, 0.41–2.80) | 33 | 0.685 | 71 (61.2)12 (60) | 45 (38.8)8 (40) | 1.000(0.95, 0.36–2.51) |
| GardeningYesNo | 34 | 0.846 | 43 (56.6)30 (49.2) | 33 (43.4)31 (50.8) | 0.396(0.74, 0.38–1.46) | 33 | 0.312 | 49 (65.3)33 (55) | 26 (34.7)27 (45) | 0.287(0.65, 0.32–1.30) |
| Using compost when gardeningYesNo | 33 | 0.82 | 32 (55.2)41 (51.9) | 26 (44.8)38 (48.1) | 0.732(0.88, 0.44–1.73) | 33 | 0.607 | 36 (64.3)46 (58.2) | 20 (35.7)33 (41.8) | 0.592(0.77, 0.38–1.57) |
| Composting of garden wasteYesNo | 33 | 0.53 | 17 (53.1)56 (53.3) | 15 (46.9)49 (46.7) | 1.000(1.01, 0.6–2.23) | 23 | 0.5 | 19 (63.3)63 (60) | 11 (36.7)42 (40) | 0.834(0.87, 0.38–2.00) |
| Living within 1 mile of farms or agricultural areasYesNo | 42.5 | 0.007 | 32 (45.1)41 (64.1) | 39 (54.9)23 (35.9) | 0.038(2.17, 1.09–4.34) | 33 | 0.027 | 38 (54.3)42 (66.7) | 32 (45.7)21 (33.3) | 0.160(1.68, 0.83–3.40) |
| Living within 1 mile of industrial composting sitesYesNo | 53 | 0.116 | 10 (45.5)61 (55) | 12 (54.5)50 (45) | 0.486(1.46, 0.58–3.67) | 53 | 0.008 | 7 (33.3)72 (65.5) | 14 (66.7)38 (34.5) | 0.008(3.79, 1.41–10.82) |
| Hobbies or other activities exposing to mouldYesNo | 3.53 | 0.839 | 7 (50)65 (53.3) | 7 (50)57 (46.7) | 1.000(1.14, 0.38–3.45) | 23 | 0.867 | 9 (64.3)72 (60) | 5 (35.7)48 (40) | 1.000(0.83, 0.26–2.64) |
Significant values in bold. GP: general practitioner; med: median numbers; OR: odds ratio; CI: confidence interval. Numbers are n (%) unless otherwise specified.
Multivariate analysis of the risk factors for GP attendance and antibiotic prescription.
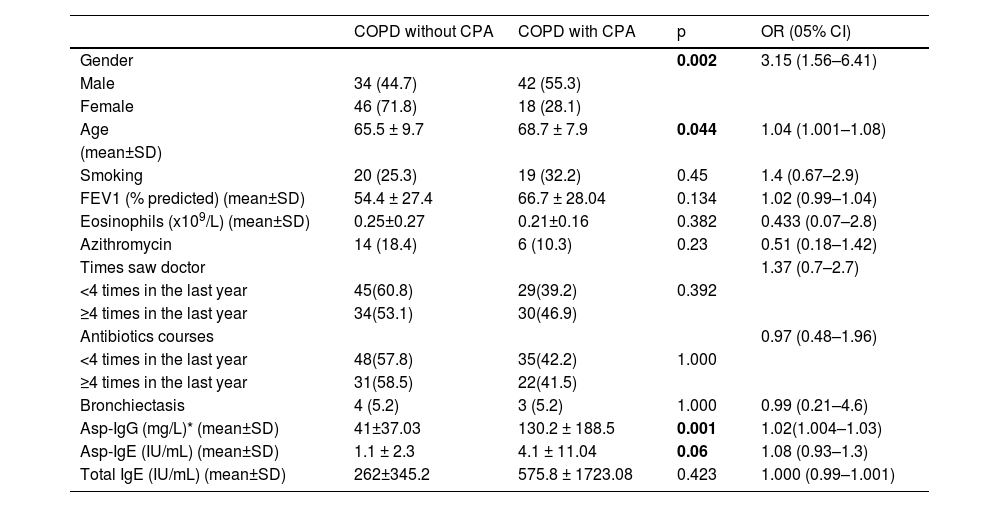
Table 7 shows the baseline characteristics of patients with and without CPA. On univariate analysis, reported exposures significantly more common in patients with CPA were: contact with agricultural resources at work (p = 0.058, Odds Ratio [OR] 2.29, 95% Confidence interval [CI] 0.98–5.28), processing wood or wood products at work (p = 0.06, OR 2.26, 95% CI 0.98–5.2), water leakage at work (p = 0.044, OR 2.14, 95% CI 1.03–4.44), not drying clothes indoor (p = 0.020, OR 2.42, 95% CI 1.19- 4.92) and living within one mile of farms or agricultural areas (p = 0.015, OR 2.48, 95% CI 1.23–4.97). On multivariate analysis, only residence within one mile of farms or agricultural areas showed a trend (P = 0.088, OR 2, 95% CI 0.9–4.4) towards being more common in patients with CPA.
Characteristics of patients with COPD with and without chronic pulmonary aspergillosis.
| COPD without CPA | COPD with CPA | p | OR (05% CI) | |
|---|---|---|---|---|
| Gender | 0.002 | 3.15 (1.56–6.41) | ||
| Male | 34 (44.7) | 42 (55.3) | ||
| Female | 46 (71.8) | 18 (28.1) | ||
| Age | 65.5 ± 9.7 | 68.7 ± 7.9 | 0.044 | 1.04 (1.001–1.08) |
| (mean±SD) | ||||
| Smoking | 20 (25.3) | 19 (32.2) | 0.45 | 1.4 (0.67–2.9) |
| FEV1 (% predicted) (mean±SD) | 54.4 ± 27.4 | 66.7 ± 28.04 | 0.134 | 1.02 (0.99–1.04) |
| Eosinophils (x109/L) (mean±SD) | 0.25±0.27 | 0.21±0.16 | 0.382 | 0.433 (0.07–2.8) |
| Azithromycin | 14 (18.4) | 6 (10.3) | 0.23 | 0.51 (0.18–1.42) |
| Times saw doctor | 1.37 (0.7–2.7) | |||
| <4 times in the last year | 45(60.8) | 29(39.2) | 0.392 | |
| ≥4 times in the last year | 34(53.1) | 30(46.9) | ||
| Antibiotics courses | 0.97 (0.48–1.96) | |||
| <4 times in the last year | 48(57.8) | 35(42.2) | 1.000 | |
| ≥4 times in the last year | 31(58.5) | 22(41.5) | ||
| Bronchiectasis | 4 (5.2) | 3 (5.2) | 1.000 | 0.99 (0.21–4.6) |
| Asp-IgG (mg/L)* (mean±SD) | 41±37.03 | 130.2 ± 188.5 | 0.001 | 1.02(1.004–1.03) |
| Asp-IgE (IU/mL) (mean±SD) | 1.1 ± 2.3 | 4.1 ± 11.04 | 0.06 | 1.08 (0.93–1.3) |
| Total IgE (IU/mL) (mean±SD) | 262±345.2 | 575.8 ± 1723.08 | 0.423 | 1.000 (0.99–1.001) |
CPA: chronic pulmonary aspergillosis; OR: Odds Ratio; CI: confidence interval. Numbers are n(%) unless otherwise specified.
Activities and exposures related to mould were common in a patient population with COPD seen in secondary care in England and several of these exposures were associated with adverse outcomes such as increased rates of exacerbations and antibiotics courses. In contrast, we did not find an association between these outcomes and eosinophil counts, current smoking, FEV1, or time from COPD diagnosis. In addition, the specific exposures included in this questionnaire did not appear to be a risk factor for CPA in patients with COPD, except for residence in proximity of agricultural areas.
Patients reporting residence in proximity to industrial composting sites or agricultural areas such as farms, suffered from higher frequencies of exacerbations and office visits. An association has been reported previously: a study from the Netherlands reported a higher frequency of wheezing in COPD patients living in areas of higher livestock farm density.22 However, the rate of COPD and asthma was actually found to be lower in the vicinity of farms in this and another study from the same country.23 This is likely due to demographic reasons and not a specific effect of agricultural exposure. Rural residence in the US was linked with 70% more exacerbations, but not with worse baseline symptoms.24
Certain domestic exposures exhibited a stronger association with adverse COPD outcomes. Participants who reported vacuuming more frequently had more GP visits or antibiotics courses on multivariate analyses. Vacuuming may aerosolise non-biological and biological particles including bacteria and fungi in the environment, either from settled dust or from the cleaner bag.25,26 Significant diversity was found in vacuum cleaner emission rates from various studies, and it is not clear if the type of home or brand or age of vacuum cleaner may affect these results. The relative contribution of bacteria, fungi, or non-biological aerosols of vacuum cleaner emissions to respiratory symptoms in patients with chronic lung disease such as COPD has not yet been assessed. In addition, colonisation with bacteria and fungi can occur in surfaces such as shoes which therefore may be responsible for introducing a higher burden of allergens or pathogens in the home. Cultural practices differ, but in our survey most participants would not ask visitors to remove their shoes on entry. It may be that this practice, or other associated exposures, may result in a higher fungal burden.
The association between occupational fungal exposure and outcomes was less evident. Most interviewed participants were not actively working; therefore, ongoing mould exposure at work was not an issue. However, participants reporting exposure to agricultural sources at work, or handling of plants as part of their occupation, either current of prior, had increased number of GP visits and antibiotics courses. It cannot be ascertained whether this is related specifically to ongoing fungal exposure in their daily routines following retirement, for example as hobbies.
Fungal exposure has been implicated in hospital-acquired cases of invasive aspergillosis, as well as in allergic bronchopulmonary aspergillosis via occupational exposure.27 However, CPA has not been linked with a particular mould exposure risk. This study showed an association between presence of CPA and residence in proximity of farms or agricultural areas. This could be due to a real predisposition to CPA or because clinics may have differing catchment areas. In the pathogenesis of CPA, factors other than specific fungal exposure are likely to be at least as important, such as genetic predisposition or unrecognised immune defects.20
This study has several limitations. Due to the COVID-19 pandemic, the recruitment method had to change during the study. Participants recruited via online questionnaire could have had milder disease compared to participants recruited in clinic. In addition, laboratory parameters were not available for the group recruited via online questionnaire. A larger proportion of females responded to the online questionnaire compared to those recruited in clinic. The COPD and COPD/CPA populations are dissimilar due to the different recruitment approaches, and therefore not directly comparable. Although the activities included in the questionnaire are perceived to lead to mould exposure, no measurement of domestic fungal load was performed to corroborate this. Therefore, self-reported mould exposure may not be an accurate surrogate for actual exposure. Finally, recall bias may have affected participants with more severe disease or with CPA.
ConclusionsWe show that certain self-reported domestic and outdoor exposures thought to be associated with mould were associated with worse outcomes in COPD. Mould exposure, actual or perceived, can be a major source of distress for individuals with chronic disease, and clarifying any association will inform efforts to prevent exacerbations in COPD. A survey of fungal burden in the homes of COPD patients in relation to outcomes will be needed to further investigate this.
We acknowledge recruitment support through Research for the Future, National Institute for Health Research [NIHR] Clinical Research Network Greater Manchester and Northern Care Alliance NHS Group. Chris Kosmidis, Jørgen Vestbo and Malcolm Richardson were supported by the NIHR Manchester Biomedical Research Centre.


