


The single breath nitrogen (SBN2) test was proposed for early detection of “small airways disease” in the seventies. Few longitudinal studies have subsequently evaluated the relationships between SBN2 test measurements and lung function decline or COPD incidence.
AimThis study evaluates whether SBN2 test abnormalities may be significant predictors of lung function decline and COPD incidence over an 8-year follow-up.
Study Design and MethodsIn this longitudinal study, 907 adults (20+ years old; 56% males) from the prospective Po River Delta epidemiological study underwent SBN2 test at baseline and spirometry testing at both baseline and follow-up 8-year apart. Multinomial and multiple regression models were used to assess associations of SBN2 indexes and rates of FEV1 decline or risk of COPD incidence over time, after adjusting for sex, height and baseline age, FEV1 and smoking status. COPD was defined according to either GOLD or ATS-ERS criteria.
ResultsAmong SBN2 indexes, only the slope of alveolar plateau (N2-slope) was significantly associated with rates of FEV1 decline (7.93 mL/year for a one-unit change in N2-slope, p<0.0001), and with an increased risk of developing COPD as defined by GOLD (RR 1.81, 95%CI 1.29-2.52, mild; RR 2.78, 95%CI 1.70-4.53, moderate or severe obstruction) and ATS-ERS criteria (RR 1.62, 95%CI 1.14-2.29, mild; RR 3.40, 95%CI 1.72-6.73, moderate or severe obstruction).
ConclusionIn this population-based study, N2-slope from SBN2 test is a significant predictor of lung function decline and COPD incidence over an 8-year follow-up, confirming the role of the “small airways disease” in the natural history of COPD.
Small airways disease (SAD) has long pathophysiologically linked to chronic obstructive pulmonary disease (COPD).1,2 In the seventies and eighties, early detection of SAD due to cigarette smoking was attempted by using single breath nitrogen (SBN2) test. Single breath nitrogen test abnormalities were shown to discriminate smokers from non-smokers in selected populations3 and symptomatic from asymptomatic subjects in general population samples.4 Conversely, other studies found abnormalities only in small proportions of those with a respiratory disorder not otherwise suspected or diagnosed;5 SBN2 test measurements were less sensitive than those from spirometry.6 Few longitudinal studies evaluated the relationships between SBN2 indexes and lung function decline. In US, an abnormal slope of phase 3 or alveolar plateau (N2-slope) failed to identify those with an accelerated forced expiratory volume in one second (FEV1) decline.7 In 50-60 year old men from a 7-year population-based Swedish study, an increased baseline N2-slope was associated with a higher FEV1 decline.8 A higher baseline closing capacity (CC) was associated with subsequent loss of FEV1 in adults followed-up for 4.7 years.9 In two different cohorts, CC/Total Lung Capacity ratio (CC/TLC) was significantly associated with FEV1 decline.10 Baseline N2-slope correlated with FEV1 and FEV1/Vital Capacity (VC) ratio at 13-year follow-up, in a group of 56 male smoking steelworkers.11
After 1980s, the prevailing opinion was that SBN2 test offered no or little advantage over monitoring individuals through spirometry. A renewed interest in SAD has occurred in the new millennium.12 Small airway pathological findings were related to COPD progression.13 Multiple breath washout test was shown to be abnormal after only 10 pack-years of smoking.14 N2-slope deterioration over 6 years was associated with exhaled nitric oxide measured in both smokers and non-smokers.15 Further studies were conducted in the last decade. Single breath nitrogen test was shown be useful in assessing the effects of inhaled medicines on small airways in asthma, by Scichilone et al.,16 and in COPD, by Pecchiari et al.17 Timmins et al.18 showed that the severities of COPD and airflow obstruction are independently predicted by the extent of both SAD and emphysema. Khurana et al.19 found that COPD patients with persistent sputum production had higher closing volume (CV). Boeck et al.20 demonstrated that N2-slope was increased in COPD patients compared with healthy subjects and associated with FEV1 predicted. Olofson et al. showed that the cumulative COPD event incidence rate over a 38-year follow-up increased with increasing of N2-slope,21 and it was shown to be higher among heavy smokers with the highest N2-slope and lowest FEV1.22
In this context, the availability of longitudinal data from a population-based study carried out in Italy in 1980-1991 prompted us to evaluate whether SBN2 test abnormalities are related to lung function decline and COPD incidence over an 8-year follow-up.
MethodsParticipantsData from the Po River Delta prospective study were analyzed. A baseline survey was carried out in 1980-82 on 3284 subjects, of whom 2136 (65%) were followed-up in 1988-91.23–27 This was a population-based study, which included subjects aged 8-64 yrs. Fig. 1 shows the selection of the study subjects, i.e., those aged ≥ 20 yrs, who participated at both baseline and follow-up survey, and had acceptable SBN2 test measures at baseline along with FEV1 measures at both baseline and follow-up.

The study protocol was approved by an Internal Revision Board within the Preventive Medicine Targeted Project of the Italian National Research Council.
MeasurementsIn both surveys, a computerized pneumotachograph (Fleish No. 3) (Pulmonary System 47804/S, Hewlett-Packard, Waltham, Massachusetts, USA) was used.27,28 The measurement protocol fulfilled the American Thoracic Society (ATS) recommendations in force at the time of the survey,29 except for the end-point criterion of the forced expirogram.30 Predicted values were computed according to reference equations derived within the baseline survey.23,28
Single breath nitrogen test was performed according to the method of Buist et al.31, by using a heated pneumotachograph (Fleisch No. 1) with an attached nitrogen analyzer (Hewlett Packard type 47302A).23 The pneumotachograph was daily calibrated through a 3 liters syringe. After a slow and complete expiration to residual volume (RV), the valve automatically started the delivery of 100% oxygen, the subject slowly inspired to TLC and then exhaled to RV, maintaining the flow between 0.3 and 0.5 L/s. A maximum of four trials were performed to obtain at least one acceptable tracing. The following indexes were obtained: N2-slope, CV, CC, CV/VC%, and CC/TLC%. The slope of alveolar plateau was expressed as percent increase of nitrogen concentration per liter of expired volume during phase 3. The first convincing departure from this straight line was detected by the computer algorithm to indicate the beginning of phase 4 and to calculate CV and CC.
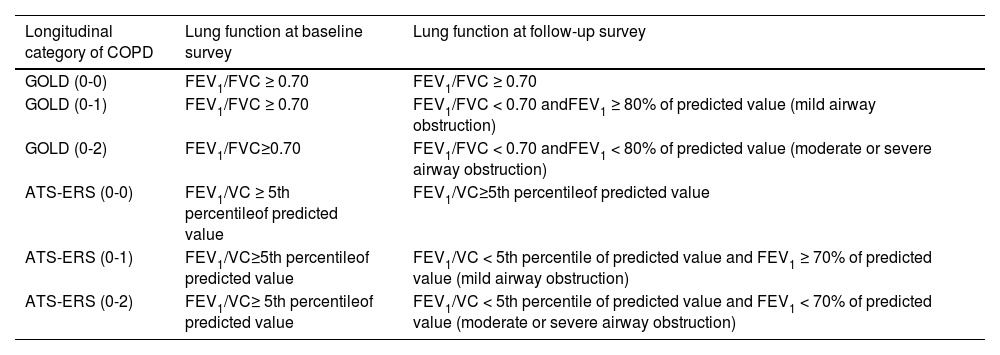
Statistical analysisChronic obstructive pulmonary disease was defined as presence of airway obstruction according to either Global Initiative for Chronic Obstructive Lung Disease (GOLD)32 or ATS-European Respiratory Society (ERS)33 criterion. Longitudinal categories of COPD were defined selecting those subjects who had no airway obstruction at baseline and no (0-0), mild (0-1) or moderate/severe (0-2) obstruction at follow-up (Appendix A).
The rate of change in FEV1 (ΔFEV1) for each subject was computed as the difference between follow-up and baseline measured (or percentage predicted) values divided by the duration of individual follow-up time in years (mL/year or %pred/year). Predicted values were computed according to Paoletti et al. 1986.28 Associations between ΔFEV1, as continuous dependent variable, and SBN2 indexes, as continuous independent variables, were assessed using multiple linear regressions. Each SBN2 index was fitted independently. Sex, height and baseline age, smoking status (current, ex, never), and FEV1 were included as potential confounders. Interaction terms between sex and SBN2 indexes were tested as indicators of gender differences. To verify the results of the multiple linear regression analyses, bootstrapping was applied as method of model validation.
The associations between baseline SBN2 test indexes and COPD incidence were assessed using multinomial regression models, both for GOLD and ATS-ERS criteria, by adjusting for sex, height and baseline age and smoking status. For each criterion, there were three COPD categories: GOLD (0-0), reference category; GOLD (0-1); GOLD (0-2); ATS-ERS (0-0), reference category; ATS-ERS (0-1); ATS-ERS (0-2). Descriptive statistics are reported as means and proportions; differences between those included and excluded from the analyses were tested using Student's t test for unpaired data and Chi-Square test, respectively. All statistical tests were made assuming a two tailed alternative and alpha = 0.05 significance level.
All statistical analyses were performed in Stata, version 17 (Stata Corporation, College Station, TX).
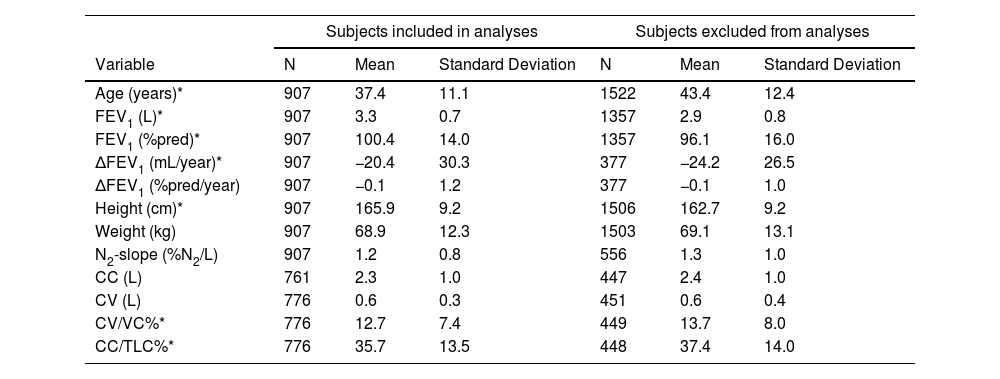
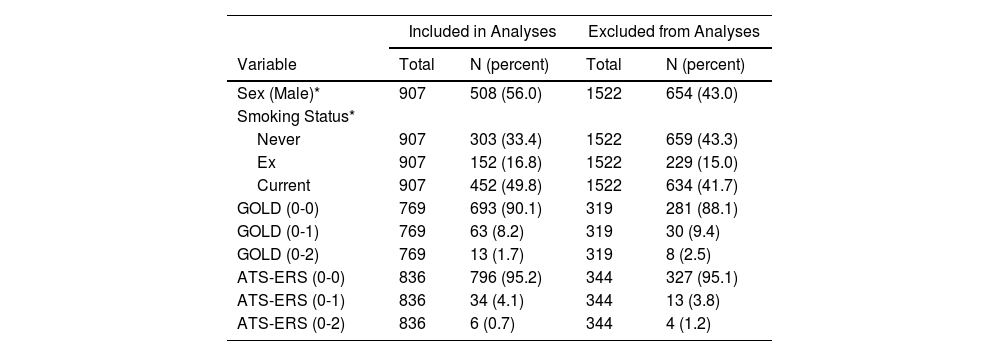
ResultsCharacteristics of the study subjectsDescriptive statistics for continuous demographic and lung function values are listed in Table 1 and frequencies for categorical variables are listed in Table 2, stratified by inclusion. There were 907 adult subjects aged ≥ 20 yrs who had acceptable SBN2 indexes at baseline and FEV1 measures at both baseline and follow-up, necessary for calculation of ΔFEV1 (Fig. 1). Of the 907 subjects who completed SBN2 test, CC was obtained in 761 subjects and CV in 776 subjects. Subjects included in the analyses were significantly younger, slightly taller, had better FEV1, and lower ΔFEV1 rates than those excluded. Included participants were on average 37.4 years old (age range 20-63 yrs), 56% males, and 49.8% current smokers at baseline. Among subjects without airway obstruction at baseline, approximately 10% developed COPD at follow-up according to GOLD (8% mild and 2% moderate or severe obstruction), while approximately 5% developed COPD according to ATS-ERS (4% mild and about 1% moderate or severe obstruction) (Table 2).
Descriptive statistics: means and standard deviations by inclusion.
| Subjects included in analyses | Subjects excluded from analyses | |||||
|---|---|---|---|---|---|---|
| Variable | N | Mean | Standard Deviation | N | Mean | Standard Deviation |
| Age (years)* | 907 | 37.4 | 11.1 | 1522 | 43.4 | 12.4 |
| FEV1 (L)* | 907 | 3.3 | 0.7 | 1357 | 2.9 | 0.8 |
| FEV1 (%pred)* | 907 | 100.4 | 14.0 | 1357 | 96.1 | 16.0 |
| ΔFEV1 (mL/year)* | 907 | −20.4 | 30.3 | 377 | −24.2 | 26.5 |
| ΔFEV1 (%pred/year) | 907 | −0.1 | 1.2 | 377 | −0.1 | 1.0 |
| Height (cm)* | 907 | 165.9 | 9.2 | 1506 | 162.7 | 9.2 |
| Weight (kg) | 907 | 68.9 | 12.3 | 1503 | 69.1 | 13.1 |
| N2-slope (%N2/L) | 907 | 1.2 | 0.8 | 556 | 1.3 | 1.0 |
| CC (L) | 761 | 2.3 | 1.0 | 447 | 2.4 | 1.0 |
| CV (L) | 776 | 0.6 | 0.3 | 451 | 0.6 | 0.4 |
| CV/VC%* | 776 | 12.7 | 7.4 | 449 | 13.7 | 8.0 |
| CC/TLC%* | 776 | 35.7 | 13.5 | 448 | 37.4 | 14.0 |
Data presented are from baseline survey except for ΔFEV1. FEV1 = forced expiratory volume in one second; ΔFEV1 = rate of change in FEV1, computed for each subject as difference between follow-up and baseline measured values divided by individual follow-up time in years; FEV1 (%pred) = FEV1 percentage predicted value; ΔFEV1 (%pred/year) = rate of change in FEV1 %pred, computed for each subject as difference between follow-up and baseline percentage predicted values divided by individual follow-up time in years; N2-slope = slope of the single breath nitrogen test phase 3 or alveolar plateau; CC = closing capacity; CV = closing volume; CV/VC% = closing volume to vital capacity ratio; CC/TLC% = closing capacity to total lung capacity ratio.
Descriptive statistics: proportions by inclusion.
| Included in Analyses | Excluded from Analyses | |||
|---|---|---|---|---|
| Variable | Total | N (percent) | Total | N (percent) |
| Sex (Male)* | 907 | 508 (56.0) | 1522 | 654 (43.0) |
| Smoking Status* | ||||
| Never | 907 | 303 (33.4) | 1522 | 659 (43.3) |
| Ex | 907 | 152 (16.8) | 1522 | 229 (15.0) |
| Current | 907 | 452 (49.8) | 1522 | 634 (41.7) |
| GOLD (0-0) | 769 | 693 (90.1) | 319 | 281 (88.1) |
| GOLD (0-1) | 769 | 63 (8.2) | 319 | 30 (9.4) |
| GOLD (0-2) | 769 | 13 (1.7) | 319 | 8 (2.5) |
| ATS-ERS (0-0) | 836 | 796 (95.2) | 344 | 327 (95.1) |
| ATS-ERS (0-1) | 836 | 34 (4.1) | 344 | 13 (3.8) |
| ATS-ERS (0-2) | 836 | 6 (0.7) | 344 | 4 (1.2) |
Longitudinal categories of Chronic Obstructive Pulmonary Diseases (COPD) according either to Global Initiative for Chronic Obstructive Lung Disease (GOLD) or American Thoracic Society-European Respiratory Society (ATS-ERS) criteria: (0-0) = no airway obstruction at both baseline and follow-up; (0-1) = no airway obstruction at baseline and mild airway obstruction at follow-up; (0-2) = no airway obstruction at baseline and moderate or severe airway obstruction at follow-up.
Out of 769 and 836 subjects without airway obstruction at baseline, according to GOLD and ATS-ERS criteria, there were 75 (9.7%) and 103 (12.3%) subjects, respectively, with abnormal N2-slope as defined according to Viegi et al. 1988.23
Single breath nitrogen test as predictor of lung function declineThere was no statistically significant correlation between ΔFEV1 and CC, CV, CV/VC%, or CC/TLC%, in models fitted independently, after adjusting for sex, height and baseline age, smoking status and FEV1.
Results of multiple regression model to predict the linear association between ΔFEV1 and N2-slope are listed in Table 3 and plotted in Figs. 2 and 3. There was a highly significant (p=0.0001) linear association between N2-slope and ΔFEV1: for a one unit change in N2-slope there was an extra 7.93 mL/year in ΔFEV1. Females had significantly lower ΔFEV1 than males. With ageing, ΔFEV1 became steeper by -1.14 mL/year. There was a significant effect of current smoking (-4.70 mL/year, p=0.041) when subjects of all ages were included. Bootstrap confirmed the validity of the applied model. Fig. 2 illustrates the fitted regression line and its 95% confidence interval. This regression model explained 16.3% of the variability observed in ΔFEV1. When only subjects over 30 years (n=612) were analyzed, a statistically significant difference (p=0.005) in ΔFEV1 of -7.4 mL/year was observed between current and never smokers (Fig. 3). In contrast, there was no detectable effect between never and ex-smokers (p=0.418) (Fig. 3).
Regression analysis with rate of change in FEV1 (ΔFEV1) as the dependent variable.
Regression analysis computed on n=907 subjects with ΔFEV1 and N2-slope data available. N2-slope = slope of the single breath nitrogen test phase 3 or alveolar plateau; FEV1 = forced expiratory volume in one second; ΔFEV1 = rate of change in FEV1, computed for each subject as difference between follow-up and baseline values divided by individual follow-up time in years. R2 = 16.3%.
 and smoking habits, in all study subjects. Solid curve = fitted regression line; dashed curves = 95% confidence interval. ΔFEV1 = rate of change in FEV1, computed for each subject as difference between follow-up and baseline values divided by individual follow-up time in years; N2-slope = slope of the single breath nitrogen test phase 3 or alveolar plateau.")
Linear regression model for rate of change in FEV1 according to N2-slope, adjusted for sex, height, baseline age, lung function (FEV1) and smoking habits, in all study subjects. Solid curve = fitted regression line; dashed curves = 95% confidence interval. ΔFEV1 = rate of change in FEV1, computed for each subject as difference between follow-up and baseline values divided by individual follow-up time in years; N2-slope = slope of the single breath nitrogen test phase 3 or alveolar plateau.
 and smoking habits, in subjects over 30 years of age by smoking status. Solid curve = never smokers; dashed curve = ex-smokers; dotted curve = current smokers. ΔFEV1 = rate of change in FEV1, computed for each subject as difference between follow-up and baseline values divided by individual follow-up time in years; N2-slope = slope of the single breath nitrogen test phase 3 or alveolar plateau.")
Linear regression model for rate of change in FEV1 according to N2-slope, adjusted for sex, height, baseline age, lung function (FEV1) and smoking habits, in subjects over 30 years of age by smoking status. Solid curve = never smokers; dashed curve = ex-smokers; dotted curve = current smokers. ΔFEV1 = rate of change in FEV1, computed for each subject as difference between follow-up and baseline values divided by individual follow-up time in years; N2-slope = slope of the single breath nitrogen test phase 3 or alveolar plateau.
There were no statistically significant increased risks detected between CC, CV, CV/VC%, or CC/TLC% and changes in COPD classification, using either GOLD or ATS-ERS criteria.
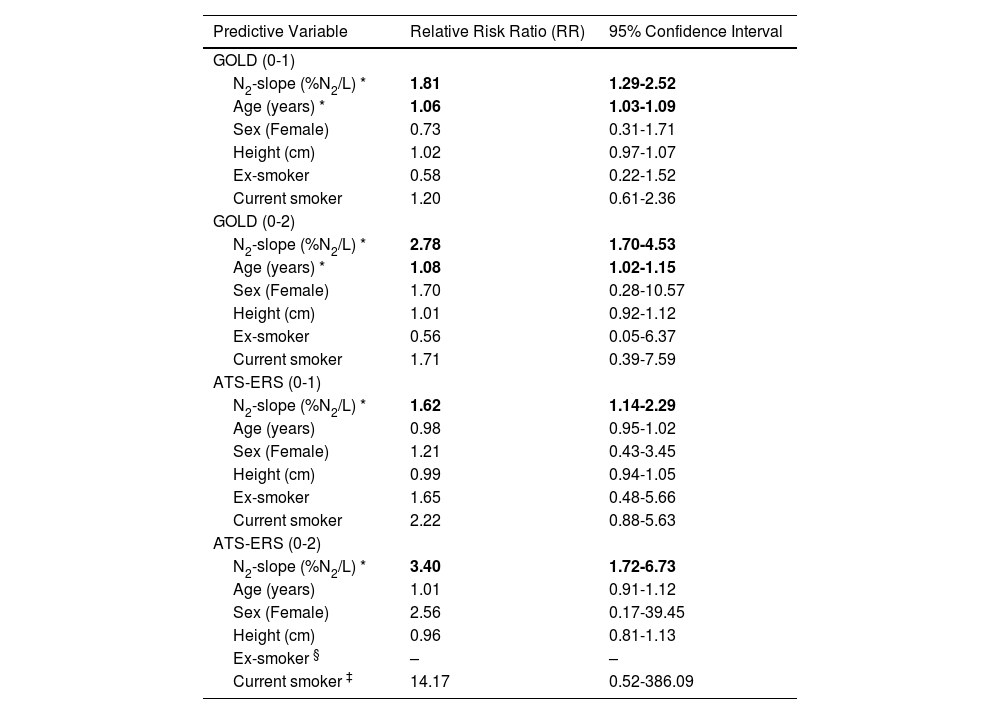
The results of fitting the multinomial regression models using N2-slope to predict incidence of COPD at follow-up, after adjusting for sex, height and baseline ageand smoking status, are listed in Tables 4, for GOLD and ATS-ERS criteria. The slope of alveolar plateau was associated with an increased risk of developing COPD over the 8-year follow-up, for both criteria. A one unit change in N2-slope was associated with a 81% increased risk (Relative Ratio (RR)=1.81) of developing COPD GOLD stage I and with a 178% increased risk (RR=2.78) of developing COPD GOLD stage II or higher. Age was associated with an increased risk for GOLD (0-1) (RR=1.06) and GOLD (0-2) (RR=1.08), indicating a 6 and 8% increased risk for each year, respectively. Sex and current or former smoking were not significant determinants for both GOLD (0-1) and GOLD (0-2). When using the ATS-ERS criterion, the N2-slope was associated with a 62% increased risk (RR=1.62) of developing ATS-ERS mild airway obstruction and with a 240% increased risk (RR=3.40) of developing ATS-ERS moderate or severe airway obstruction. In this case, age was not significant for ATS-ERS (0-1) nor for ATS-ERS (0-2). As in the GOLD model, sex was not statistically significant for both COPD categories, likewise neither former nor current smoking were statistically significant; in particular, for ex-smoking status there was insufficient number of subjects to estimate the risk for ATS-ERS (0-2). However, smoking status was left in the models because of its known link to COPD.
Results from fitting multinomial regression model predicting changes in airway obstruction based on GOLD and ATS-ERS criteria, with subjects classified as without airway obstruction at both baseline and follow-up as reference group.
| Predictive Variable | Relative Risk Ratio (RR) | 95% Confidence Interval |
|---|---|---|
| GOLD (0-1) | ||
| N2-slope (%N2/L) * | 1.81 | 1.29-2.52 |
| Age (years) * | 1.06 | 1.03-1.09 |
| Sex (Female) | 0.73 | 0.31-1.71 |
| Height (cm) | 1.02 | 0.97-1.07 |
| Ex-smoker | 0.58 | 0.22-1.52 |
| Current smoker | 1.20 | 0.61-2.36 |
| GOLD (0-2) | ||
| N2-slope (%N2/L) * | 2.78 | 1.70-4.53 |
| Age (years) * | 1.08 | 1.02-1.15 |
| Sex (Female) | 1.70 | 0.28-10.57 |
| Height (cm) | 1.01 | 0.92-1.12 |
| Ex-smoker | 0.56 | 0.05-6.37 |
| Current smoker | 1.71 | 0.39-7.59 |
| ATS-ERS (0-1) | ||
| N2-slope (%N2/L) * | 1.62 | 1.14-2.29 |
| Age (years) | 0.98 | 0.95-1.02 |
| Sex (Female) | 1.21 | 0.43-3.45 |
| Height (cm) | 0.99 | 0.94-1.05 |
| Ex-smoker | 1.65 | 0.48-5.66 |
| Current smoker | 2.22 | 0.88-5.63 |
| ATS-ERS (0-2) | ||
| N2-slope (%N2/L) * | 3.40 | 1.72-6.73 |
| Age (years) | 1.01 | 0.91-1.12 |
| Sex (Female) | 2.56 | 0.17-39.45 |
| Height (cm) | 0.96 | 0.81-1.13 |
| Ex-smoker § | – | – |
| Current smoker ‡ | 14.17 | 0.52-386.09 |
Longitudinal categories of Chronic Obstructive Pulmonary Diseases (COPD) according to Global Initiative for Chronic Obstructive Lung Disease (GOLD) and American Thoracic Society-European Respiratory Society (ATS-ERS) criteria: (0-1) = no airway obstruction at baseline and mild airway obstruction at follow-up; (0-2) = no airway obstruction at baseline and moderate or severe airway obstruction at follow-up; N2-slope = slope of the single breath nitrogen test phase 3 or alveolar plateau.
We have prospectively evaluated the association between impairment of small airways and lung function decline or incidence of COPD in a large longitudinal population-based study over 8-year follow-up. We observed that baseline N2-slope from SBN2 test is significantly associated with FEV1 decline and increased risk of incident airway obstruction as defined by GOLD or ATS-ERS criteria.
Our study is comparable to only few other similar studies conducted in the 1970-80s. Over a similar follow-up period, by using the SBN2 test technique in 460 men aged 50 and 60 years randomly sampled from the general population, Olofsson et al.8 found that 1 and 4% N2/L of baseline N2-slope produced a decline in FEV1 of 56 and 82 mL/year, respectively. Beaty et al.9 observed a significant negative relationship between baseline CC and ΔFEV1 in women, and between baseline CC or N2-slope and ΔFEV1 in men. Such study on 1912 adults had a shorter follow-up (average of 4.7 years between visits) and used a different SBN2 technique. By using our same SBN2 technique, Buist et al.10 analyzed data from two different cohorts, tested 3-5 times over a mean follow-up of 8.5 and 10.5 years. In both cohorts, ΔFEV1 rate was significantly associated with CV/VC (r = -0.16 in the Portland and -0.7 in the Screening center cohort) and with CC/TLC (r = -0.33 and -0.15), but not with N2-slope (r = -0.10 and -0.03). In a preliminary report on 389 subjects from the Tucson Epidemiological Study, Knudson et al.7 did not find an abnormal N2-slope to be a predictor of an accelerated ΔFEV1 after 4.2 years of follow-up. None of the above longitudinal studies evaluated SBN2 test indexes as predictors of incident airway obstruction or COPD. Stanescu et al. followed-up an original group of 105 male, long-term smoking, 45-55 years old steelworkers, after 6 (n=85)34 and 13 (n=56) years.11 Baseline N2-slope was significantly related to FEV1 decline over 6 years only in obstructed subjects with a baseline FEV1/VC < 66.6% (r = 0.59, p < 0.01),34 for whom baseline N2-slope was significantly related to FEV1 also at 13-year follow-up (r2 = 55%), but not to change in FEV1 over 13 years.11 No other SBN2 index was found related to FEV1 decline. Moreover, N2-slope was related to FEV1/VC (r = 0.61, p < 0.001) at baseline but not to change in FEV1/VC over 13-year follow-up.11 They concluded that middle-aged smokers are at no evident risk of functional deterioration if their FEV1/VC ratio is normal, even if results of small airways tests are abnormal.11 More recently, using data from a cohort surveyed in 1970s and followed-up for 38 years, Olofson et al. observed that N2-slope predicted the cumulative COPD event incidence (i.e. first hospital admission or death for COPD)21 and combining the N2-slope with FEV1 measurements and smoking history improved the prediction of future COPD events.22
Overall, previous longitudinal studies have observed links between impairment in small airways as detected by SBN2 test and subsequent loss in lung function. In our study, N2-slope appeared to predict lung function decline or airway obstruction. Our result is consistent with those from some previous longitudinal studies,8,21,22 but not with others.7,9–11 N2-slope reflects the distribution of ventilation in lung periphery while CV and CC denote the lung volume at which peripheral airway closure begins, and all these indexes may provide an indication of processes associated with parenchymal or small airways dysfunction.2 Different sampling procedures, SBN2 test techniques35,36 or statistical approaches of the quoted studies may account for the different findings with our study, along with a younger mean age of our population.
In our study there were 1228/3284 (37.4%) longitudinal subjects who had acceptable baseline SBN2 test and ΔFEV1 measures. Among these subjects only adults aged ≥ 20 yrs were selected (n=907), as lung function decline and incidence of COPD over a 8-year follow-up is not expected in subjects aged under 20 yrs. While all our subjects who completed the SBN2 test provided a measure of the N2-slope, only 83.9% and 85.5% provided a measure of CC and CV, respectively. This may be at least in part explained by the difficulty in performing SBN2 test maneuver among participants in this epidemiological survey.23 Subjects included in the analyses were significantly younger, slightly taller, and had better FEV1 with respect to those excluded. The regression analyses to estimate the risk for lung function decline associated with baseline SBN2 test indexes accounted for these confounders. A significant lower difference was found for ΔFEV1 between subjects included and excluded from analyses, which may be explained by the smaller number and the younger mean age of those providing acceptable spirometry measurements at both surveys 8-year apart. We observed that baseline N2-slope was associated with higher risks of lung function decline and airways obstruction incidence in a relatively young population; this result reinforces the importance of SAD in the natural history of COPD, as even higher risks may be expected in an older population possibly exposed to smoking for a longer period.
N2-slope has been repeatedly found to be the most sensitive SBN2 index in separating smokers from non-smokers,3,22,37 as we previously found.23 In the present longitudinal study, an association between N2-slope and decline in FEV1 was found adjusting for smoking habit, while current or former smoking were not significant determinants for incident airway obstruction. A shorter and lighter history of smoking in current young smokers and the inclusion of occasional among current smokers may explain these effects. Indeed, when only subjects aged over 30 years were analyzed, a statistically significant difference in ΔFEV1 of -7.4 mL/year was observed between current and never smokers, with no detectable difference between never and ex-smokers. The association between N2-slope and decline in FEV1 observed in this young study sample (mean age 37.4±11.1 years) from the general population highlights the relevance of the impairment of small airways in predicting lung function decline even independently from smoking.
Considering the scientific discussion on the spirometry definition of COPD (i.e., FEV1/FVC < 70% fixed ratio vs. FEV1/VC < 5th percentile of the predicted value),38 we evaluated SBN2 test as predictor of COPD incidence defined according to either GOLD32 or ATS-ERS33 criterion. We found N2-slope to be a significant predictor of COPD with both criteria. Among subjects without airway obstruction at baseline, approximately 10% vs. 5% developed COPD based on GOLD or ATS-ERS criteria, respectively. This difference may confirm that the use of a non-age-adjusted criterion to define airway obstruction may misclassify the older subjects as obstructed. Indeed, differently from the GOLD model with N2-slope predicting COPD incidence, in the ATS-ERS model age did not reach the statistical significance. This is consistent with the age-adjustment inherent in the ATS-ERS criterion.
We performed baseline spirometry without using bronchodilator, as at the time of our study there was no suggestion to perform a bronchodilator test when carrying out spirometry in general population samples. A Norwegian group, using a bronchodilator test in a community study, estimated post-bronchodilator airway obstruction prevalence (defined as FEV1/FVC < 0.70) to be 27% lower than the pre-bronchodilator values.39 However, the need of using a therapeutic agent in general population studies is still questionable, in view of the widespread lack of awareness of the disease in the general public who, in real life, is unlikely to seek medical advice at the early stage of the disease.40
Our study reinforces the usefulness of the SBN2 test in the early detection of airways obstruction. The reported difficulty in performing SBN2 test in population-based studies may not apply to the clinical setting. Indeed, high reproducibility for N2-slope has been shown in different populations of healthy subjects (correlation coefficient for duplicate measurements: r = 0.9635 or r = 0.9441). Other functional or biological tests for exploring small airways obstruction, possibly more patient friendly or easy to apply in clinical practice, are available: e.g., the impulse oscillometry (IOS) or exhaled nitric oxide measurements. Impulse oscillometry parameters have been shown to be reproducible in three measures in healthy children and children with cystic fibrosis (intraclass correlation coefficient = 0.9).42 Fractional exhaled nitric oxide (FeNO) measurements have been shown to be reproducible in healthy and asthmatic adults, as well as in children (intraclass correlation coefficient = 0.99).43 While no study has directly compared IOS with the SBN2 test, strong correlations have been found between the alveolar nitric oxide concentration (CAlv) and N2-slope in patients with severe asthma.44 The IOS parameter integrated area of low frequency X has been shown to predict the FEV1 decline in a group of COPD patients.45 There are no prospective data on the association between impairment of small airways, as assessed by IOS, and incidence of COPD. Alveolar nitric oxide concentration has been used to study the small airways in COPD, in addition to asthma,46 but longitudinal studies are lacking.
Thus, SBN2 test might be part of an extended evaluation of respiratory function, in addition to spirometry, in patients with clinically significant risk factors for COPD, e.g., tobacco smoking. Indeed, in the last years, the relevance of targeting treatment to small airways in asthma and COPD has been pointed out,47 and SBN2 test might be used to detect respiratory patients with functionally impaired small airways. In the clinical practice, highlighting abnormal results of the SBN2 test might also be used to motivate smoking patients to quit; indeed, it is known that diagnosis of airway obstruction motivates smokers to quit smoking48 and higher cessation rates are observed in those who are obstructed.49
ConclusionN2-slope from SBN2 test is a significant predictor of lung function decline and COPD incidence defined according to either GOLD or ATS-ERS criteria. These results confirm the role of SAD in the natural history of COPD. Large prospective studies are needed to evaluate whether new proposed functional or imaging tests that measure small airways impairment may be useful in the early detection of COPD. Meanwhile, pulmonologists could re-discover an “old” test, which provide important information on their patients at risk for developing COPD.
Funding informationThis work was supported in part by: the National Research Council, Targeted Project "Prevention and Control Disease Factors - SP2 - Contract N 91.00171.PF41", the Italian Electric Power Authority (ENEL) - CNR Project "Interactions of energy system with human health and environment", Rome, Italy.
The authors wish to thank all the persons who concurred to plan and conduct the Epidemiological Study of Po River Delta in 1980-82 and/or 1988-91: L. Ballerin, P. Biavati, T. Sapigni† (University of Ferrara); G. Baiocchi, E. Cestari, G. Nardini, R. Polato, M. Saetta, R. Zambon (University of Padova); E. Diviggiano, P. Fazzi, C. Giuntini†, P. Modena, P. Paoletti, M. Pedreschi, G. Pistelli†, D. Talini, M. Vellutini (University of Pisa).
FEV1 = forced expiratory volume in one second; FVC = forced vital capacity; VC = vital capacity. Predicted values were computed according to Paoletti et al.28


