Previous studies have found associations between polymorphisms in some candidate genes and chronic obstructive pulmonary disease (COPD) risk. However, the association between TLR2 and TLR9 polymorphisms and COPD risk remains uncertain.
MethodsFour variants (rs352140, rs3804099, rs3804100, and rs5743705) of the TLR2 and TLR9 genes in 540 COPD patients and 507 healthy controls were genotyped using the Agena MassARRAY system. Odds ratio (OR) and 95% confidence interval (CI) were calculated to assess the association of TLR2 and TLR9 polymorphisms with COPD risk by logistic regression analysis.
ResultsTLR9-rs352140, TLR2-rs3804100, and TLR2-rs5743705 were related to a lower risk of COPD among Chinese people and the significance still existed after Bonferroni correction. Additionally, rs3804099, rs3804100, and rs352140 were found to be associated with COPD development in different subgroups (males, age ≤ 68 years, smokers, BMI < 24 kg/m2, and acute exacerbation).
ConclusionsOur findings indicated that TLR9 and TLR2 polymorphisms had protective effects on the development of COPD among Chinese people.
Chronic obstructive pulmonary disease (COPD) is chronic bronchitis and/or emphysema characterized by airflow obstruction, eventually leading to chronic respiratory failure. It has been reported that the prevalence of COPD in adults over 40 years old worldwide ranges from 5% to 10%.1 Furthermore, COPD is currently the third leading cause of death globally.2 In 2015, the overall incidence of COPD in China was 13.6%, and men were more significantly affected than women.3 In addition, COPD poses enormous challenges to health care systems worldwide because of its high prevalence, morbidity, and mortality.4 Therefore, it is necessary to explore the pathogenesis and etiology of COPD.
To the best of our knowledge, cigarette smoking, air pollution, and biomass fuels are important causative factors for COPD development.5-7 Moreover, genome-wide association studies (GWAS) have shown that single-nucleotide polymorphisms (SNPs) are significantly associated with COPD susceptibility and are involved in multiple aspects of COPD pathogenesis.8,9 Deng et al. have found that SERPINA1-rs8004738 could augment the risk of COPD in Chinese people.10 A meta-analysis conducted by Zhang et al. also indicated that the TNF-α-308 G/A polymorphism increases the susceptibility to COPD among Asians.11 Taken together, these results suggest an important role of SNPs of some candidate genes in the development of COPD.
Toll-like receptor 2 (TLR2) and Toll-like receptor 9 (TLR9) belong to the Toll-like receptor (TLR) family which plays an essential role in chronic respiratory diseases.12-14 A previous study has revealed that TLR4 participates in the pathogenesis of asthma and COPD.15TLR5 could inhibit COPD exacerbation by mediating lung immune stimulation.16 Moreover, there is increasing evidence indicating that TLR2 is elevated in patients with COPD, asthma, and bronchiectasis.17,18 Besides, TLR9 deletion improves smoke-induced loss of lung function and inflammation in mice, and TLR9 is required for emphysema development.19 Meanwhile, Nadigel et al. have recognized that TLR9 is abnormally expressed in lung CD8+ T cells in patients with COPD.20 These findings demonstrate the critical roles of TLR2 and TLR9 in COPD and other chronic respiratory diseases.
Therefore, we conducted a case-control study of 1047 subjects and investigated the correlation of TLR2 and TLR9 gene polymorphisms with COPD risk to further elucidate their roles in COPD development.
Materials and methodsStudy populationIn the present study, we used G*power software (version 3.1.9.7) to calculate the minimum required sample size based on the probability of a type I error of alpha = 5%, and type II error of beta = 15% (power = 85%). This calculation generated a sample of at least 450 cases and 450 controls. Accordingly, this study recruited 540 COPD patients and 507 healthy controls, which was larger than the sample size required for G*power software. All participants were recruited from Hainan General Hospital. Patients were assessed by pulmonary function examination according to the Global Initiative for Chronic Obstructive Lung Disease.21 Individuals with forced expiratory volume in 1 second (FEV1) / forced vital capacity (FVC) < 70% and predicted FEV1 < 80% after inhaling bronchodilators were included in this study. Patients with lung cancer, bronchitis, pulmonary fibrosis, tuberculosis, asthma, and other respiratory diseases were excluded. The healthy controls came from the physical examination center of the same hospital. Healthy subjects who had no lung dysfunction, no lung-related disease, no other chronic diseases and disorders, and no history of cancers were included in the control group. The schematic representation of work-flow is shown in Fig. 1.
This study was approved by the hospital ethics committee. And all experimental procedures followed the Declaration of Helsinki. At the same time, informed consent was obtained from each participant.
Selection and genotyping of SNPsThree variants (rs3804099, rs3804100, and rs5743705) in TLR2 and one variant (rs352140) in TLR9 were selected from the dbSNP database. All SNPs had minor allele frequencies (MAFs) larger than 1% in the 1000 Genomes Project. Total DNA was isolated from whole blood using the DNA extraction kit (GoldMag Co., Ltd., Xi'an, China). DNA concentration was measured by NanoDrop 2000 spectrophotometer (ND2000; Thermo Scientific, Waltham, MA, USA). Genotyping of TLR2 and TLR9 polymorphisms was performed using the Agena MassARRAY analyzer 4 (Agena Bioscience, San Diego, CA, USA). The primers of four SNPs are presented in Supplementary Table 1.
Data analysisStudent's t-test and Pearson's χ2 test were applied to analyze the distribution of continuous variables (age and BMI) and categorical variables (sex and smoking) in the two groups, respectively. The Hardy-Weinberg equilibrium (HWE) for the control group was detected by the χ2 test. Logistic regression analysis was performed to estimate the correlation between TLR2 and TLR9 variants and COPD susceptibility. P < 0.05 represented statistical significance. Bonferroni correction was used to correct for multiple testing.
ResultsBasic information about subjects and candidate SNPsThe characteristics of the study population (including 540 COPD patients and 507 healthy controls) are summarized in Table 1. The average ages of COPD patients and controls were 70.65 ± 10.22 years and 66.08 ± 5.22 years, respectively. In addition, the distributions of age (p < 0.001) and BMI (p < 0.001) were significantly different between COPD patients and healthy controls. However, there was no significant difference in sex (p = 0.979) and smoking (p = 0.622) distributions between the two groups.
Characteristics of COPD patients and healthy controls.
COPD: chronic obstructive pulmonary disease.
pa and pb values were calculated by t-test and χ2 test, respectively.
Table 2 displays the main information about candidate SNPs in TLR9 and TLR2 genes. We found that these four SNPs (rs352140, rs3804099, rs3804100, and rs5743705) were synonymous variants and met HWE (p > 0.05). According to the prediction from the HaploReg database (https://pubs.broadinstitute.org/mammals/haploreg/haploreg.php), rs352140, rs3804099, rs3804100, and rs5743705 were associated with the regulation of promoter histone marks, enhancer histone marks, GRASP QTL hits, selected eQTL hits, SiPhycons, and motif changes.
Basic information about TLR9 and TLR2 polymorphisms.
SNP: single nucleotide polymorphism; MAF: minor allele frequency; HWE: Hardy-Weinberg equilibrium.
p values were calculated by χ2 test.
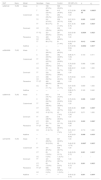
Table 3 exhibits the association of TLR9 and TLR2 polymorphisms with COPD risk. TLR9-rs352140 was found to be associated with a decreased risk of COPD in the allele (OR = 0.70, 95% CI = 0.58-0.83, p = 6.70E-05), homozygote (OR = 0.51, 95% CI = 0.34-0.75, p = 0.001), heterozygote (OR = 0.67, 95% CI = 0.51-0.88, p = 0.005), dominant (OR = 0.63, 95% CI = 0.48-0.81, p = 0.0004), recessive (OR = 0.63, 95% CI = 0.43-0.90, p = 0.012), and additive (OR = 0.70, 95% CI = 0.58-0.84, p = 0.0002) models. Meanwhile, TLR2-rs3804100 and TLR2-rs5743705 were also related to a reduced risk of COPD in the allele (rs3804100: OR = 0.76, 95% CI = 0.63-0.93, p = 0.006; rs5743705: OR = 0.49, 95% CI = 0.32-0.74, p = 0.0007), heterozygote (rs3804100: OR = 0.65, 95% CI = 0.49-0.84, p = 0.001; rs5743705: OR = 0.46, 95% CI = 0.29-0.72, p = 0.001), dominant (rs3804100: OR = 0.66, 95% CI = 0.52-0.86, p = 0.002; rs5743705: OR = 0.47, 95% CI = 0.30-0.73, p = 0.001), and additive (rs3804100: OR = 0.76, 95% CI = 0.63-0.93, p = 0.008; rs5743705: OR = 0.49, 95% CI = 0.32-0.75, p = 0.001) models. Moreover, all of these genetic models of TLR9-rs352140, TLR2-rs3804100, and TLR2-rs5743705 remained statistically significant even after Bonferroni correction (pc < 0.05).
Logistic regression analysis of associations between TLR9 and TLR2 polymorphisms and COPD risk.
SNP: single nucleotide polymorphism; OR: odds ratio; CI: confidence interval.
p values were calculated by logistic regression analysis adjusted by age, sex, and smoking.
pc values were calculated after Bonferroni correction.
Bold values indicate statistical significance (p < 0.05) and * indicates significance after Bonferroni correction.
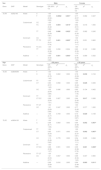
Next, we performed stratified analysis based on age, sex, smoking, BMI, and disease stage. According to sex-stratified analysis (Table 4), TLR9-rs352140 decreased the susceptibility to COPD in males in the allele (OR = 0.65, 95% CI = 0.52-0.82, p = 0.0002), homozygote (OR = 0.48, 95% CI = 0.29-0.81, p = 0.006), heterozygote (OR = 0.59, 95% CI = 0.42-0.84, p = 0.004), dominant (OR = 0.57, 95% CI = 0.41-0.79, p = 0.001), and additive (OR = 0.66, 95% CI = 0.52-0.84, p = 0.001) models, and the significance existed after Bonferroni correction.
Age- and sex-stratified analysis of the association between TLR9 and TLR2 polymorphisms and COPD risk.
SNP: single nucleotide polymorphism; OR: odds ratio; CI: confidence interval.
pa values were calculated by logistic regression analysis adjusted by age and smoking.
pb values were calculated by logistic regression analysis adjusted by age, sex, and smoking.
pc values were calculated after Bonferroni correction.
Bold values indicate statistical significance (p < 0.05) and * indicates significance after Bonferroni correction.
In age-stratified analysis (Table 4), we found that TLR2-rs3804099 reduced the likelihood of developing COPD in individuals younger than 68 years in the allele (OR = 0.76, 95% CI = 0.59-0.99, p = 0.039), heterozygote (OR = 0.65, 95% CI = 0.44-0.95, p = 0.028), dominant (OR = 0.64, 95% CI = 0.45-0.93, p = 0.017), and additive (OR = 0.73, 95% CI = 0.56-0.97, p = 0.029) models. However, the significance was lost after Bonferroni correction (pc > 0.05). Likewise, rs3804100 was also correlated with a lower risk of COPD in the allele (OR = 0.64, 95% CI = 0.48-0.85, p = 0.002), heterozygote (OR = 0.55, 95% CI = 0.37-0.81, p = 0.002), dominant (OR = 0.55, 95% CI = 0.38-0.79, p = 0.001), and additive (OR = 0.64, 95% CI = 0.48-0.86, p = 0.003) models, and the association remained significant after Bonferroni correction (pc < 0.05).
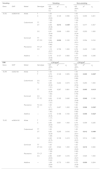
In Table 5, the CT (OR = 0.59, 95% CI = 0.38-0.90, p = 0.015) and CT-CC (OR = 0.64, 95% CI = 0.43-0.96, p = 0.030) genotypes of rs3804100 decreased the occurrence of COPD among smokers, but there was no significant difference when Bonferroni correction was performed (pc > 0.05). When stratified by BMI (Table 5), rs352140 decreased the susceptibility to COPD in individuals with BMI < 24 kg/m2 under the allele (OR = 0.68, 95% CI = 0.53-0.89, p = 0.005), homozygote (OR = 0.44, 95% CI = 0.25-0.76, p = 0.003), dominant (OR = 0.68, 95% CI = 0.46-1.00, p = 0.049), recessive (OR = 0.50, 95% CI = 0.30-0.82, p = 0.006), and additive (OR = 0.69, 95% CI = 0.53-0.90, p = 0.006) models. However, after Bonferroni correction (pc < 0.05), the significance persisted under all genetic models except the dominant model. Meanwhile, the CT genotype (OR = 0.61, 95% CI = 0.41-0.90, p = 0.012) of rs3804100 was found to be correlated with a lower risk of COPD and its association remained significant when Bonferroni correction was conducted (pc < 0.05). Rs3804100 under the dominant model (OR = 0.63, 95% CI = 0.43-0.92, p = 0.016) significantly decreased the risk of COPD, and the significance was lost after Bonferroni correction (pc < 0.05).
Correlation between TLR9 and TLR2 polymorphisms and COPD risk stratified by smoking and BMI.
SNP: single nucleotide polymorphism; OR: odds ratio; CI: confidence interval.
pa values were calculated by logistic regression analysis adjusted by age and smoking.
pb values were calculated by logistic regression analysis adjusted by age, sex, and smoking.
pc values were calculated after Bonferroni correction.
Bold values indicate statistical significance (p < 0.05) and * indicates significance after Bonferroni correction.
When stratified by disease stage (Table 6), the C allele of TLR2-rs3804100 was associated with an increased risk of COPD in patients with acute exacerbation of COPD compared with the T allele (OR = 1.36, 95% CI = 1.02-1.81, p = 0.037). However, TLR2-rs3804100 failed to retain its significance after Bonferroni correction (pc < 0.05).
Relationship between disease stage and TLR2 rs3804100 in COPD patients.
SNP: single nucleotide polymorphism; OR: odds ratio; CI: confidence interval.
p values were calculated by logistic regression analysis adjusted by age, sex, and smoking.
pc values were calculated after Bonferroni correction.
Bold values indicate statistical significance (p < 0.05).
Numerous studies have illustrated that TLR2 and TLR9 genes participate in the development and progression of COPD.18,20 At the same time, we found TLR9-rs352140, TLR2-rs3804100, and TLR2-rs5743705 had protective effects on the development of COPD among Chinese people and the significance remained after Bonferroni correction. Additionally, rs352140, rs3804100, and rs3804099 were correlated with COPD susceptibility in different subgroups. Our results further confirmed the importance of TLR2 and TLR9 genes in COPD development. Furthermore, the study of these polymorphisms of TLR2 and TLR9 may provide new insights into the prevention and treatment of COPD.
The TLR2 gene is located on human chromosome 4q31.3 and has been reported to be involved in COPD development.22 Some research has reported that several SNPs of TLR2 could influence the occurrence of chronic respiratory diseases, including COPD.23,24 A meta-analysis has also discovered that TLR2-rs4696480 is related to an increased risk of asthma and is a risk factor for asthma.25 Rs1898830 and rs11938228 of TLR2 have been proved to participate in FEV1 decline.24 In our study, the correlation of rs3804099, rs3804100, and rs5743705 with COPD susceptibility was investigated among the Chinese population. We found that these three SNPs reduced the risk of COPD in the overall group and different subgroups. Rs3804099 decreased the susceptibility to COPD in individuals aged ≤ 68 years, while it increased the risk of asthma in a mixed-ancestry cohort.26 In addition, some studies have demonstrated that rs3804100 is correlated with an increased risk and severity of tuberculosis,27,28 which is inconsistent with our results. The reasons for this contradiction are likely due to the heterogeneity of the disease and racial differences. In a word, these data underscore the vital role of TLR2 polymorphisms in COPD development.
The TLR9 gene is found on chromosome 3p21.2 and plays a crucial role in the pathogenesis of COPD.19,20 The TLR9-rs187084 polymorphism is associated with diminished FEV1% predicted and affects the progression of COPD among the European population.29 In addition, rs352140 of TLR9 has been reported to be correlated with many diseases, including bacterial meningitis,30 tuberculosis,31 malaria,32 and inflammatory bowel disease.33 Nevertheless, rs352140 has not been studied in COPD. As far as we know, this research is the first to investigate the association between rs352140 and COPD risk and suggests that rs352140 has a protective effect on COPD development.
Synonymous mutations can interrupt the formation of correct mRNA secondary structures, reduce the accuracy and speed of translation, and even alter the start of transcription.34 Moreover, some research has demonstrated that synonymous mutations could alter disease susceptibility by affecting the expression of mRNA and protein of candidate genes.35,36 Therefore, we speculated that synonymous mutations (rs352140, rs3804099, rs3804100, and rs5743705) could alter disease susceptibility by influencing the expression of TLR2 and TLR9. We will perform functional experiments to verify our hypothesis in follow-up studies.
Admittedly, there are some limitations in our study. Firstly, only one SNP in TLR9 and three SNPs in TLR2 were analyzed, and more polymorphisms of these two genes should be investigated. Secondly, all subjects were Han Chinese from the same hospital, so selection bias was inevitable. Thirdly, the molecular mechanism by which TLR2 and TLR9 polymorphisms affect COPD susceptibility remains unclear, which should be further explored in subsequent studies.
ConclusionsTo sum up, we are the first to reveal that TLR9 and TLR2 polymorphisms have protective effects on the development of COPD among Chinese people. The investigation into these synonymous mutations may shed new light on the prevention and treatment of COPD.
StatementEthics approval and consent to participateThe study was approved by the Ethics Committee of Hainan General Hospital and we obtained written informed consent from all individual participants.
Availability of data and materialsThe datasets used and/or analyzed during the current study are available from the corresponding author on reasonable request.
FundingThis paper was supported by the National Natural Science Foundation of China (No. 81860015 and No. 82160011), and National Key Research and Development Program of China (2018YFC2002304).
Consent for publicationNot applicable.
Authors’ contributionsXD and QL completed genotyping and wrote the manuscript. JZ, YF, and YZ participated in data management, statistical analysis and manuscript revision. RM, LZ, BZ, and JC collected samples. TX, HW, and YD designed the study, co-supervised the work, and modified the manuscript. All authors have approved the final manuscript.
We thank the individuals who participated in this study.


