Home noninvasive ventilation (NIV) has been increasingly used in stable chronic obstructive pulmonary disease (COPD) with chronic hypercapnic respiratory failure (CHRF). However its effectiveness remains debatable.
AimTo describe a follow-up of COPD patients under home NIV.
MethodsRetrospective descriptive study based on a prospective 3-year database that included COPD patients under home NIV between August 2011 and July 2014.
ResultsWithin the 334 patients initially screened, 109 (32.6%) had COPD with a mean±SD post-bronchodilator FEV1 of 38.6±14.9% predicted; age of 65.6±9.6 years.
The mean±SD duration of ventilation was 63.4±51.1 months. Heterogeneous comorbidities that can contribute to CHRF were not excluded: obstructive sleep apnea and obesity were the most prevalent.
Sixty-two (56.9%) patients started NIV during admission with acute respiratory failure.
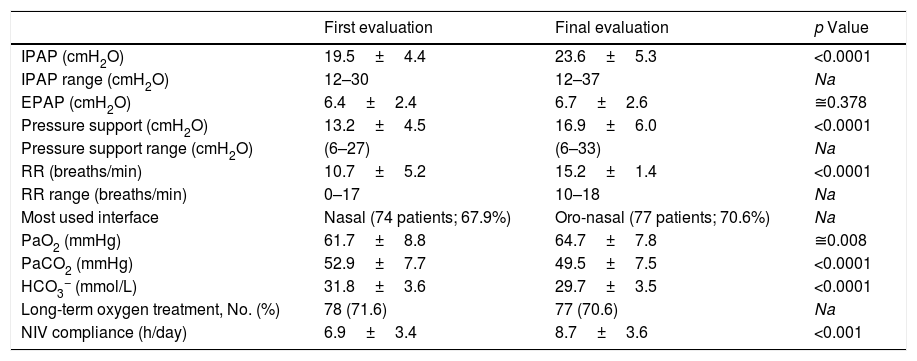
During follow-up there was a significant increase in mean inspiratory positive airway pressure (IPAP) and respiratory rate (19.5±4.4 vs. 23.6±5.3cmH2O and 10.7±5.2 vs. 15.2±1.4 breaths/min, respectively, p<0.0001), with a significant improvement in hypercapnia (PaCO2: 52.9±7.7 vs. 49.5±7.5mmHg, p<0.0001), with 93.3% of patients compliant to NIV.
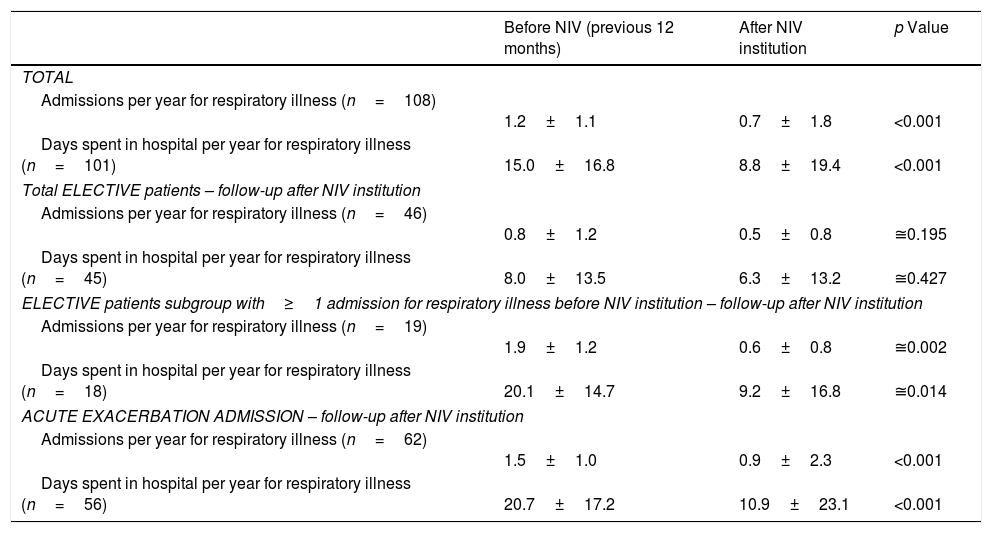
Admissions and days spent in hospital for respiratory illness significantly decreased after institution of NIV (respectively, 1.2±1.1 vs. 0.7±1.8 and 15.0±16.8 vs. 8.8±19.4, p<0.001).
At final evaluation, patients with severe hypercapnia (n=47; PaCO2 ≥50mmHg) performing NIV at higher pressures (n=30; IPAP ≥25cmH2O) were more compliant (10.1±3.3 vs. 6.1±3.6h/day). Three-year mortality was 24.8% (27 of 109 patients).
ConclusionsThis is a real-life retrospective study in COPD patients with CHRF which results suggest benefit from home NIV. For most, NIV was effective and tolerable even at high pressures.
Home noninvasive ventilation (NIV) has been increasingly used in patients with chronic hypercapnic respiratory failure (CHRF) arising from stable chronic obstructive pulmonary disease (COPD). However its effectiveness remains debatable.
According to national1 and international recommendations2 for home-based ventilation, NIV has been used in stable COPD patients for at least two decades in Portugal.
In the 1999 Consensus Conference Report about the clinical indications for NIV in CHRF, the authors concluded that the conflicting results in stable COPD patients made virtually impossible the clear definition of evidence based guidelines for this group of patients.2 However it was also noted that NIV seemed to particularly benefit a subgroup of COPD patients with a more severe hypercapnia and that the unfavorable results could relate not only to the selection of less hypercapnic patients but also to the use of lower positive airway pressures.2
Since 2002, Windish and colleagues developed extensive research to test the hypothesis that the effectiveness of NIV in COPD patients with chronic and severe hypercapnia was directly correlated with the intensity of ventilation3 and concluded that high-intensity NIV (i.e. ventilation with a protocol requiring a substantial reduction in CO2, achieved with a combination of increasing inspiratory positive airway pressures and back-up respiratory rates) could improve alveolar ventilation and, consequently, blood gases during spontaneous breathing, as well as lung function and hematocrit, with a positive repercussion on the exacerbation rate and long-term survival.4 However in 2009, those authors strongly emphasized the need for more randomized controlled trials (RCTs) that would evaluate the use of NIV in stable hypercapnic COPD patients.4
According to GOLD guidelines5 RCTs have yielded conflicting data on the impact of home NIV on survival and re-hospitalization of chronic hypercapnic COPD patients.6–9 Several factors may account for these discrepancies: differences in patient selection and poorly characterized patient populations, underpowered studies, NIV settings incapable of achieving adequate ventilation and poor adherence to this therapy.5
The last pan-European survey aimed at assessing the patterns of home mechanical ventilation (HMV) use in patients with chronic respiratory failure was completed in 2001–2002.10 At the time, the survey showed a wide variation in practice with an estimated prevalence of 6.6 HMV users per 100,000 inhabitants (range: from 0.6 in Greece to 17 in France) and also a wide variation in the clinical conditions treated with HMV, since Denmark had proportionately more individuals with neuromuscular disease whereas in Italy and Portugal COPD patients predominated.11 In 2004, a retrospective study performed at our center also demonstrated that COPD was the most frequent disorder causing CHRF under home ventilation.12
NIV has had a high success rate in the treatment of acute exacerbations, but the use of this therapy in COPD patients with CHRF has not been supported with same level of evidence.5 Although long-term dependency on NIV is not an uncommon situation after resolution of an acute hypercapnic respiratory failure episode13–15 trials addressing the weaning of NIV after acute hypercapnic respiratory failure are still scarce13–16 and even the GOLD report5 does not provide clear guidelines regarding the hospital discharge of a patient that required NIV during an exacerbation.
Our aim was to analyze some of the practical aspects of the follow-up of COPD patients with CHRF under home NIV.
Material and methodsPatients under home NIV, according to the regularly revisited clinical guidelines1,2,17 were standardly followed since 1998, at the noninvasive respiratory care unit of a university hospital with an intermediate respiratory and an intensive care unit and a sleep study laboratory (Hospital Pulido Valente, Faculdade de Medicina da Universidade de Lisboa).
Initially instituted on an inpatient regimen, since 2008 the implementation and follow-up of NIV were predominantly performed on an outpatient basis, as supported by several studies18,19 and further specified in Appendix A.
This is a retrospective descriptive study based on a prospective systematic 3-year database that included for analysis COPD patients under home NIV followed at our unit between August 2011 and July 2014. Patients were eligible for inclusion if they had COPD as primary diagnosis and two or more evaluations during the period of analysis. All patients received optimized COPD pharmacological and non-pharmacological treatment (oxygen therapy included) according to the national COPD guidelines. Pulmonary rehabilitation was proposed to all patients and performed in those who accepted to participate. Smoking cessation intervention was instituted in all current smokers.
Patients were excluded if they (1) were not assessed in a minimum period of six months, or (2) had a previous diagnosis of obstructive sleep apnea (OSA) without compliance to continuous positive airway pressure (CPAP).
Compliance to NIV and CPAP was defined as mean use >4h/day.
The protocol was approved by the Research Ethics Committee of Centro Hospitalar Lisboa Norte (number 261/16).
The IBM SPSS Statistics software was the main data analysis tool used in this study. Descriptive statistics were performed for the basic analysis of data. The Student's/Welch's t-test or Mann–Whitney rank sum test was used to compare parametric or nonparametric data, respectively, of two independent samples of continuous variables. A paired Student's t-test or a Wilcoxon signed rank test was used to compare parametric or nonparametric data, respectively, of two paired groups of continuous variables. The null hypothesis of normal distribution of the continuous variables was tested using the one-sample (exact) Kolmogorov–Smirnov test. The Levene's test was also applied automatically to test the equality/inequality of the variances of two populations.
To compare two groups of discrete variables Chi-square test was used.
For all the statistical tests, a p value <0.05 was set as the lower threshold of significance.20
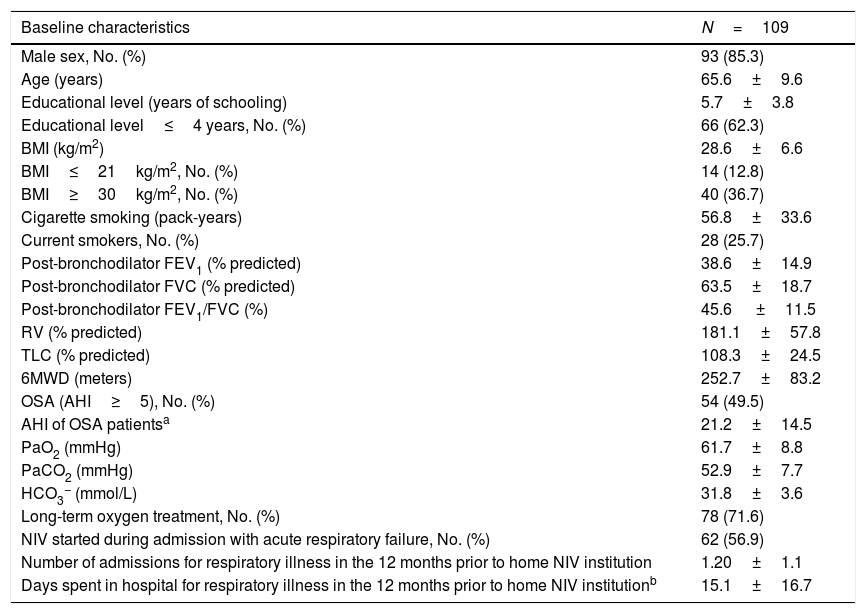
ResultsWithin the 334 patients registered in the 3-year systematic database, 109 (32.6%) were eligible (Fig. 1). Eighty-four patients had been followed before August 2011 and the remaining 25 were enrolled between August 2011 and July 2014 (Appendix B). The baseline characteristics of the COPD patients are shown in Table 1.
Demographic, anthropometric, lung function and clinical characteristics of COPD patients.
| Baseline characteristics | N=109 |
|---|---|
| Male sex, No. (%) | 93 (85.3) |
| Age (years) | 65.6±9.6 |
| Educational level (years of schooling) | 5.7±3.8 |
| Educational level≤4 years, No. (%) | 66 (62.3) |
| BMI (kg/m2) | 28.6±6.6 |
| BMI≤21kg/m2, No. (%) | 14 (12.8) |
| BMI≥30kg/m2, No. (%) | 40 (36.7) |
| Cigarette smoking (pack-years) | 56.8±33.6 |
| Current smokers, No. (%) | 28 (25.7) |
| Post-bronchodilator FEV1 (% predicted) | 38.6±14.9 |
| Post-bronchodilator FVC (% predicted) | 63.5±18.7 |
| Post-bronchodilator FEV1/FVC (%) | 45.6 ±11.5 |
| RV (% predicted) | 181.1±57.8 |
| TLC (% predicted) | 108.3±24.5 |
| 6MWD (meters) | 252.7±83.2 |
| OSA (AHI≥5), No. (%) | 54 (49.5) |
| AHI of OSA patientsa | 21.2±14.5 |
| PaO2 (mmHg) | 61.7±8.8 |
| PaCO2 (mmHg) | 52.9±7.7 |
| HCO3− (mmol/L) | 31.8±3.6 |
| Long-term oxygen treatment, No. (%) | 78 (71.6) |
| NIV started during admission with acute respiratory failure, No. (%) | 62 (56.9) |
| Number of admissions for respiratory illness in the 12 months prior to home NIV institution | 1.20±1.1 |
| Days spent in hospital for respiratory illness in the 12 months prior to home NIV institutionb | 15.1±16.7 |
Continuous variables are presented as mean±SD.
n=102.
BMI, body mass index; FEV1, forced expiratory volume in 1s; FVC, forced vital capacity; RV: residual volume; TLC: total lung capacity; 6MWD, 6min walking distance; OSA, obstructive sleep apnea; AHI, apnea-hypopnea index; PaO2: oxygen arterial partial pressure; PaCO2, carbon dioxide arterial partial pressure; HCO3− arterial bicarbonate concentration; NIV, noninvasive ventilation.
Before starting NIV, 28 (25.7%) COPD patients were active smokers, 74 (67.9%) ex-smokers and 7 (6.4%) non-smokers. However, during follow-up 14 (12.8%) patients stopped smoking (smoke cessation confirmed by biological markers requiring expired air CO levels <10ppm and/or arterial COHb levels <1.6%).
Coexistence of disorders that can contribute to CHRF in COPD patients was also analyzed. Most (81.7%) had one or more respiratory or non-respiratory comorbidity. OSA was found in 54 (49.5%) patients, obesity in 40 (36.7%), heart failure in 25 (22.9%), bronchiectasis in 24 (22.0%), other post-tuberculosis sequelae in 9 (8.3%), lung cancer in 8 (7.3%) and heterogeneous respiratory and non-respiratory diseases in 7 (6.4%). Regarding the sleep study results performed in 80 patients, 31.3% had an apnea-hypopnea index (AHI) ≥5<15; 22.5% ≥15<30 and 13.8% ≥30events/h.
There was significant improvement in mean arterial blood gas (ABG) between first stable and final evaluations (Table 2), with 93.3% of the patients compliant to NIV at final evaluation. The duration of ventilation was 63.4±51.1 months.
NIV parameters, arterial blood gas and compliance to NIV of the COPD patients, at baseline and final evaluation at the noninvasive respiratory care unit of Hospital Pulido Valente.
| First evaluation | Final evaluation | p Value | |
|---|---|---|---|
| IPAP (cmH2O) | 19.5±4.4 | 23.6±5.3 | <0.0001 |
| IPAP range (cmH2O) | 12–30 | 12–37 | Na |
| EPAP (cmH2O) | 6.4±2.4 | 6.7±2.6 | ≅0.378 |
| Pressure support (cmH2O) | 13.2±4.5 | 16.9±6.0 | <0.0001 |
| Pressure support range (cmH2O) | (6–27) | (6–33) | Na |
| RR (breaths/min) | 10.7±5.2 | 15.2±1.4 | <0.0001 |
| RR range (breaths/min) | 0–17 | 10–18 | Na |
| Most used interface | Nasal (74 patients; 67.9%) | Oro-nasal (77 patients; 70.6%) | Na |
| PaO2 (mmHg) | 61.7±8.8 | 64.7±7.8 | ≅0.008 |
| PaCO2 (mmHg) | 52.9±7.7 | 49.5±7.5 | <0.0001 |
| HCO3− (mmol/L) | 31.8±3.6 | 29.7±3.5 | <0.0001 |
| Long-term oxygen treatment, No. (%) | 78 (71.6) | 77 (70.6) | Na |
| NIV compliance (h/day) | 6.9±3.4 | 8.7±3.6 | <0.001 |
Continuous variables are presented as mean±SD. Na, not applicable; IPAP, inspiratory positive airway pressure; EPAP, expiratory positive airway pressure; RR, respiratory rate; PaO2, oxygen arterial partial pressure; PaCO2, carbon dioxide arterial partial pressure, HCO3−, arterial bicarbonate concentration; NIV, noninvasive ventilation.
Significant increases in mean inspiratory positive airway pressure (IPAP) and backup respiratory rate were carried out between baseline and final evaluation (Table 2). At first evaluation 19 patients (17.4%) were under assisted (spontaneous) ventilation, predominantly using nasal masks (74 patients: 67.9%) and at final evaluation all were under assisted/controlled, or with volume-assured pressure support ventilation (9 patients: 8.3%), predominantly using oro-nasal masks (77 patients: 70.6%) (according to Appendix A).
At final evaluation, patients with severe hypercapnia (n=47; PaCO2≥50mmHg) performing NIV at high pressures (n=30; IPAP≥25cmH2O) were more compliant (mean daily use: 10.1±3.3 vs. 6.1±3.6h/day) than those under lower airway pressures (Table 3). In the subgroup of patients treated with higher airway pressures (IPAP≥25cmH2O), there was an average compliance 1.7h/day greater with a confidence level of 95%.
COPD patient compliance to NIV at final evaluation according to final carbon dioxide arterial partial pressure (PaCO2) and inspiratory positive airway pressure (IPAP) levels.
| NIV compliance (mean±SD number of hours per day) | |||
|---|---|---|---|
| PaCO2≥50mmHg | PaCO2<50mmHg | Total | |
| IPAP≥25cmH2O | 10.1±3.3 (n=30) | 10.6±4.9 (n=16) | 10.3±3.9 (n=46) |
| IPAP<25cmH2O | 6.1±3.6 (n=17) | 8.0±2.2 (n=46) | 7.5±2.8 (n=63) |
| Total | 8.7±3.9 (n=47) | 8.7±3.3 (n=62) | 8.7±3.6 (n=109) |
| p Value | < 0.0001 | ≅0.057 | <0.0001 |
At first evaluation, most (n=78; 71.6%) COPD patients were under long-term oxygen therapy (LTOT), 12 (11.0%) were under ambulatory oxygen therapy (AOT) and adjuvant oxygen therapy during NIV, and 2 (1.8%) under adjuvant oxygen therapy during NIV (17 patients without additional oxygen therapy: PaO2 62.5±7.2mmHg, at rest). At final evaluation, 77 (70.6%) were under LTOT, 9 (8.3%) under AOT and adjuvant oxygen therapy during NIV and 4 (3.7%) under adjuvant oxygen therapy during NIV (18 patients without additional oxygen therapy; PaO2 68.3±8.8mmHg, at rest; with home NIV compliance: 7.7±5.1h/per day). At first evaluation 47 (43.1%) patients performed ABG under oxygen therapy and at final evaluation 58 (53.2%).
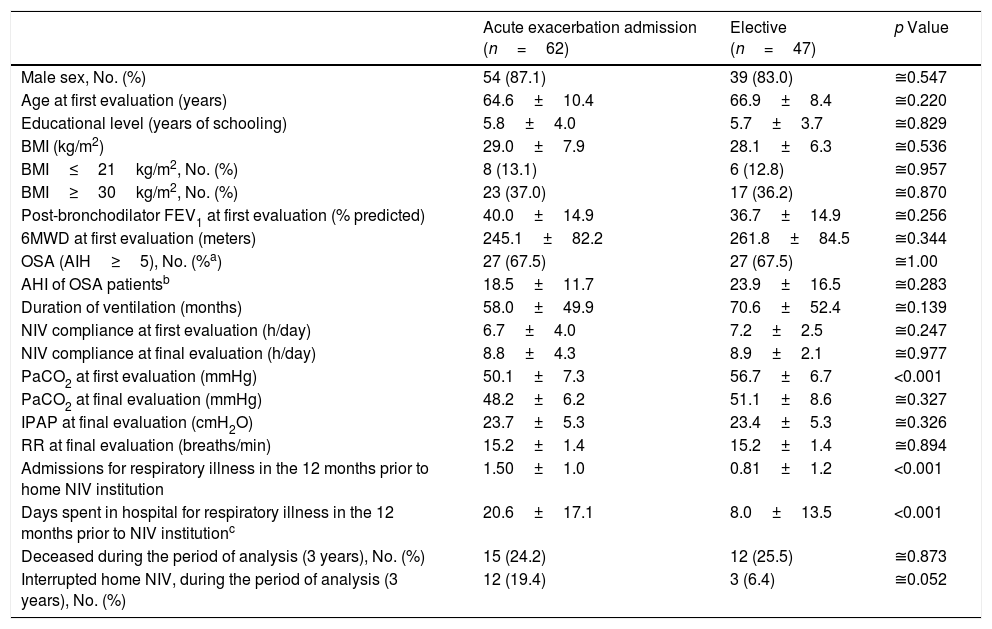
Sixty-two (56.9%) COPD patients started NIV during admission with acute respiratory failure while 47 (43.1%) started electively, 26 (55.3%) of whom had previously been treated with CPAP but maintained significant hypercapnia despite treatment adherence. Table 4 compares groups according to the starting site of NIV. No significant group differences were noted regarding age, BMI, coexistence of OSA, lung function – FEV1, duration of ventilation, adherence to NIV, IPAP and PaCO2 at final evaluation. Patients that started NIV during an acute exacerbation had a lower PaCO2 at first ambulatory evaluation (p<0.001) and a higher occurrence of admissions for respiratory illness (p<0.001) with more days of hospitalization in the year prior to NIV institution (p<0.001) compared to those starting electively.
Characteristics of the COPD patients according to the NIV starting site. Continuous variables are presented as mean±SD.
| Acute exacerbation admission (n=62) | Elective (n=47) | p Value | |
|---|---|---|---|
| Male sex, No. (%) | 54 (87.1) | 39 (83.0) | ≅0.547 |
| Age at first evaluation (years) | 64.6±10.4 | 66.9±8.4 | ≅0.220 |
| Educational level (years of schooling) | 5.8±4.0 | 5.7±3.7 | ≅0.829 |
| BMI (kg/m2) | 29.0±7.9 | 28.1±6.3 | ≅0.536 |
| BMI≤21kg/m2, No. (%) | 8 (13.1) | 6 (12.8) | ≅0.957 |
| BMI≥30kg/m2, No. (%) | 23 (37.0) | 17 (36.2) | ≅0.870 |
| Post-bronchodilator FEV1 at first evaluation (% predicted) | 40.0±14.9 | 36.7±14.9 | ≅0.256 |
| 6MWD at first evaluation (meters) | 245.1±82.2 | 261.8±84.5 | ≅0.344 |
| OSA (AIH≥5), No. (%a) | 27 (67.5) | 27 (67.5) | ≅1.00 |
| AHI of OSA patientsb | 18.5±11.7 | 23.9±16.5 | ≅0.283 |
| Duration of ventilation (months) | 58.0±49.9 | 70.6±52.4 | ≅0.139 |
| NIV compliance at first evaluation (h/day) | 6.7±4.0 | 7.2±2.5 | ≅0.247 |
| NIV compliance at final evaluation (h/day) | 8.8±4.3 | 8.9±2.1 | ≅0.977 |
| PaCO2 at first evaluation (mmHg) | 50.1±7.3 | 56.7±6.7 | <0.001 |
| PaCO2 at final evaluation (mmHg) | 48.2±6.2 | 51.1±8.6 | ≅0.327 |
| IPAP at final evaluation (cmH2O) | 23.7±5.3 | 23.4±5.3 | ≅0.326 |
| RR at final evaluation (breaths/min) | 15.2±1.4 | 15.2±1.4 | ≅0.894 |
| Admissions for respiratory illness in the 12 months prior to home NIV institution | 1.50±1.0 | 0.81±1.2 | <0.001 |
| Days spent in hospital for respiratory illness in the 12 months prior to NIV institutionc | 20.6±17.1 | 8.0±13.5 | <0.001 |
| Deceased during the period of analysis (3 years), No. (%) | 15 (24.2) | 12 (25.5) | ≅0.873 |
| Interrupted home NIV, during the period of analysis (3 years), No. (%) | 12 (19.4) | 3 (6.4) | ≅0.052 |
After NIV institution, number of admissions for respiratory illness and days spent in hospital significantly declined. However, in the elective group, this significant effect was only felt in patients with hospitalizations in the year prior to NIV institution (19 patients) (Table 5).
Number of admissions and days spent in hospital for respiratory illness in the years before and after NIV institution according to condition (elective vs. exacerbation).
| Before NIV (previous 12 months) | After NIV institution | p Value | |
|---|---|---|---|
| TOTAL | |||
| Admissions per year for respiratory illness (n=108) | 1.2±1.1 | 0.7±1.8 | <0.001 |
| Days spent in hospital per year for respiratory illness (n=101) | 15.0±16.8 | 8.8±19.4 | <0.001 |
| Total ELECTIVE patients – follow-up after NIV institution | |||
| Admissions per year for respiratory illness (n=46) | 0.8±1.2 | 0.5±0.8 | ≅0.195 |
| Days spent in hospital per year for respiratory illness (n=45) | 8.0±13.5 | 6.3±13.2 | ≅0.427 |
| ELECTIVE patients subgroup with≥1 admission for respiratory illness before NIV institution – follow-up after NIV institution | |||
| Admissions per year for respiratory illness (n=19) | 1.9±1.2 | 0.6±0.8 | ≅0.002 |
| Days spent in hospital per year for respiratory illness (n=18) | 20.1±14.7 | 9.2±16.8 | ≅0.014 |
| ACUTE EXACERBATION ADMISSION – follow-up after NIV institution | |||
| Admissions per year for respiratory illness (n=62) | 1.5±1.0 | 0.9±2.3 | <0.001 |
| Days spent in hospital per year for respiratory illness (n=56) | 20.7±17.2 | 10.9±23.1 | <0.001 |
Data are presented as mean±SD. NIV, noninvasive ventilation.
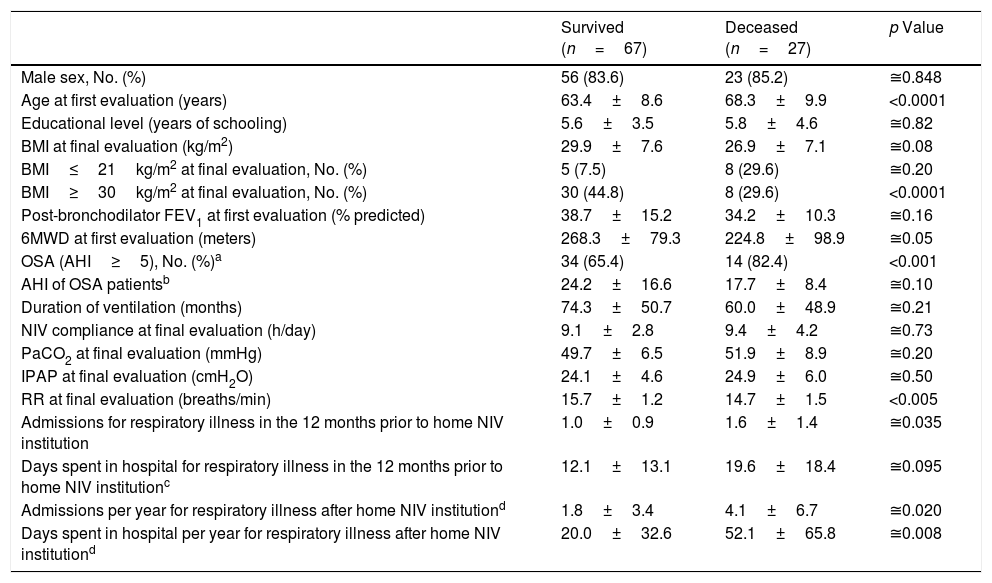
During the period under analysis 27 (24.8%) patients died and 15 (13.8%) interrupted NIV due to noncompliance (n=4) or loss of home NIV criteria (n=11) (as highlighted in Appendix A). Table 6 compares the characteristics of survived and deceased patients who maintained treatment with home NIV (n=94).
COPD patients’ characteristics according to clinical evolution (patients that interrupted NIV were excluded).
| Survived (n=67) | Deceased (n=27) | p Value | |
|---|---|---|---|
| Male sex, No. (%) | 56 (83.6) | 23 (85.2) | ≅0.848 |
| Age at first evaluation (years) | 63.4±8.6 | 68.3±9.9 | <0.0001 |
| Educational level (years of schooling) | 5.6±3.5 | 5.8±4.6 | ≅0.82 |
| BMI at final evaluation (kg/m2) | 29.9±7.6 | 26.9±7.1 | ≅0.08 |
| BMI≤21kg/m2 at final evaluation, No. (%) | 5 (7.5) | 8 (29.6) | ≅0.20 |
| BMI≥30kg/m2 at final evaluation, No. (%) | 30 (44.8) | 8 (29.6) | <0.0001 |
| Post-bronchodilator FEV1 at first evaluation (% predicted) | 38.7±15.2 | 34.2±10.3 | ≅0.16 |
| 6MWD at first evaluation (meters) | 268.3±79.3 | 224.8±98.9 | ≅0.05 |
| OSA (AHI≥5), No. (%)a | 34 (65.4) | 14 (82.4) | <0.001 |
| AHI of OSA patientsb | 24.2±16.6 | 17.7±8.4 | ≅0.10 |
| Duration of ventilation (months) | 74.3±50.7 | 60.0±48.9 | ≅0.21 |
| NIV compliance at final evaluation (h/day) | 9.1±2.8 | 9.4±4.2 | ≅0.73 |
| PaCO2 at final evaluation (mmHg) | 49.7±6.5 | 51.9±8.9 | ≅0.20 |
| IPAP at final evaluation (cmH2O) | 24.1±4.6 | 24.9±6.0 | ≅0.50 |
| RR at final evaluation (breaths/min) | 15.7±1.2 | 14.7±1.5 | <0.005 |
| Admissions for respiratory illness in the 12 months prior to home NIV institution | 1.0±0.9 | 1.6±1.4 | ≅0.035 |
| Days spent in hospital for respiratory illness in the 12 months prior to home NIV institutionc | 12.1±13.1 | 19.6±18.4 | ≅0.095 |
| Admissions per year for respiratory illness after home NIV institutiond | 1.8±3.4 | 4.1±6.7 | ≅0.020 |
| Days spent in hospital per year for respiratory illness after home NIV institutiond | 20.0±32.6 | 52.1±65.8 | ≅0.008 |
Continuous variables are presented as mean±SD.
Cause of death (27 patients) was identified in 19 patients (70.4%): 12 died due to non-malignant respiratory disease (exacerbation of chronic respiratory failure due to pulmonary infection); two with lung neoplasm; two with non-respiratory malignancy (bowel); one due to acute myocardial infarction; and two with other diseases (complicated femur neck fracture and chronic kidney disease). Eight patients had an unknown cause of death (no access to death certificate). Most died in hospital (17 patients: 63.0%) while 10 died at home.
DiscussionThis is a retrospective descriptive study representative of the daily clinical practice in a respiratory care unit of a university hospital. Most (81.7%) COPD patients had one or more respiratory or non-respiratory comorbidity that not only contributed to the severity of the chronic respiratory failure but also informed great clinical heterogeneity within these patients.
The high prevalence of OSA (49.5%) could be explained by the fact that this study was carried out in a unit with a sleep-study laboratory, creating a possible selection bias, since studies about the prevalence of OSA in COPD patients showed lower prevalences.21–23 However this matter is still under debate,24 especially since there are only a few studies in severe COPD.25 It is noteworthy that only overlap syndrome patients with previous adherence to CPAP and maintenance of NIV criteria were included in this study, so COPD was considered the main cause of CHRF.
Despite the attempt to wean NIV, long-term dependency on NIV after acute hypercapnic respiratory failure is a common situation in intermediate respiratory care units13 explaining why more than half (56.9%) of the COPD patients in this study started NIV during admission with acute respiratory failure. In this subset of patients the loss of criteria for home NIV17 would determine treatment interruption in 11 patients (17.7%), similar to what has previously been described for oxygen therapy instituted during exacerbation.26,27 In the absence of clear guidelines regarding hospital discharge of a patient that required NIV during exacerbation, this study emphasizes the importance of future guidelines supporting NIV weaning after an acute exacerbation episode.
The 3-year analysis of home NIV showed an increasing prevalence of patients under this therapy. Similar to the clinical distribution profile reported a decade ago,12 COPD was the most frequent disorder under home NIV at our unit, but with a nearly triplicated prevalence.
Despite functional severity (mean FEV1 38.6±14.9% predicted) about one quarter (25.7%) of the patients were still smokers when they started NIV, which has also been described in other studies,28,29 and even suffering from CHRF, only half quit smoking during the follow-up period.
In this study there was a very good compliance to NIV, contrary to what has been described by some authors.30 These results were even more significant in the subgroup of patients treated with higher airway pressures (IPAP≥25cmH2O), who presented an average compliance 1.7h/day greater with a confidence level of 95%. This has also been observed in a 6-week crossover RCT31 that compared high-intensity NIV with low-intensity NIV.
Interface strategies differ in the acute and chronic setting. Considering that nasal masks generally appear to be better tolerated in the long term,32 in the initial evaluation there was a predominance of these masks (67.9%). However, during follow-up, stepwise titration with higher inspiratory pressures and detection of unintended leakage (clinically detected and/or by NIV software33) with repercussions on ventilation efficacy, conditioned the switch to oro-nasal masks in the majority of the patients (70.6% with oro-nasal masks at final evaluation).
During follow-up NIV parameters were adjusted with significant increases in IPAP and respiratory rate. Initially 17.4% of the patients were under assisted (spontaneous) ventilation and at final evaluation all were under assisted-controlled, with a minority under volume-assured pressure support (8.3%). Whether more sophisticated ventilators or modes provide better outcomes is unclear,24 although the favorable results of the most recent RCTs7,15 were achieved using a standard bilevel device.
In recent years, COPD has been the subject of discussion regarding the most appropriate ventilation strategies, with particular focus on the use of adequate IPAP and back-up respiratory rate.34 Only recently, high-intensity NIV demonstrated survival benefits in a RCT7 that demonstrated a 1-year mortality of 12%, much lower than that expected for similar populations.35
Mortality over the 3-year analysis period was 24.8% and the overall follow-up period after institution of NIV was 5.3±4.3 years. Although there was no control group in this retrospective study, these results suggest an improvement in survival compared to that described by other authors.35 Admissions and number of days spent in hospital for respiratory illness significantly decreased after NIV institution for patients with ≥1 admission per year in the year prior to home NIV institution, as already pointed out in other trials.15,30
Although the methodology is open to criticism, the analysis of the different variables that could interfere in mortality revealed that younger age (at the beginning of home NIV) and lower number of hospitalizations pre and post NIV institution were significantly associated with a lower mortality. Also body mass index (BMI) ≥30kg/m2 and the absence of OSA were associated to a significantly greater survival. As expected36 mean FEV1 at first evaluation, 6min walking distance (6MWD) and BMI were lower in the group of deceased patients compared to survivors. However these differences were not statistically significant. The small number of patients in the created subgroups may have contributed to these findings. Most patients died in hospital due to exacerbation of chronic respiratory failure. Despite the small sample limitations, this has also been described in COPD patients under LTOT.37
It would be expected that all patients were under LTOT, considering its demonstrated benefits in COPD patients.38,39 However, 15.6% (n=17) of the patients at first evaluation, and 16.5% (n=18) at final evaluation, were not under oxygen therapy, according to clinical guidelines,27,40 which has also been reported in patients with COPD and CHRF with home NIV criteria.7
This study did not aim to evaluate cost-effectiveness of NIV follow-up. However it should be noted that regular follow-up seemed to have contributed not only to compliance in a low educational level population but also to adequate NIV suspension corresponding to an estimated annual saving of 20,531 euros.41
Our study has a number of limitations. First, although the database allows for systematized analysis of patients in a follow-up period over three years, most were already followed at our unit and have therefore a longer duration of treatment than the period under analysis.
Another limitation in our study was the inability to obtain ABG on room air in a significant proportion of patients who performed ABG under oxygen therapy according to the severity of hypoxemia and the indication for LTOT.27,38–40 Although the significant reduction in hypercapnia and HCO3− does reflect the benefit of NIV, the same cannot be inferred regarding the PaO2 values. Other authors have also described this limitation.8,35
A further important limitation regarding efficacy outcomes is the absence of periodic assessment of health-related quality of life (HRQoL). However, most (56.9%) patients started NIV during admission for exacerbation and so HRQoL assessment performed at first outpatient evaluation would reflect the expected negative effect of hospitalization/exacerbation of the disease, with the corresponding expected recovery and not the effect of NIV institution itself. Although some patients periodically completed quality-of-life questionnaires, the majority filled them with support (62.3% of the patients had ≤4 years of schooling) and this difficulty increased with disease progression, so comparative analysis was not possible. Although we cannot prove that NIV benefited HRQoL, we point out that progressive compliance to home ventilation may be an indirect highlighter of comfort (6.9±3.4h/day at first evaluation and 8.7±3.6h/day at final evaluation p<0.001).
ConclusionsThe present study provides uncontrolled evidence that long-term compliance to NIV promotes reduction in the number of respiratory illness admissions of exacerbating COPD patients, as well as improvement in hypercapnia, and shows that patients with severe hypercapnia were more compliant to treatment, particularly with higher inspiratory airway pressures.
This is a real life study that reflects the clinical practice, the troubles and questions of the everyday. Despite its methodological limitations, it also suggests improvement in overall survival. The authors consider that the slow stepwise titration of NIV, aimed at the normalization of hypercapnia, was associated with a progressively increased compliance throughout the study which may have contributed to the results. However this remains speculative and needs to be investigated in future studies.
FundingThis research did not receive any specific grant from funding agencies in the public, commercial, or non-profit sectors.
Conflicts of interestNone declared.
We would like to thank Fernando Durão PhD (Instituto Superior Técnico, Universidade de Lisboa), for his contribution in the statistical analysis. Our special thanks to Cristina Bárbara PhD, Paula Pinto PhD and Rita Pinto Basto MD, who also provided clinical follow-up until 2012, and to all the respiratory nurses and technicians of the ventilators supplier companies who supported the hospital and domiciliary follow-up. We also express our gratitude to all participating pulmonologists who did the outpatient follow-up.


