
Computed tomographic (CT) phenotypic patterns of chronic obstructive pulmonary disease (COPD) identify different clinical features of disease. The impact of these variables on the physiological response to exercise has been the focus of a great deal of research as it allows more individualized clinical approaches. The aim of our study was to evaluate the relationships between CT phenotyping of subjects with COPD and the ventilatory response during cardiopulmonary exercise testing (CPET).
MethodsSubjects with COPD were classified into four phenotypes based on CT metrics of emphysema (low attenuation area less than a threshold of -950 Hounsfield [%LAA-950]) and airwall thickness (bronchial wall area percentage [%WA]).
ResultsEighty COPD patients (78.8% males, median age 65±11.3 years) were enrolled in the study. Based on CT phenotype, 25 (31.3%) patients were classified as normal, 27 (33.8%) air dominant, 17 (21.3%) emphysema dominant and 11 (13.8%) mixed type. The emphysema and mixed phenotypes showed the highest ventilatory equivalent for carbon dioxide (VE/VCO2) and VE/VCO2 slope (p<0,05). In all phenotypes, %LAA was positive correlated with VE/VCO2 and VE/VCO2 slope (r = 0.437, p = 0.006 and r = 0.503, p<0.001, respectively). %WA also showed a positive correlation with VE/VCO2 and VE/VCO2 slope (r = 0.541, p<0.001 and r = 0.299, p = 0.033, respectively). In multivariate regression models, after adjustment for age, BMI, sex and FEV1, %LAA was the only independent predictor of VE/VCO2 and VE/VCO2 slope (β 0.343, SE 0.147, 95% CI 0.009/0.610, p = 0.044 and β 0.496, SE 0.081, 95% CI 0.130/0.455, p = 0.001, respectively).
ConclusionEmphysema (%LAA) and airways metrics (%WA) had strong relationships with the different characteristics of ventilatory response to exercise in subjects with mild to moderate COPD. In particular, %LAA seemed to play an important role as an independent predictor of VE/VCO2 and VE/VCO2 slope. These results suggested that CT phenotyping may help predicting ventilatory response to exercise in subjects with COPD.
Chronic Obstructive Pulmonary Disease (COPD) is a complex and heterogeneous disorder characterized by airflow limitation, usually progressive and not fully reversible.1 The two major pathologies in COPD are characterized by small airway disease with peribronchiolar fibrosis and alveolar wall destruction (emphysema)2,3 that can be distinguished by computed tomographic (CT) images.4 This paradigm has served as the basis for the two traditionally classic COPD phenotypes classification: emphysema (“pink puffer”) and chronic bronchitis (“blue bloater”).5 The importance of the stratification of individuals with COPD has been stated in international guidelines over the past years,6 highlighting that more accurate phenotyping is of utmost importance due to its impact on therapeutic and prognostic.
Subjects with COPD often demonstrate significant exercise limitation, chiefly resulting from gas exchange abnormalities and ventilation-perfusion mismatching.7 It is so far unknown whether the morphologic abnormalities of the lung and different phenotypes are related to dyspnea intensity, exercise capacity and particularly to ventilation. We consider that a visual or quantitative evaluation of the lungs by CT scans and to perform an incremental cardiopulmonary exercise test (CPET) can play a predominant role in the clarification of the links between anatomical changes and exercise capacity in subjects with COPD. We therefore performed a retrospective study to evaluate the relationship between emphysema and airways metrics and the ventilatory response to exercise measured thorough CPET, in a population with mild to moderate COPD.
Material and methodsProtocol and study populationOur retrospective study was performed based on the analysis of data obtained from the medical records of subjects with COPD who underwent incremental cardiopulmonary exercise testing in the pulmonary function laboratory of the Centro Hospitalar e Universitário de Coimbra (Portugal) between January 2016 and December 2019. The number of patients was determined by the availability of incremental exercise test and CT scan of the thorax that were performed within a 6-month period. The inclusion criteria were the diagnosis of COPD according to international guidelines1 and being clinically stable during the previous 3 months (without baseline oxygen desaturation, increased wheezing, cough, dyspnea or sputum). The exclusion criteria were prior diagnosis of other cardio-respiratory conditions (i.e., asthma, interstitial lung diseases, primary pulmonary hypertension, chronic heart failure, muscular and peripheral vascular diseases) that could affect exercise performance. None of the patients had undergone any pulmonary rehabilitation program and none were on long-term oxygen therapy. Written informed consent was obtained from all subjects. This study was approved by the Ethics Commission of Centro Hospitalar e Universitário de Coimbra (234/2021).
Pulmonary function testsPulmonary function tests were performed in all subjects before CPET including spirometry, diffusing capacity of the lung for carbon monoxide (DLCO) and body plethysmography (MasterScreen PFT, Jaeger, Wurzburg, Germany). All procedures were performed according to the international recommendations.8-10 Measurements included forced expiratory volume in one second (FEV1), forced vital capacity (FVC), residual volume (RV), total lung capacity (TLC) and the DLCO as measure of lung diffusion capacity. Spirometric, DLCO and lung volumes measurements were standardized as percentages of predicted values by using prediction equations.11-13
Cardiopulmonary exercise testAll patients underwent physician-supervised standard incremental cycloergometer (Blue Cherry, XScribeTM) using a protocol of incremental intensity according to international recommendations.14,15 Typical values were described by Wasserman et al.16 Oxygen uptake (VO2), carbon dioxide production (VCO2), ventilation (VE), tidal volume (VT) and end-tidal CO2 partial pressure (PETCO2) were measured by breath-by-breath and averaged every 10 s for subsequent analysis. The cardiac frequency was monitored via 12 leads ECG. Arterial oxygen saturation was monitored by the use of a pulse oxymeter (SpO2). Peak work rate (WR), peak VO2 and peak VE were defined, respectively, as the highest level of exercise and the highest VO2 and VE that could be sustained for at least 15 s during the last stage of incremental exercise. The oxygen pulse was calculated by dividing VO2 by heart rate. Breathing reserve (BR) measured at peak exercise was estimated as the ratio of VE over the maximal ventilatory ventilation (MVV) that was calculated by multiplying the FEV1 by 40. The anaerobic threshold was detected using the V-slope method using computerized regression analysis of the slopes of the VCO2 vs VO2 plot, which detected the beginning of the excess CO2 output generated from the buffering of [H+]. The physiological dead space-to-tidal volume ratio (VD/VT), an index of lung gas exchange efficiency, was calculated. The modified Borg scale was used to rate the intensity of breathing discomfort and of leg discomfort at peak exercise.17
Computed tomographyEmphysemaThe chest CT scans were performed by using a multidetector CT system with 16-channel detector scanner (Brilliance, Philips Medical Systems) with volumetric acquisitions with reconstruction 1 mm thick in high spatial resolution algorithm. Emphysema was defined as the lowest attenuation areas using a Hounsfield Unit (HU) threshold of −950 (%LAA-950).18 In our study, emphysema was considered present whether the patients exhibited a %LAA-950 equal or higher than 15%.19,20
AirwayAirway dimensions were measured at the site near the origin of four segmental bronchi (RB1, LB1 + 2, LB10, and RB10). Wall area percentage (%WA), which was defined as WA/(WA + lumen area (LA)) × 100, was measured in each segmental bronchus as previously described.21-23 The mean value of each dimension value was used for statistical analyses. Since there is not an established threshold, we arbitrarily used the upper quartile (values above the 75th percentile) to determine the presence of significant airway disease/airway wall thickness.24 WA and LA are not independent from body height, and, thus, we normalized by body surface area (BSA), to reduce interindividual variability.25
COPD phenotyping based on CTSubjects with COPD were classified into four phenotypes based on CT scans using two cutoffs as previously described:%LAA-950 of 15% and the 75th percentile of the percentage of WA%. Patients with an %LAA-950 lower than 15% and WA% lower than the 75th percentile were categorized into normal phenotype group; patients with an %LAA-950 higher than 15% and %WA lower than the 75th percentile value were categorized into the emphysema dominant phenotype; patients with an %LAA-950 lower than 15% and WA% higher than the 75th percentile were categorized into the airway dominant phenotype; and patients with an %LAA-950 higher than 15% and %WA higher than the 75th percentile were categorized into the mixed phenotype.
StatisticsQuantitative data with a normal distribution were expressed as mean and standard deviation (SD) and those variables without normal distribution were expressed as median and interquartile range (P25-P75). Differences of continuous variables with normal distribution were determined by ANOVA and those with non-normal distribution with nonparametric Kruskal-Wallis test. Categorical variables were compared using the χ2 test. Pearson's correlation coefficients were used to assess bivariate relationships between CT-based and CPET measures. Multivariate regression linear models (method: Enter) were performed to identify predicting variables of ventilatory response to exercise. A p value less than 0.05 was considered statistically significant. Statistical analysis was performed by using the SPSS 25.0 software.
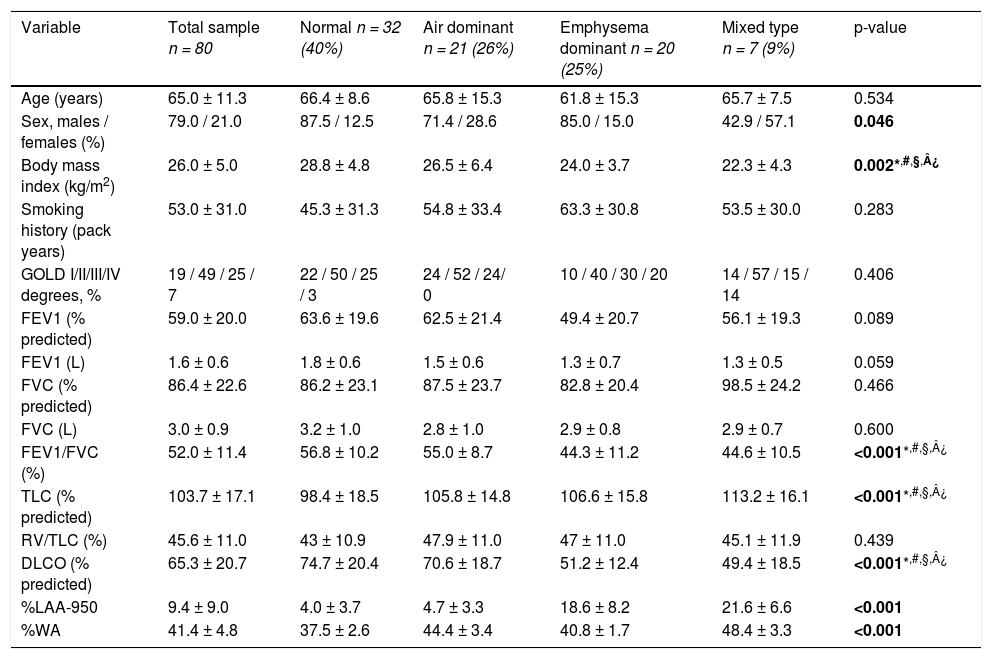
ResultsPatient clinical characteristicsA total of 80 subjects with COPD followed in the Centro Hospitalar e Universitário de Coimbra were included in this retrospective study and their characteristics are described in detail in Table 1. The mean age of participants was 65.0 ± 11.3 years and 78.8% were male subjects. According to the GOLD classification, 19% of the patients were categorized as GOLD 1, 49% as GOLD 2, 25% as GOLD 3 and 7% as GOLD 4. In overall, the subjects exhibited a moderate obstruction (FEV1 59.0 ± 20.0% of predicted), mild level of hyperinflation (RV/TLC 45.6 ± 11.0%), and a mildly impaired pulmonary diffusion (DLCO 65.3 ± 20.7).
Characteristics of the population of subjects with COPD included in this study.
| Variable | Total sample n = 80 | Normal n = 32 (40%) | Air dominant n = 21 (26%) | Emphysema dominant n = 20 (25%) | Mixed type n = 7 (9%) | p-value |
|---|---|---|---|---|---|---|
| Age (years) | 65.0 ± 11.3 | 66.4 ± 8.6 | 65.8 ± 15.3 | 61.8 ± 15.3 | 65.7 ± 7.5 | 0.534 |
| Sex, males / females (%) | 79.0 / 21.0 | 87.5 / 12.5 | 71.4 / 28.6 | 85.0 / 15.0 | 42.9 / 57.1 | 0.046 |
| Body mass index (kg/m2) | 26.0 ± 5.0 | 28.8 ± 4.8 | 26.5 ± 6.4 | 24.0 ± 3.7 | 22.3 ± 4.3 | 0.002*,#,§,¿ |
| Smoking history (pack years) | 53.0 ± 31.0 | 45.3 ± 31.3 | 54.8 ± 33.4 | 63.3 ± 30.8 | 53.5 ± 30.0 | 0.283 |
| GOLD I/II/III/IV degrees, % | 19 / 49 / 25 / 7 | 22 / 50 / 25 / 3 | 24 / 52 / 24/ 0 | 10 / 40 / 30 / 20 | 14 / 57 / 15 / 14 | 0.406 |
| FEV1 (% predicted) | 59.0 ± 20.0 | 63.6 ± 19.6 | 62.5 ± 21.4 | 49.4 ± 20.7 | 56.1 ± 19.3 | 0.089 |
| FEV1 (L) | 1.6 ± 0.6 | 1.8 ± 0.6 | 1.5 ± 0.6 | 1.3 ± 0.7 | 1.3 ± 0.5 | 0.059 |
| FVC (% predicted) | 86.4 ± 22.6 | 86.2 ± 23.1 | 87.5 ± 23.7 | 82.8 ± 20.4 | 98.5 ± 24.2 | 0.466 |
| FVC (L) | 3.0 ± 0.9 | 3.2 ± 1.0 | 2.8 ± 1.0 | 2.9 ± 0.8 | 2.9 ± 0.7 | 0.600 |
| FEV1/FVC (%) | 52.0 ± 11.4 | 56.8 ± 10.2 | 55.0 ± 8.7 | 44.3 ± 11.2 | 44.6 ± 10.5 | <0.001*,#,§,¿ |
| TLC (% predicted) | 103.7 ± 17.1 | 98.4 ± 18.5 | 105.8 ± 14.8 | 106.6 ± 15.8 | 113.2 ± 16.1 | <0.001*,#,§,¿ |
| RV/TLC (%) | 45.6 ± 11.0 | 43 ± 10.9 | 47.9 ± 11.0 | 47 ± 11.0 | 45.1 ± 11.9 | 0.439 |
| DLCO (% predicted) | 65.3 ± 20.7 | 74.7 ± 20.4 | 70.6 ± 18.7 | 51.2 ± 12.4 | 49.4 ± 18.5 | <0.001*,#,§,¿ |
| %LAA-950 | 9.4 ± 9.0 | 4.0 ± 3.7 | 4.7 ± 3.3 | 18.6 ± 8.2 | 21.6 ± 6.6 | <0.001 |
| %WA | 41.4 ± 4.8 | 37.5 ± 2.6 | 44.4 ± 3.4 | 40.8 ± 1.7 | 48.4 ± 3.3 | <0.001 |
Data are presented as number of patients (%) or mean ± standard deviation (SD), unless otherwise stated.
Mixed vs. Air dominant type, p <0.05.
Abbreviations: FEV1, forced expiratory volume at 1st second; FVC, forced vital capacity; RV, residual volume; TLC, total lung capacity; DLCO, diffusion capacity for carbon monoxide; %LAA-950, percentage of low attenuation areas below −950 Hounsfield Units; %WA, wall area percentage.
In all subjects, the values of CT emphysema (%LAA) an airway wall thickening (%WA) were 9.4 ± 9.0% and 41.4 ± 4.8%, respectively. The 75th percentile for %WA, used for defining the presence of significant airway disease, was 44.6%.
PhenotypesBased on the CT findings of emphysema (%LAA) and air wall thickening (%WA), the subjects were classified into four phenotypes. Of the 80 subjects with COPD, 32 (40%) were defined as normal, 21 (26%) as airway dominant, 20 (25%) as emphysema dominant and 7 (9%) as mixed phenotype.
There was no difference in age and smoking history (measured by pack-years) among the phenotypes (p>0.05) (Table 1). Body mass index was lower in the emphysema dominant and mixed phenotypes than in the normal and air dominant subgroups.
Subjects with COPD in the emphysema and mixed phenotype had more severe airflow limitation as assessed by FEV1. Moreover, we found a significant difference in DLCO, with lower values for emphysematous and mixed type subjects than for the remaining two CT-based phenotypes.
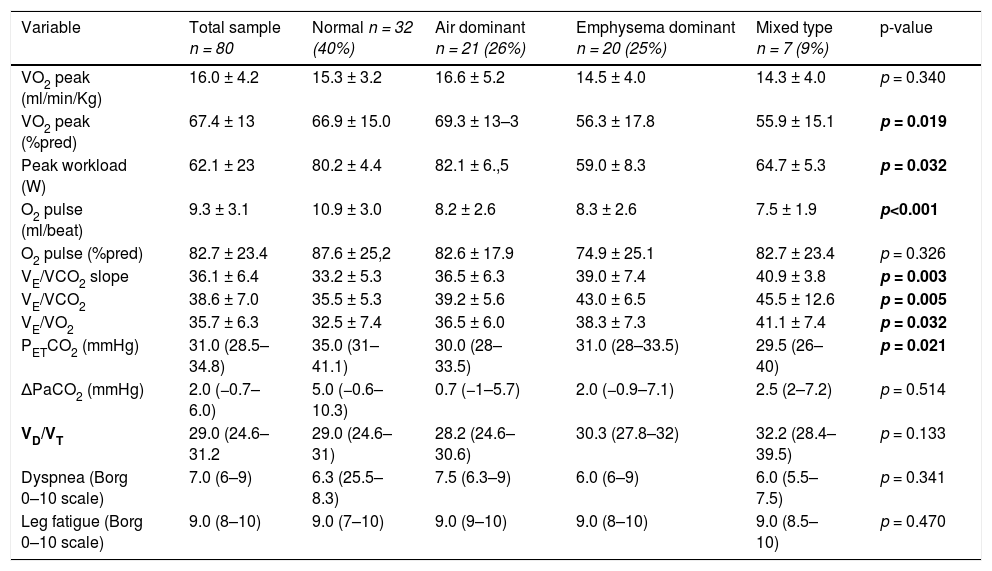
Association between CT emphysema and airway disease and ventilatory responses at peak exerciseCPET was performed in all subjects. In overall, the exercise tolerance was reduced in the study group (peak VO2 16.0 ± 4.2 ml/min/Kg [67.4% predicted]). CPET data obtained from of the whole sample of patients are summarized in Table 2.
CPET parameters at peak of exercise, according distribution in phenotypes.
Data are shown as mean ± standard deviation (SD) or median (interquantile range).
Bold text indicates a statistically significant difference.
Abbreviations: VO2, Oxygen uptake; VCO2, carbon dioxide production; PETCO2, end-tidal carbon dioxide partial pressure; VE/VCO2, ventilatory equivalent for CO2; VE/VO2, ventilatory equivalent for O2; ΔPaCO2, peak-to-rest change in PaCO2.
According to the classification in phenotypes, we found significant differences in distribution in peak VO2 (%pred) and peak workload, both with a lower value in the emphysema and mixed phenotype. The other cardiovascular and metabolic variables distribution was not significant diverse among phenotypes, as well as the dyspnea intensity and leg fatigue at peak exercise (p>0.05).
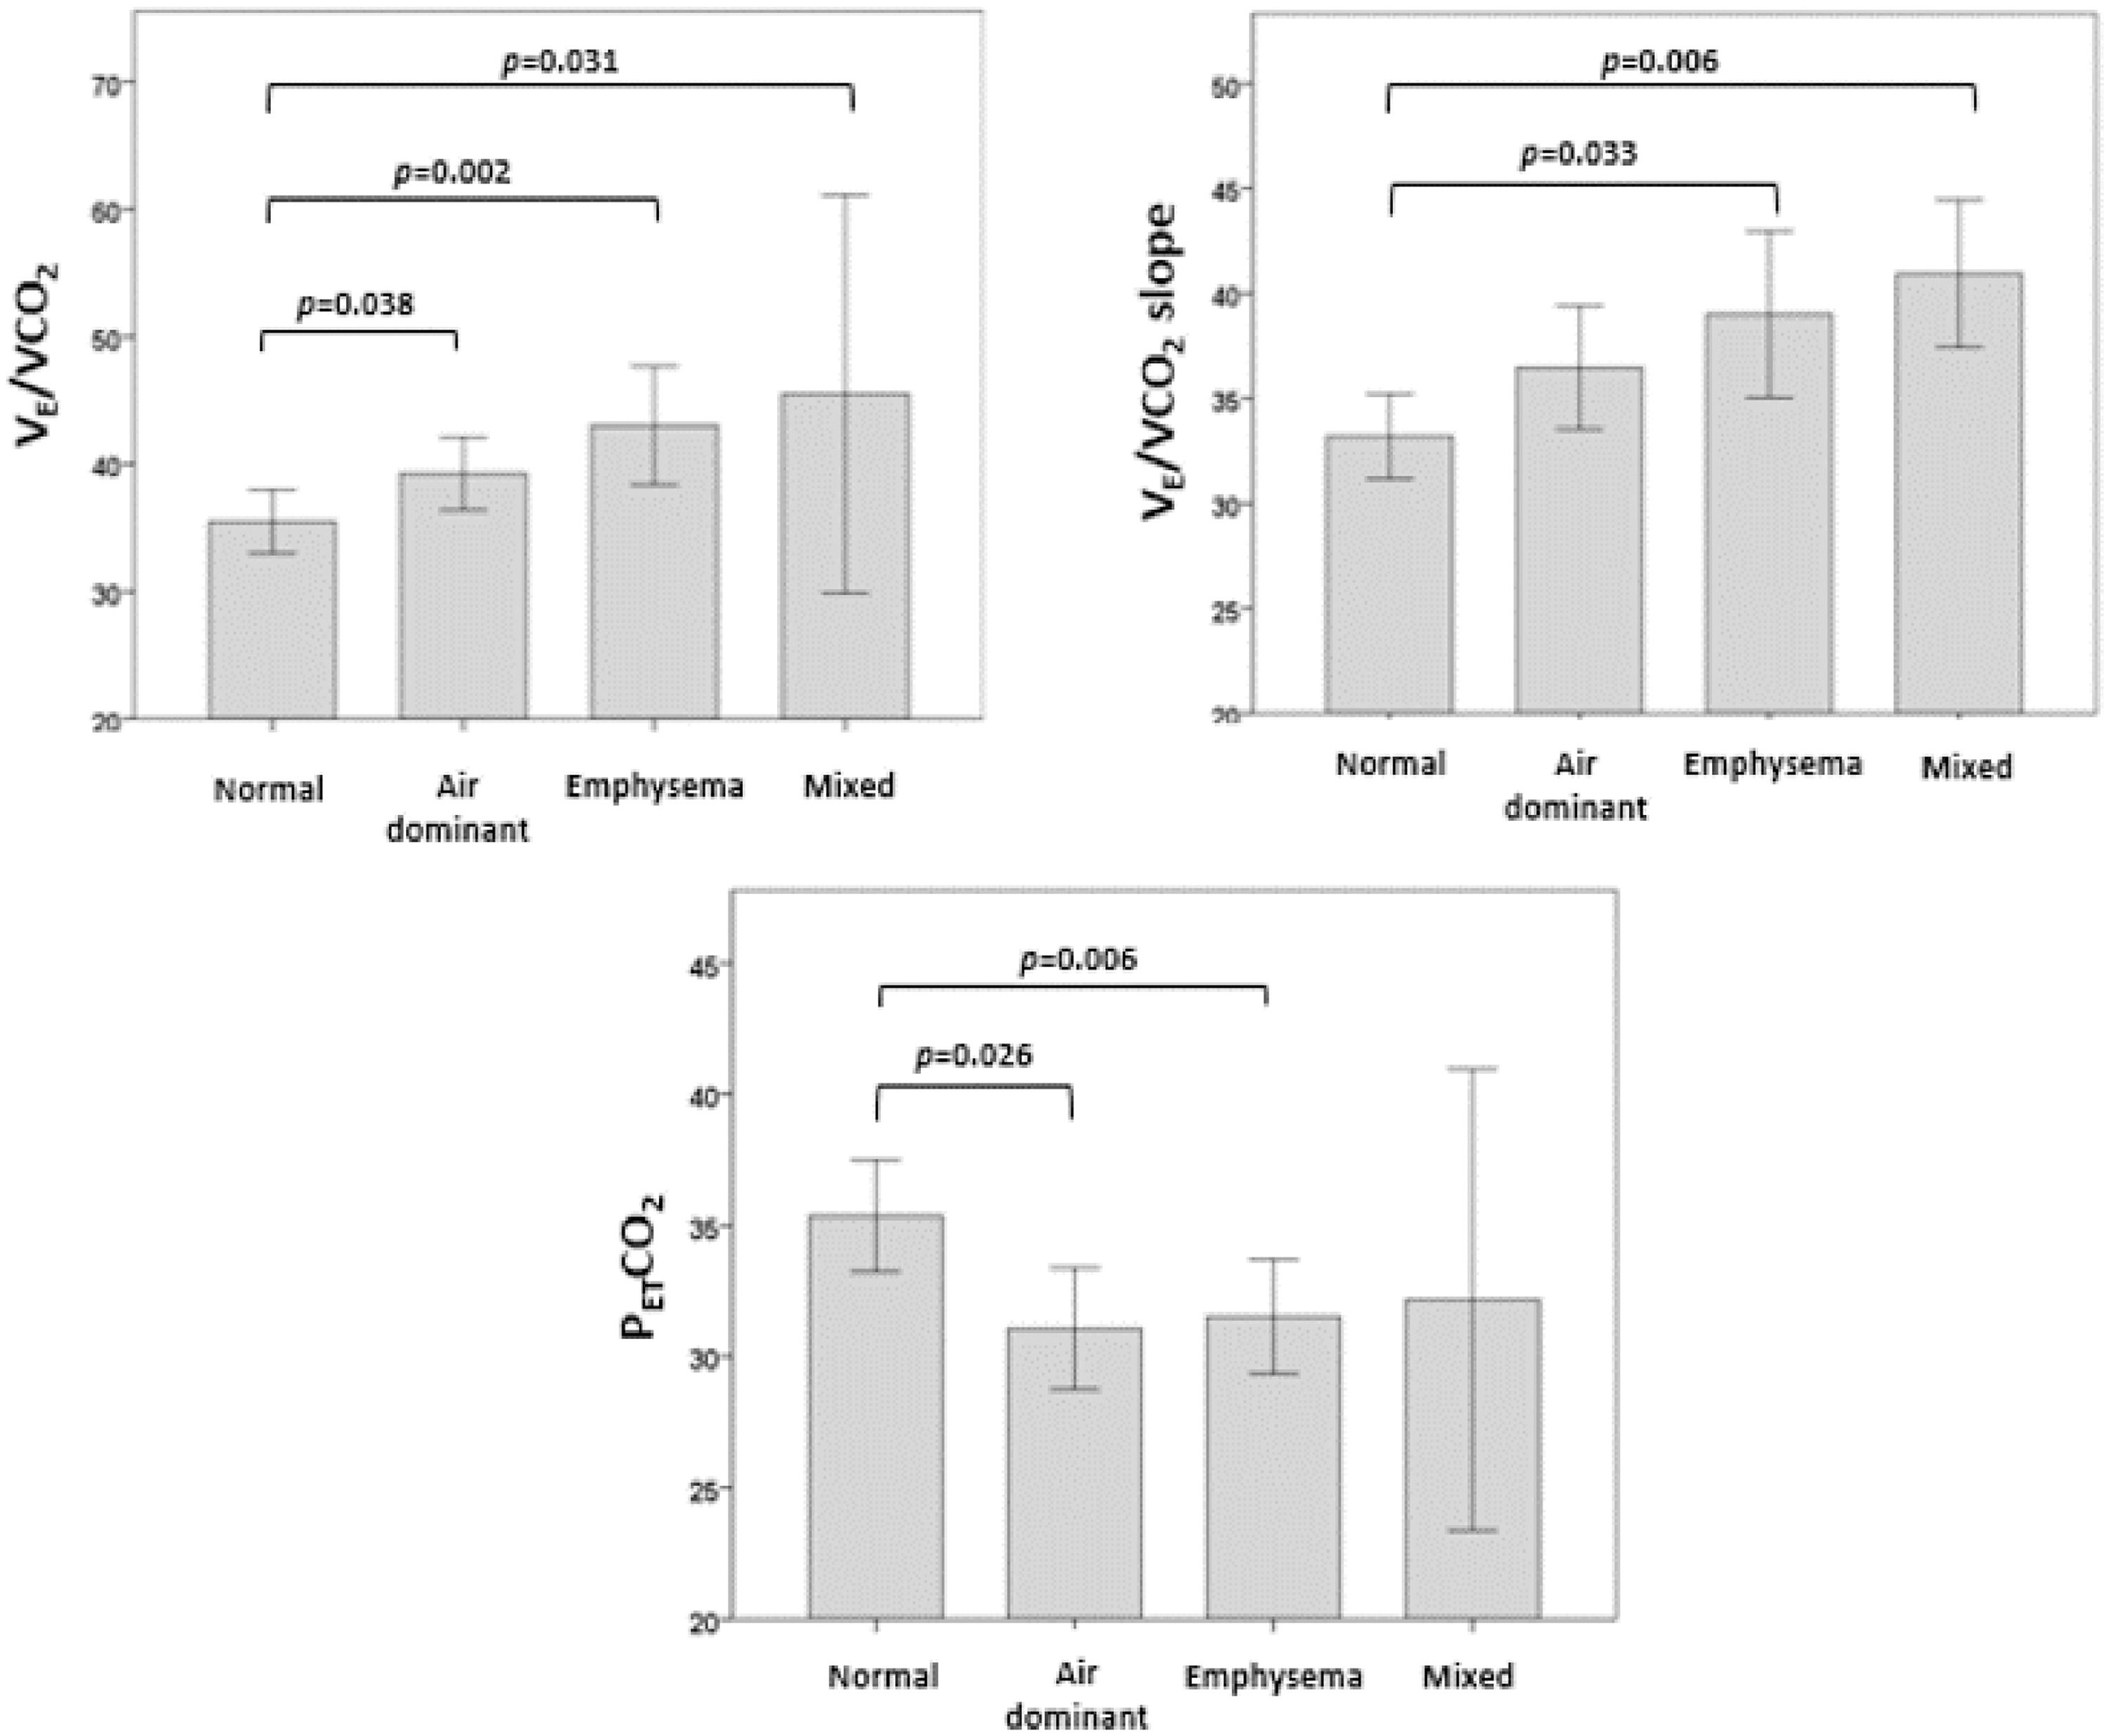
Regarding the ventilatory response, we analyzed the distribution of VE/VCO2, VE/VCO2 slope and PETCO2 at peak exercise according to CT phenotypes (Fig. 1). VE/VCO2 was significantly higher in the mixed, emphysema and air dominant phenotypes than in the normal phenotype (p = 0.031, p = 0.002, p = 0.038, respectively). Concerning VE/VCO2 slope, values were significantly higher in mixed and emphysema phenotypes than in the normal one (p = 0.006 and p = 0.033, respectively). The variable PETCO2 was significantly lower in the emphysema phenotype and air dominant phenotypes than in the normal phenotype (p = 0.006 and p = 0.026, respectively). No significant differences were found in the distribution of peak-to-rest change in PaCO2 (ΔPaCO2) or VD/VT.

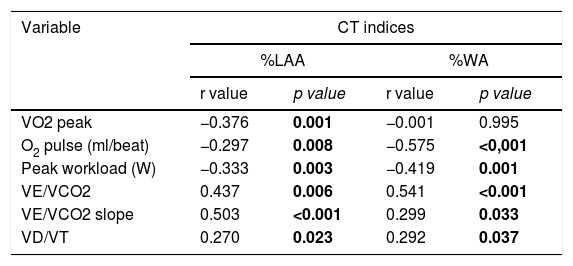
CT indices of both lung emphysema severity and airway wall thickening were negatively associated with exercise capacity and ventilatory response (Table 3). The results demonstrated that, in all four phenotypes, LAA% was inversely correlated with peak VO2, O2 pulse and peak workload (r=−0.376, p = 0.01; r=−0.297, p = 0.008; r=−0.333, p = 0.003; respectively). In contrast, LAA% showed a positive correlation with peak VE/VCO2 and VE/VCO2 slope (r = 0.437, p = 0.006 and r = 0.503, p<0.001). The extent of emphysema was related with increased dead space as LAA% was positive correlated with VD/VT (r = 0,270, p = 0,023). With regards to WA%, it was inversely correlated with O2 pulse and peak workload (r=−0.575, p<0,001 and r=−0.419, p = 0.001), but not with peak VO2. On the other hand, airway wall thickening was positive correlated with peak VE/VCO2, VE/VCO2 slope and VD/VT (r = 0.541, p<0.001; r = 0.299, p = 0.033; r = 0.292, p = 0.037; respectively).
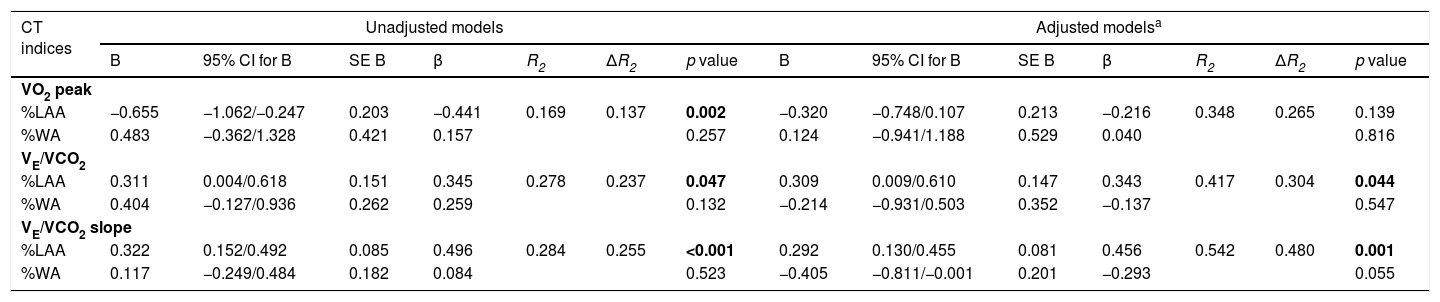
A multiple linear regression was run to predict exercise capacity and ventilatory response in unadjusted and adjusted models for age, gender, BMI and FEV1 (Table 4). Emphysema severity (%LAA) was the only independent predictive variable for VE/VCO2 in unadjusted (β 0.345; SE 0.151; 95% CI 0.004/0.618; p = 0.047) and adjusted models (β 0.343; SE 0.147; 95% CI 0.009/0.610; p = 0.044), as well for VE/VCO2 slope in unadjusted (β 0.496; SE 0.085; 95% CI 0.152/0.492; p<0.001) and adjusted models (β 0.496; SE 0.081; 95% CI 0.130/0.455; p = 0.001). The evaluation of the variable peak VO2 demonstrated that %LAA was also the only independent predictive variable in unadjusted model (β −0.441; SE 0.203; 95% CI −1.062/−0.247; p = 0.002), but not in adjusted model.
Multiple linear regression models for the association between parameters from CPET and CT indices.
| CT indices | Unadjusted models | Adjusted modelsa | ||||||||||||
|---|---|---|---|---|---|---|---|---|---|---|---|---|---|---|
| B | 95% CI for B | SE B | β | R2 | ΔR2 | p value | B | 95% CI for B | SE B | β | R2 | ΔR2 | p value | |
| VO2 peak | ||||||||||||||
| %LAA | −0.655 | −1.062/−0.247 | 0.203 | −0.441 | 0.169 | 0.137 | 0.002 | −0.320 | −0.748/0.107 | 0.213 | −0.216 | 0.348 | 0.265 | 0.139 |
| %WA | 0.483 | −0.362/1.328 | 0.421 | 0.157 | 0.257 | 0.124 | −0.941/1.188 | 0.529 | 0.040 | 0.816 | ||||
| VE/VCO2 | ||||||||||||||
| %LAA | 0.311 | 0.004/0.618 | 0.151 | 0.345 | 0.278 | 0.237 | 0.047 | 0.309 | 0.009/0.610 | 0.147 | 0.343 | 0.417 | 0.304 | 0.044 |
| %WA | 0.404 | −0.127/0.936 | 0.262 | 0.259 | 0.132 | −0.214 | −0.931/0.503 | 0.352 | −0.137 | 0.547 | ||||
| VE/VCO2 slope | ||||||||||||||
| %LAA | 0.322 | 0.152/0.492 | 0.085 | 0.496 | 0.284 | 0.255 | <0.001 | 0.292 | 0.130/0.455 | 0.081 | 0.456 | 0.542 | 0.480 | 0.001 |
| %WA | 0.117 | −0.249/0.484 | 0.182 | 0.084 | 0.523 | −0.405 | −0.811/−0.001 | 0.201 | −0.293 | 0.055 | ||||
The model was adjusted for age, sex, BMI and FEV1.
Bold text indicates a statistically significant difference.
For abbreviations see Table 1.
In this observational study of subjects with stable mild to moderate COPD, we demonstrated that CT measurements of both emphysema (%LAA) and airway wall thickening (%WA) were strictly associated with ventilatory response to exercise. In our study, we compared four CT-based phenotypes of subjects with COPD and we found that subjects with an emphysematous phenotype (emphysema dominant and mixed phenotype) had a different profile in terms of BMI, lung function, and exercise capacity. BMI was lower and airflow limitation more severe in emphysematous phenotype than in non-emphysematous phenotypes (normal and air dominant phenotype), as expected.26-28 Our findings of lower levels of peak VO2 in this subgroup confirmed previous data of an overall lower exercise capacity of individuals with emphysema.27-29
In this present study, subjects with an emphysematous phenotype showed higher peak VE/VCO2 and VE/VCO2 slope than the remaining CT-phenotypes (normal and air dominant). Furthermore, we showed an inverse association between emphysema metrics (%LAA) and VE/VCO2, VE/VCO2 slope and PETCO2 peak values, as the first two variables decreased and the last one increased, respectively, as the emphysema severity increased. We interpreted this result as an indicator of a more pronounced ventilatory inefficiency in the subjects with an emphysematous phenotype (emphysema dominant and mixed phenotype), which corroborated the findings of other studies. For instance, Crisafulli et al.28 demonstrated that subjects with COPD with more severe emphysema required higher levels of VE to clear the CO2 produced during exercise (i.e., VE/VCO2 slope). Jones et al.30 also showed that the higher the extent of emphysema was, the higher the VE/VCO2 at peak. Consistent with the aforementioned studies, more recently, Rinaldo et al.29 presented a higher VE/VCO2 and VE/VCO2 slope at peak exercise in emphysematous individuals compared to non-emphysematous. However, Paoletti et al.7 found contrasting results as they showed that in individuals with more severe level of emphysema (>50% at HRCT), and in comparison to individuals with less disease (≤50%), the value of VE/VCO2 slope was lower. The authors explained these results as related to the abnormal dynamic respiratory mechanisms limiting severe emphysema in patients, the physiological increase of VE in response to VCO2 (low VE/VCO2 slope). We did not note that tendency possibly due to a small sample of individuals with high level of emphysema metrics.
Besides supporting previous published results, our study seemed to indicate, to the best of our knowledge, for the first time, %LAA as an independent predictor of VE/VCO2 and VE/VCO2 slope at peak. These results could provide valuable information for pulmonologists predicting ventilatory response to exercise in subjects with COPD who cannot perform CPET because of muscular and/or osteoarticular problems. Moreover, this complementary information that objective analysis of CT scans provide, may be of utility for further understanding the relationship of lung structure and the clinical manifestations of disease.
Regarding the degree of airway wall thickness (%WA), we could not show a significant and predictive role in ventilatory response to exercise. One possible reason for these results might be the fact that, for airway wall thickness evaluation, only segmental bronchi were measured. It is possible that this measure not reflected the severity of small airway disease and the distal airflow limitation, and therefore, the ventilatory response to exercise.
Although the relevant results obtained, this study has some limitations that need to be considered. Firstly, this was a single-center retrospective study and the sample size was not large and its size has not been calculated, which can add a bias to this study. Therefore, the results need to be confirmed in a multicenter trial with a larger sample size. Secondly, our sample of patients was characterized by a predominance of male subjects and, consequently, our results can not be generalizable to female patients. Thirdly, the study population was not representative of all stages of GOLD severity, thus the results may not be generalizable to the entire COPD population. Lastly, the 75th percentile of the %WA was used as a cutoff for phenotyping subjects with COPD. Although, there is not a defined cutoff value of quantitative CT measure for defining bronchial wall thickening, the 75th percentile of the %WA was used for phenotyping the airway-dominant group in a previous study.24 Additionally, we analyzed CT only in terms of emphysema and airways metrics but not in terms of qualitative changes in parenchymal and airways, such as bronchiectasis or pulmonary bullae.
ConclusionOur study demonstrated that in subjects with mild to moderate COPD, emphysema and airwall thickness had strong correlations with the different characteristics of ventilatory response to exercise.%LAA played an important role as an independent predictor of VE/VCO2 and VE/VCO2 slope peak values. Accordingly, subjects with an emphysematous phenotype (emphysema and mixed phenotype) were associated with less ventilatory efficiency during exercise. CT phenotyping may thus provide useful information on ventilatory response to exercise in subjects with COPD who cannot perform CPET. In this case, the severity of emphysema might be used to predict VE/VCO2 and VE/VCO2 slope.
This research did not receive any specific grant from funding agencies in the public, commercial, or not-for-profit sectors.


