


Adequate pharmacological control is essential to avoid complications in patients with chronic obstructive pulmonary disease (COPD). However, it has been shown that non-pharmacological strategies such as appropriate weight and nutrition control are also important.1
Increased mortality has been associated in patients with COPD and low body mass index (BMI). Therefore, it is included in some multidimensional indexes.2,3 The PLATINO study (Proyecto Latinoamericano de Investigación en Obstrucción Pulmonar), reports that low weight and BMI are independent risk factors for mortality in people with COPD; this association can be stronger when patients have greater airflow obstruction.3
Consequently, theories such as the “obesity paradox” have emerged, substantiating the need to know the nutritional status of the patient at the time of any intervention.4 However, in Latin America, including Colombia, studies that relate COPD to BMI, exercise capacity and health-related quality of life (HRQoL) are scarce. Therefore, the objective of this study was to determine if there were differences in clinical variables, exercise capacity and HRQoL in patients with COPD, according to their BMI.
A descriptive cross-sectional study was carried out from July 2015 to June 2017. Patients with a previous medical diagnosis of COPD with spirometry and who entered a pulmonary rehabilitation program of the Clinica de Occidente in Cali - Colombia, were included. The Institutional Ethics Committee approved the study.
The patients were divided into four groups, according to the BMI Classification of the World Health Organization (WHO): Underweight (BMI less than 18.5 kg/m2), Normal weight (BMI ≥ 18.5 and less than 25.0 kg/m2), Overweight (BMI ≥ 25.0 and less than 30.0 kg/m2), and Obesity (BMI ≥30.0 kg/m2).
Spirometry and baseline dyspnea with the modified medical research council (mMRC) scale were assessed. At the beginning and at the end of the 6-minute walk test (6MWT), patients were measured for distance, VO2 estimated (3.5 ml/kg/min + (speed m/min × 0.1), heart rate, respiratory rate, modified Borg dyspnea scale, and oxygen saturation (SpO2).
Anxiety/Depression was evaluated using the Hospital Anxiety and Depression Scale (HADS) questionnaire (8 as the cut-off point). Health-Related Quality of Life (HRQoL) was measured using the St. George's Respiratory Questionnaire (SGRQ).
The descriptive analysis was carried out for all the variables. To determine the differences according to the BMI group, ANOVA tests were performed, and Dunnett's T3 test confirmed the inter and intragroup differences. As a result, 99 patients organized according to BMI were linked into Underweight n = 10, Normal n = 42, Overweight n = 33, Obesity n = 14.
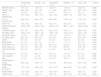
Table 1 shows the patients’ characteristics. Table 2 depicts the BMI and clinical variables. The variables distance in 6MWT, VO2e, and the Activity domain of the SGRQ showed statistically significant differences within the groups. Regarding the distance in the 6MWT, the BMI of the underweight and obese groups showed intergroup differences (95% CI under-Normoweight (7.10–152.38) under-Overweight (37.11–186.19), compared with Normal and overweight BMI. There was a similar finding for VO2e. The Activity domain of the SGRQ showed statistically significant differences.
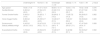
Patients characteristics.
*Mean ± Standard Deviation
Clinical characteristics
mMRC: modified Medical Research Council, FEV1: Forced Expired Volume in the First Second, FVC: Forced Vital Capacity, FEV1/FVC: Forced Expired Volume in the First Second/Forced Vital Capacity ratios, SpO2: Oxygen Saturation, VO2e: Consumption Oxygen estimated, 6MWT Distance: 6-Minutes Walk Test Distance, HAD: Hospital Anxiety and Depression Scale, SGRQ: Saint George Respiratory Questionnaire, HR: Heart Rate, RR: Respiratory Rate
* Statistically significant intergroup differences Underweight vs Normal p-value = 0.010 and Underweight vs Overweight p-value = 0.015
** Statistically significant intergroup differences Underweight vs Overweight p-value = 0.045
*** Statistically significant intergroup differences Underweight vs Obesity p-value = 0.038
These findings reveal that patients who were overweight, according to the BMI, had better results in terms of exercise capacity and HRQoL. These changes could have several explanations: patients with sustained hypoxia and oxidative metabolism could experience muscle wasting.5 Our study supports this thesis and identifies the need to strengthen patient care strategies, supporting the use of drug treatment accompanied with non-drug strategies such as pulmonary rehabilitation and nutritional intervention (e.g., proper food and supplementation).
Regarding the evaluation of functional exercise capacity, it was found that the overweight group reached more distance on the 6MWT and obtained greater VO2e, followed by the normal BMI group. Physical inactivity is linked to early loss and wasting of muscle function, which can further decrease physical activity and exercise tolerance.6 This could also explain why patients deteriorated more significantly in the Activity domain of the HRQoL.7 In addition, the literature reports that obesity in this type of patient allows them to have greater metabolic reserve, which leads to better survival rates and fewer exacerbations and emergency visits.8
According to the results, patients with a diagnosis of COPD who were overweight had better exercise capacity and HRQoL in the activities domain compared to patients with normal weight and malnutrition. However, these findings will have to be confirmed with large intervention studies.


