


Cardiopulmonary exercise testing (CPET) is an important tool to identify and to evaluate the severity of cardiopulmonary diseases. Due to the outbreak of the COVID-19 pandemic, many pulmonary function laboratories suspended CPET.
Resting expiratory flow rates and minute ventilation are increased 10-fold during exercise.1 This is an important issue during a respiratory virus pandemic, since it raises some concerns about the higher risk of aerosol production and virus transmission during CPET. Studies are emerging to work around this situation by assessing the potential of surgical or N95 masks and bacterial filters to mitigate this hazard.2,3 However, there is some opposition to the use of increased ventilator resistance and water vapour saturation, which might compromise CPET's results.4
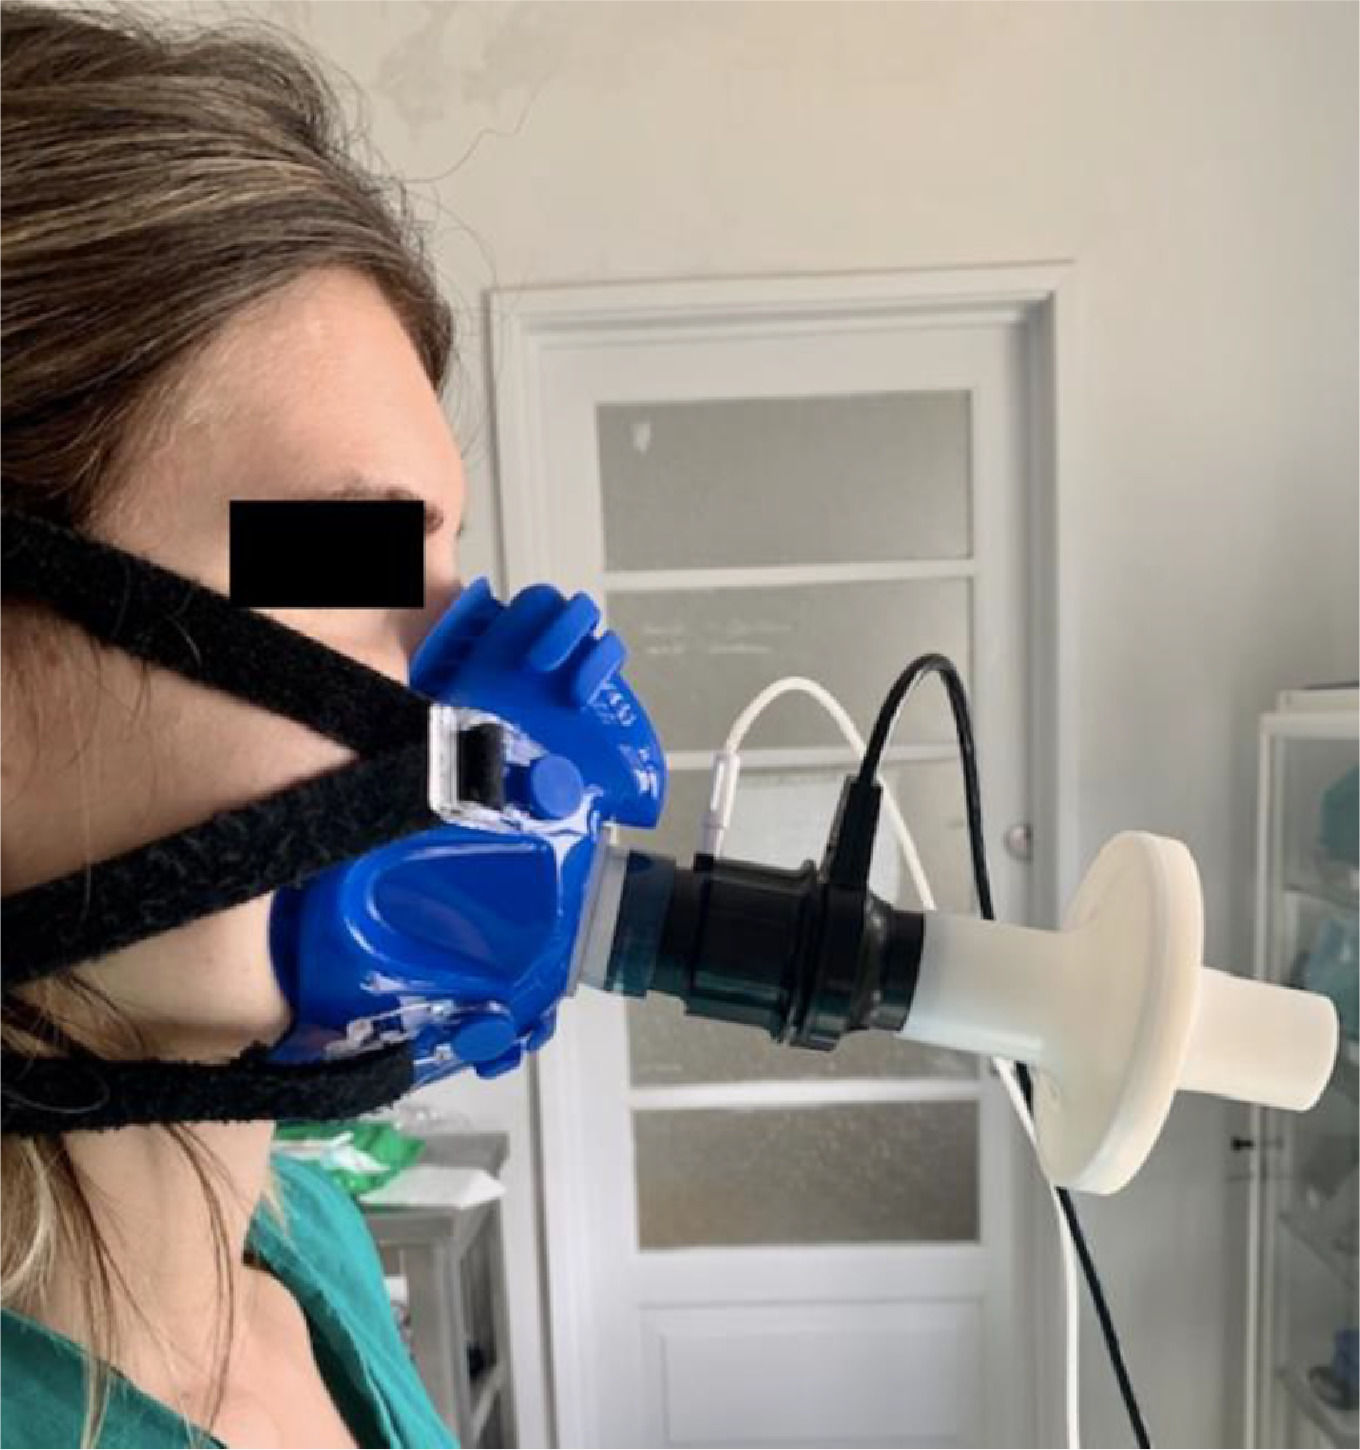
We conducted a study to evaluate the impact of a virus filter on CPET. A PFT filter (MicroGard II Vyaire Medical GmbH) was used, which provides 99.99% protection against virus and bacteria. Ten healthy volunteers with a mean age of 39 years-old (±6.1) and a body mass index of 23.6 Kg/m2 (±3.6) performed two incremental cycling CPETs, based on Wasserman's protocol,5 starting with 3 min at rest, then 3 minutes cycling without load, followed by cycling with incremental load up to volitional exhaustion that was defines as a drop in cadence of ≥ 10 rpm for 5 consecutive seconds despite verbal encouragement. Each subject performed the CPETs approximately 2 h apart, with and without the filter. They were familiar with the test since they were pulmonology residents, specialists or technicians that worked at the respiratory functional laboratory. Five of them were randomly selected to perform the first CPET with the filter and the other half started without the filter. The filter was placed in-line, downstream of the gas analyzer sample line (Fig. 1). The CPET's results for the same subject were compared using the same incremental load.
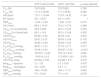
At rest, we did not find any significant difference between tests. We found a significant increase in oxygen consumption (VO2) in CPETs performed with the filter, both at anaerobic threshold (46.8% vs 52.5%, p-value 0.032) and at the peak exercise (82.0% vs 90.5%, p-value 0.006) – Table 1. We also found a significant increase in the partial pressure of end tidal oxygen (PETO2,p-value 0.009) and carbon dioxide (PETCO2, p-value <0.001) in CPETs performed with the filter. However, no difference was found in minute ventilation (VE) or the minute ventilation/carbon dioxide production slope (VE/VCO2) measurements. Likewise, no difference was found between CPET's maximum load. We did not observe other statistically significant findings between CPETs (Table 1).
Differences between CPETs with and without the filter.
Data are presented as mean ± SD or median [range]; *p < 0.05.
PAT – anaerobic threshold power; Pmax – maximum power; HR - heart rate; BF - breathing frequency; RER – respiratory exchange ratio; VE – minute ventilation; VO2AT – anaerobic threshold oxygen consumption; VO2max – maximum oxygen consumption; VE/VCO2AT – anaerobic threshold ventilatory equivalent for carbon dioxide; VE/VCO2AT – maximum ventilatory equivalent for carbon dioxide; VE/VO2max – maximum ventilatory equivalent for oxygen; PETCO2AT – anaerobic threshold partial pressure of end tidal carbon dioxide; PETCO2AT – maximum partial pressure of end tidal carbon dioxide; PETO2AT - anaerobic threshold partial pressure of end tidal oxygen; PETO2max – maximum partial pressure of end tidal oxygen; SBP – systolic blood pressure; DBP - dyastolic blood pressure;
The increase VO2 in CPETs performed with a filter found in our study is a surprising result, since oxygen consumption increases linearly with load (about 10 ml of oxygen consumed per watt of work and per kilogram)5 and no difference was found on this variable. Therefore, the use of the filter did not impair the volitional tolerance and did not have an impact on effort, as we found no significant difference in dyspnea and leg fatigue measured by Borg's scale.6
In summary, in this small number of heathy subjects we observed significant differences in VO2AT, VO2max, PETO2 and PETCO2 that may be related to the resistance imposed by the filter requiring more effort from ventilatory muscles, which did not impact dyspnea in healthy individuals. These differences may have clinical impact on CPETs performed in some patients with respiratory diseases, but also for people with muscle weakness. This study provides us preliminary information concerning the use of filter in CPET, which might impair its interpretation. A perspective for future studies should include larger population samples and the assessment of patients with respiratory diseases and muscle weakness.


