


Predictive equations of maximum inspiratory (Pimax) and expiratory (Pemax) pressures are important for detecting respiratory muscle weakness. A recent systematic review identified 42 Pimax and 34 Pemax equations as available for healthy adults, but to date no single equation has been recommended.1 This is problematic as it is known that the presence or absence of respiratory muscle weakness is critically dependent on the equation selected.1 Predictive equations should be population-specific and none of the identified equations have been developed in Portugal.2 Portuguese people present specific characteristics, for example they tend to be shorter than people of most other European countries,3 which may affect how these equations are applied. In the current absence of an equation developed for Portugal, healthcare professionals need short-term guidance on which equations are more appropriate to use. Thus, we explored the suitability of the available predictive equations in a sample of healthy Portuguese adults.
A cross-sectional study, approved by the Ethics Committee of the University of Aveiro (8/2015), was conducted with healthy Portuguese adults recruited from the community. All participants signed an informed consent. Sociodemographic, anthropometric and clinical data were collected to characterise the sample. Respiratory muscle testing followed the European Respiratory Society guidelines1 (MicroRPM, Carefusion, Basingstoke, UK). Descriptive statistics, Wilcoxon signed-rank tests, Bland-Altman plots and Spearman correlation coefficients were used to characterise the sample, test differences between real and predicted values and ascertain the absolute reliability and concurrent validity, respectively. The lower limit of normality (LLN) was computed as: mean−1.645×standard deviation.4
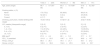
A total of 229 Caucasian individuals (n=141, 61.6% men) were included. Participants’ characteristics are detailed in Table 1.
Characteristics of the participants (n=229).
| Total (n=229) | Women (n=88) | Men (n=141) | |
|---|---|---|---|
| Age, years (range) | 66.7±9.7 (43–90) | 65.3±10.4 (46–90) | 67.6±9.2 (43–89) |
| Smoking status, n (%) | |||
| Never | 173 (75.2) | 85 (96.6) | 88 (61.4) |
| Former | 52 (23.1) | 3 (3.4) | 49 (35.8) |
| Current | 4 (1.7) | 0(0) | 4 (2.8) |
| Smoking, pack-years, median [interquartile range] | 16 [5.0–35.0] | 0.9 [0.6–1.2] | 20 [6.7–35.8] |
| CCI, median [interquartile range] | 2 [2–3] | 3 [2–3] | 2 [1–3] |
| 0, n (%) | 6 (2.7%) | 3 (3.4%) | 3 (2.3%) |
| 1–2, n (%) | 114 (51.8%) | 40 (46%) | 74 (55.6%) |
| 3–4, n (%) | 94 (42.7%) | 41 (47.1%) | 53 (39.8%) |
| ≥5, n (%) | 6 (2.7%) | 3 (3.4%) | 3 (2.3%) |
| BMI, kg/m2 | 27.8±4.4 | 28.1±5.3 | 27.7±3.7 |
| FEV1, % predicted | 101.8±20.5 | 109.7±23.3 | 96.8±16.7 |
| Pimax, cmH2O | 88.5±26.1 | 79.4±21.7 | 94.7±27.2 |
| Pemax, cmH2O | 126.9±36.6 | 104.9±25.5 | 140.8±35.7 |
Data are presented as mean±SD, unless otherwise stated. BMI: body mass index; CCI: Charlson comorbidity index; FEV1: forced expiratory volume in one second; Pimax: maximum inspiratory pressure; Pemax: maximum expiratory pressure.
Thirty-six Pimax and 29 Pemax equations were tested (Fig. 1). Nine equations could not be tested either because some variables were not collected (e.g., waist circumference and vital capacity) or due to lack of information provided by authors (e.g., constant of the equation).
 — (a) maximum inspiratory pressure in women; (b) maximum inspiratory pressure in men; (2) — (a) maximum expiratory pressure in women; (b) maximum expiratory pressure in men. *p>0.05.")
The Pimax predicted values were significantly different from the real values obtained (p<0.05), except for the equations for men developed by Enright et al. (1995),5 Hautmann et al. (2000)6 and Sachs et al. (2009),7 and for women developed by Neder et al. (1999).8 Values obtained with these equations were amongst the ones with higher correlations (rs=0.32–0.47) and lower bias (0.19–4.06) with the actual data (Fig. 1 and supplementary material – Appendix A).
Twelve equations underestimated the real values and 4 equations overestimated the real values for men. The same pattern was found for women, with 15 equations underestimating and 3 equations overestimating the real values.
Regarding Pemax, all equations showed significant differences between real and predicted values (p<0.001), with most equations (n=10) underestimating the real values for both genders (Fig. 1).
LLN of Pimax resulted in a cut-off of 43.7cmH2O for women and 50cmH2O for men. The predicted values from all equations were above the LLN, hence not detecting inspiratory muscle weakness according to the LLN.
This study showed that all equations performed poorly, with none of the equations being suitable for detecting people below the LLN.
Nevertheless, of all equations for Pimax, 4 showed no significant differences between predicted and real values: 3 for men5–7 and 1 for women.8 Regarding men, the best agreement was found for the equation developed by Sachs et al.7 This might be explained by the similar equipment and protocol used (e.g., handling of subjects). In fact, almost half of the equations were developed with a lack of compliance with the guidelines,2 which might explain the disagreement with the real values in this study. Additionally, intrinsic factors such as age, gender and ethnicity disparities across the reported studies and this one may have also contributed to the equations’ lack of suitability.
None of the equations were able to detect people below the LLN, which is of most importance to identify people with respiratory muscle weakness.9 The LLN established for Pimax in this study, 43.7cmH2O for women and 50 cmH2O for men, can now be used in clinical practice and are similar to the cut-offs previously proposed.9
A recent study showed that Black and Hyatt, Bruschi et al. and Neder et al. equations were the most accurate to detect muscle weakness,10 and these equations were amongst the ones included in the recent guideline.1 However, in our study, only the equation from Neder et al. showed good reliability and validity, highlighting the importance of choosing carefully when using predictive equations and reference values from distinct populations.
As no Pemax equation was suitable for this population and expiratory muscle weakness is also important to detect,1 no recommendation can be made at this point and future studies should develop new equations.
This study has some limitations that need to be acknowledged. Due to our unbalanced sample (i.e., inequalities in gender and in the distribution of age decades), it was not possible to develop equations for Pimax or Pemax. Although studies of predictive equations have been published with small sample sizes and no power calculation,11 a balanced and powered sample is imperative for developing reliable and appropriate regression models and reference values.12 Some necessary variables were not collected, which hindered the analysis of 14 equations but those are the variables which are the most difficult to implement across distinct settings (e.g., vital capacity, through plethysmography), leading to a limited use in daily clinical practice. Moreover, the absence of healthy individuals below 40 years old impaired the generalisation of conclusions for younger adults. Testing the available equations or the development of new ones in a younger sample of healthy people is therefore recommended.
No equation was found to be suitable for the Portuguese population, thus future studies should attempt to develop new Pimax and Pemax equations and reference values with powered and balanced samples. In the absence of specific equations, the ones developed by Sachs et al. and Neder et al. are the most appropriate to be used. Our study can be replicated in countries where no specific predictive equations are available to improve accuracy of respiratory muscle weakness interpretation.
Conflict of interestThe authors declare no conflicts of interest.
This work was funded by Programa Operacional de Competitividade e Internacionalização – POCI, through Fundo Europeu de Desenvolvimento Regional – FEDER (POCI-01-0145-FEDER-007628 and POCI-01-0145-FEDER-028806), Fundação para a Ciência e Tecnologia (PTDC/DTP-PIC/2284/2014 and PTDC/SAU-SER/28806/2017) and under the project UIDB/04501/2020.
This work has been presented as a Poster Discussion in the European Respiratory Society International Congress 2019.
The following are supplementary material to this article:


