


Critically-ill elderly ICU patients with COVID-19 have poor outcomes. We aimed to compare the rates of in-hospital mortality between non-elderly and elderly critically-ill COVID-19 ventilated patients, as well as to analyze the characteristics, secondary outcomes and independent risk factors associated with in-hospital mortality of elderly ventilated patients.
Patients and MethodsWe conducted a multicentre, observational cohort study including consecutive critically-ill patients admitted to 55 Spanish ICUs due to severe COVID-19 requiring mechanical ventilation (non-invasive respiratory support [NIRS; include non-invasive mechanical ventilation and high-flow nasal cannula] and invasive mechanical ventilation [IMV]) between February 2020 and October 2021.
ResultsOut of 5,090 critically-ill ventilated patients, 1,525 (27%) were aged ≥70 years (554 [36%] received NIRS and 971 [64%] received IMV. In the elderly group, median age was 74 years (interquartile range 72–77) and 68% were male. Overall in-hospital mortality was 31% (23% in patients <70 years and 50% in those ≥70 years; p<0.001). In-hospital mortality in the group ≥70 years significantly varied according to the modality of ventilation (40% in NIRS vs. 55% in IMV group; p<0.001). Factors independently associated with in-hospital mortality in elderly ventilated patients were age (sHR 1.07 [95%CI 1.05–1.10], p<0.001); previous admission within the last 30 days (sHR 1.40 [95%CI 1.04–1.89], p = 0.027); chronic heart disease (sHR 1.21 [95%CI 1.01–1.44], p = 0.041); chronic renal failure (sHR 1.43 [95%CI 1.12- 1.82], p = 0.005); platelet count (sHR 0.98 [95% CI 0.98–0.99], p<0.001); IMV at ICU admission (sHR 1.41 [95% CI 1.16- 1.73], p<0.001); and systemic steroids (sHR 0.61 [95%CI 0.48- 0.77], p<0.001).
ConclusionsAmongst critically-ill COVID-19 ventilated patients, those aged ≥70 years presented significantly higher rates of in-hospital mortality than younger patients. Increasing age, previous admission within the last 30 days, chronic heart disease, chronic renal failure, platelet count, IMV at ICU admission and systemic steroids (protective) all comprised independent factors for in-hospital mortality in elderly patients
By 5 September 2022, the COVID-19 pandemic saw 615 million confirmed cases and had claimed the lives of more than 6.5 million people globally.1 Underlying medical conditions and older age have been identified as strong predictors of death in patients with COVID-19 in general population.2 Analyzing data from 540,667 adults hospitalized with COVID-19, Kompaniyets et al. reported that underlying medical conditions such as obesity, diabetes with complications, chronic cardiovascular disease and chronic lung disease had the strongest association with death especially in elderly patients (≥70 years old) in overall population.3 The higher likelihood of presenting poor outcomes amongst elderly patients also appears to apply to those with severe COVID-19 requiring intensive care unit (ICU) admission.4,5 A recent systematic review and meta-analysis pooling data from 57,000 COVID-19 patients that required mechanical ventilation, reported an overall case-fatality rate of 45% (95% CI: 39–52%), which increased according to age group, being 84% (95% Confidential Interval (CI): 83.3–85.4%) in patients over 80 years.6 A multicenter cohort study from Japan reported that the mortality rates in patients received invasive mechanical ventilation (IMV) were 8.6%, 20.7%, 34.9%, 49.7% and 83.3% for patients in the age group 50, 60, 70, 80, and 90 years old, respectively. The multivariable analysis showed that the odds ratio of death was 7 times higher in patients aged 70 years old (OR, 6.92. 95% CI 4.23 to 11.31; p < 0.01), 13 times higher in patients aged 80 years old (OR, 13.17, 95% CI 7.21 to 24.06; p < 0.01), and 92 times higher in patients aged 90 years old (OR, 92.63, 95% CI 16.66 to 514.98; p < 0.01), compared with those aged <60 years.7 However, available evidence on critically-ill elderly patients with COVID-19 admitted to the ICU needing mechanical ventilation (non-invasive and invasive ventilation) is widely variable across countries and some relevant aspects regarding management and prognosis remain poorly known.
We hypothesized that crude mortality of very elderly mechanically-ventilated COVID-19 patients was higher and the risk factors different as compared to those of younger patients. Thus, we aimed to assess the clinical characteristics, therapy, management, complications and risk factors associated with mortality amongst critically ill elderly patients with COVID-19 who were admitted to ICU and received non-invasive respiratory support (NIRS) and/or IMV at hospital and ICU admission.
MethodsStudy design and patientsWe retrospectively analysed patients from the CIBERESUCICOVID study (NCT04457505),8,9 which had prospectively included patients aged ≥18 years with laboratory-confirmed SARS-CoV-2 infection from across 55 Spanish hospitals between 5 February 2020 and 7 October 2021 (participating sites are listed in the S-Table 1 in the Supplementary Material). All consecutive patients admitted to ICU were enrolled if the reason for admission was COVID-19. Exclusion criteria for patients included: (1) unconfirmed SARS-CoV-2 infection; (2) lack of data at baseline or hospital discharge; (3) lack of information about age; (4) lack of data about ventilation requirement or conventional oxygen therapy at hospital and ICU admission. The study received first approval by Hospital Clínic of Barcelona, Spain IRB (Comité Ètic d'Investigació Clínica, registry number HCB/2020/0370), and ulterior approval by local IRBs in the rest of participating hospitals. Either patients or their relatives provided informed consent. De-identified data were collected and stored in Research Electronic Data Capture (REDCap). Trained local researchers incorporated data from patients’ medical records into a separate database. Prior to statistical analyses, three independent and experienced data collectors trained in critical care (PC, AM, CS) reviewed the data; in cases of query, site investigators were contacted. Missing analyses were performed, and site investigators were approached to obtain as much reliable and complete data as possible. Results are reported in accordance with the Strengthening the Reporting of Observational Studies in Epidemiology (STROBE) guidelines.10
Data collectionWe recorded data on demographics, comorbidities, illness severity and organ damage (APACHE-II and SOFA scores), and previous treatment. Standard laboratory and clinical data were collected at hospital and ICU admission. Data on pharmacologic treatments and non-pharmacological interventions during index admission were collected. Main complications during hospital stay, including pulmonary complications (acute respiratory distress syndrome-ARDS); septic shock, bacteraemia, hyperglycaemia, nosocomial infections, thromboembolic events, gastrointestinal bleeding, acute kidney injury and acute hepatic failure were also collected.
Primary and secondary outcomesThe primary outcome was in-hospital mortality. Secondary outcomes included length of ventilation, recovery from ICU admission, ICU-mortality, 90-day mortality, lengths of ICU and hospital stay.
DefinitionsPatients were divided in two groups: 1.- Patients that received non-invasive respiratory support (NIRS) which included patients that received non-invasive mechanical ventilation (NIMV) and/or high-flow nasal cannula (HFNC) at the ICU admission, and 2.- Patients that received invasive mechanical ventilation (IMV) at the ICU admission. Patients who received NIRS before but needed intubation at the ICU admission were included in the IMV group. The start dates of the first respiratory support with NIRS or IMV were recorded whether it was provided in the general ward or in the ICU. Length of ICU and hospital stay was calculated from ICU admission and hospitalization, respectively. Nosocomial pneumonia was defined according to international guidelines.11 Hyperglycaemia was defined as a consistent blood glucose level above 126 mg/dL. Hemorrhage referred to any type of clinically significant bleeding. Further details are reported in a previous publication.12 Driving pressure was defined as plateau pressure minus plateau pressure (PEEP). Static compliance of the respiratory system was calculated as tidal volume/ (plateau pressure − PEEP). Ventilatory ratio was calculated as follows: (minute ventilation × PaCO2) − (PBW × 100 × 37.5).
Statistical analysisWe report the number and percentage of patients as categorical variables, and the median (first quartile [Q1]; third quartile [Q3]) as continuous variables. Categorical variables were compared using the chi-squared test or Fisher's exact test, whereas continuous variables were compared using the nonparametric Mann-Whitney U test.
First, we compared patients according to age group (<70 years and ≥70 years). Then, a comparison of patients according to study group (i.e., NIRS and IMV) in patients aged ≥70 years was performed. We also explored the clinical characteristics and outcomes in the subgroup of patients aged 80 years and older.
To describe in-hospital mortality, we utilized a competing risk model,13 considering recovery (i.e., discharge from hospital) as competing risk for mortality. First, we obtained the estimate of the cumulative incidence function (CIF) for the marginal probability of in-hospital mortality and recovery. Gray's test was used to compare equality of cumulative incidence curves across groups.14 To explore the risk factors associated with in-hospital mortality, a Fine-Gray competing risks model stratified on the center variable was used. A list of candidate predictors was established a priori based on previous findings and clinical constraints: age, sex, previous 30 days admission, chronic heart disease, chronic lung disease, chronic renal failure, confusion; the following parameters at ICU admission: APACHE-II score, SOFA score, PaO2/FiO2 ratio, pH, lymphocyte count, platelet count, d-dimers, C-reactive protein, serum creatinine, ferritin, septic shock, MV, and vasopressor treatment, continuous neuromuscular blockers, corticosteroids administered during ICU admission, and COVID-19 wave. Single collinearity was evaluated using the Pearson correlation (r) and multicollinearity was examined by means of the variance inflation factor (VIF). Several variables were excluded from the analysis due to collinearity (see Supplementary Material). Sub-distribution hazard ratios (sHRs) and their 95% confidence intervals (CIs) were calculated. The proportional hazards assumption was checked by an evaluation of the Schoenfeld residuals, as shown in Supplementary S-Figure 1. Patients who were transferred to another hospital were censored in the survival analyses. We used the multiple imputation method15 for missing data in the multivariable analysis (S-Table 1).
The level of significance was set at 0.05 (two-tailed). All analyses were performed using IBM SPSS version 26.0 (IBM Corp., Armonk, NY, USA) and R version 4.1.1 (R Foundation for Statistical Computing, Vienna, Austria).
ResultsDescription of the cohort5090 patients requiring ventilation due to COVID-19 were enrolled in the CIBERESUCICOVID dataset (55 Spanish ICUs) from February 2020 to October 2021. The comparison of characteristics and outcomes between patients aged <70 years and those aged ≥70 years are summarized in S-Tables 2-4 and S-Figures 2-3. Remarkably, 3565 (63%) were aged <70 years (1529 [43%] received NIRS and 2036 [57%] received IMV) and 1525 (27%) were aged ≥70 years (554 [36%] received NIRS and 971 [64%] received IMV) (Fig. 1). Overall in-hospital mortality was 31% (23% in patients <70 years and 50% in those ≥70 years; p<0.001).
Mechanical ventilation modality in patients ≥70 years
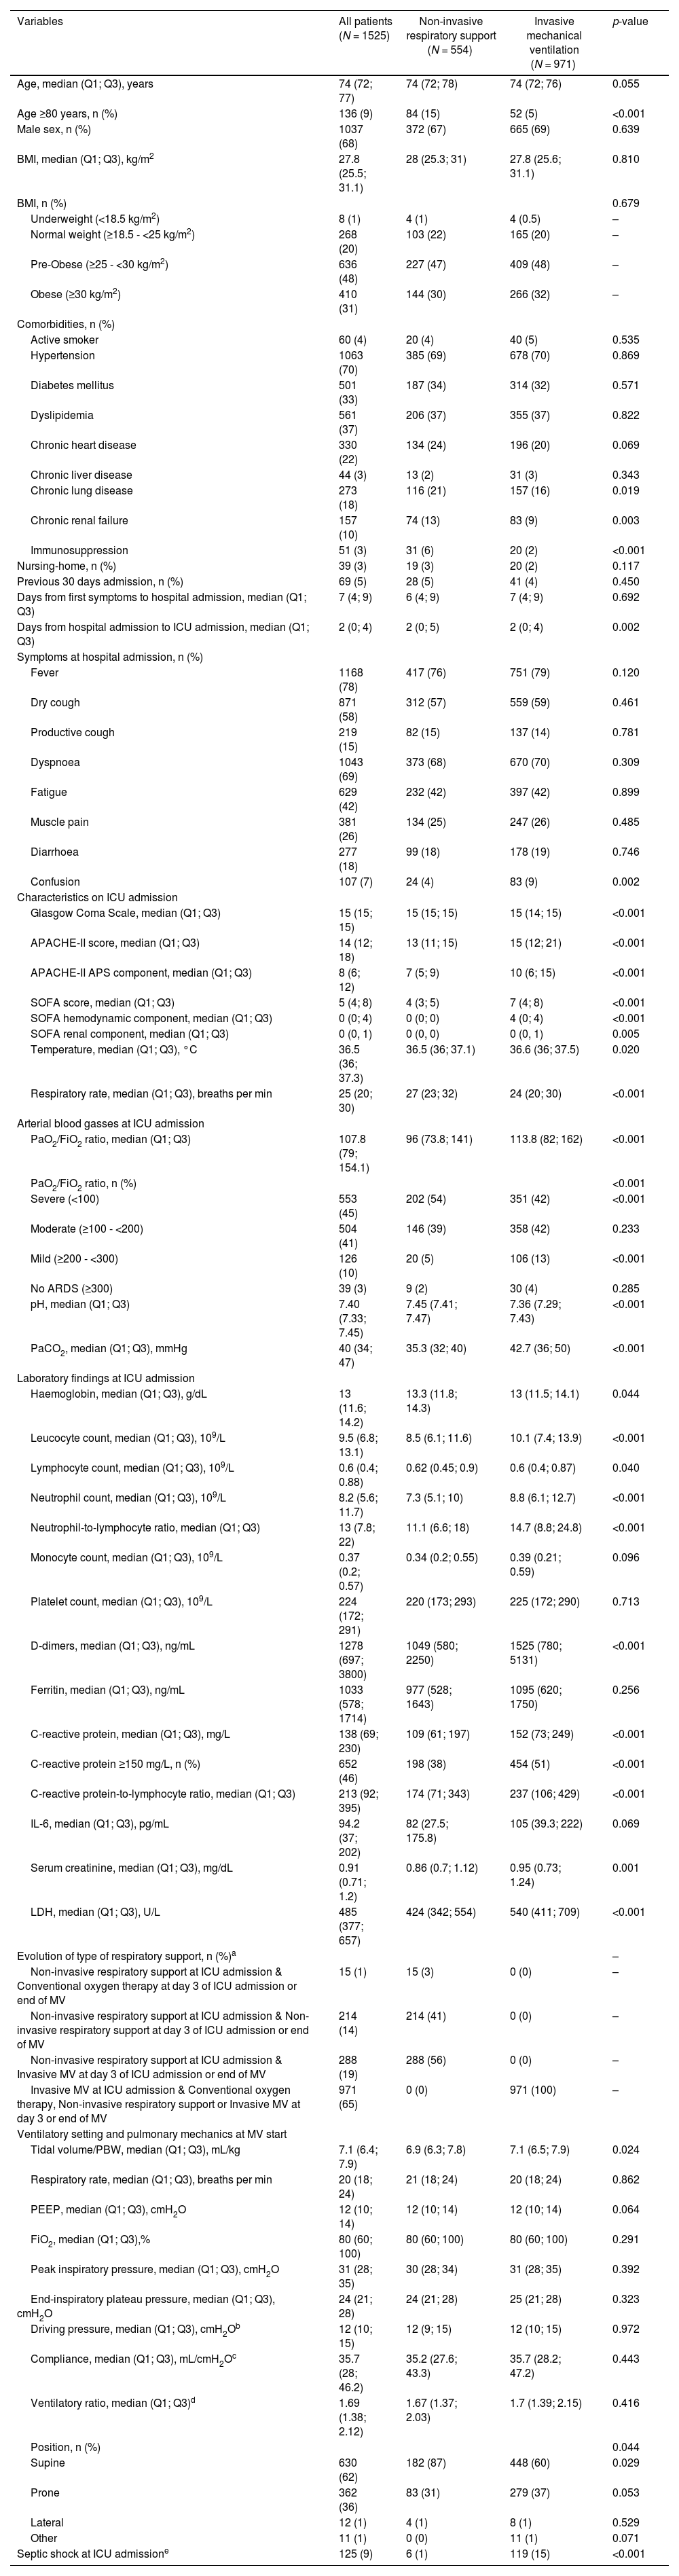
The overall baseline characteristics and ventilation features in patients aged ≥70 years and the comparison between the group receiving NIRS and IMV are shown in Table 1. Notably, patients received NIRS presented higher proportion of patients aged ≥80 years old, have higher rate of chronic lung disease, chronic renal disease and immunosuppression that patients received IMV. They also presented longer day from hospital admission to ICU admission, lower rate of septic shock, lower levels of CRP, d-dimer, neutrophils-lymphocytes ratio and lower SOFA score compared with patients who received IMV.
Demographic and clinical characteristics of the study population ≥70 years old by type of respiratory support.a
| Variables | All patients (N = 1525) | Non-invasive respiratory support (N = 554) | Invasive mechanical ventilation (N = 971) | p-value |
|---|---|---|---|---|
| Age, median (Q1; Q3), years | 74 (72; 77) | 74 (72; 78) | 74 (72; 76) | 0.055 |
| Age ≥80 years, n (%) | 136 (9) | 84 (15) | 52 (5) | <0.001 |
| Male sex, n (%) | 1037 (68) | 372 (67) | 665 (69) | 0.639 |
| BMI, median (Q1; Q3), kg/m2 | 27.8 (25.5; 31.1) | 28 (25.3; 31) | 27.8 (25.6; 31.1) | 0.810 |
| BMI, n (%) | 0.679 | |||
| Underweight (<18.5 kg/m2) | 8 (1) | 4 (1) | 4 (0.5) | – |
| Normal weight (≥18.5 - <25 kg/m2) | 268 (20) | 103 (22) | 165 (20) | – |
| Pre-Obese (≥25 - <30 kg/m2) | 636 (48) | 227 (47) | 409 (48) | – |
| Obese (≥30 kg/m2) | 410 (31) | 144 (30) | 266 (32) | – |
| Comorbidities, n (%) | ||||
| Active smoker | 60 (4) | 20 (4) | 40 (5) | 0.535 |
| Hypertension | 1063 (70) | 385 (69) | 678 (70) | 0.869 |
| Diabetes mellitus | 501 (33) | 187 (34) | 314 (32) | 0.571 |
| Dyslipidemia | 561 (37) | 206 (37) | 355 (37) | 0.822 |
| Chronic heart disease | 330 (22) | 134 (24) | 196 (20) | 0.069 |
| Chronic liver disease | 44 (3) | 13 (2) | 31 (3) | 0.343 |
| Chronic lung disease | 273 (18) | 116 (21) | 157 (16) | 0.019 |
| Chronic renal failure | 157 (10) | 74 (13) | 83 (9) | 0.003 |
| Immunosuppression | 51 (3) | 31 (6) | 20 (2) | <0.001 |
| Nursing-home, n (%) | 39 (3) | 19 (3) | 20 (2) | 0.117 |
| Previous 30 days admission, n (%) | 69 (5) | 28 (5) | 41 (4) | 0.450 |
| Days from first symptoms to hospital admission, median (Q1; Q3) | 7 (4; 9) | 6 (4; 9) | 7 (4; 9) | 0.692 |
| Days from hospital admission to ICU admission, median (Q1; Q3) | 2 (0; 4) | 2 (0; 5) | 2 (0; 4) | 0.002 |
| Symptoms at hospital admission, n (%) | ||||
| Fever | 1168 (78) | 417 (76) | 751 (79) | 0.120 |
| Dry cough | 871 (58) | 312 (57) | 559 (59) | 0.461 |
| Productive cough | 219 (15) | 82 (15) | 137 (14) | 0.781 |
| Dyspnoea | 1043 (69) | 373 (68) | 670 (70) | 0.309 |
| Fatigue | 629 (42) | 232 (42) | 397 (42) | 0.899 |
| Muscle pain | 381 (26) | 134 (25) | 247 (26) | 0.485 |
| Diarrhoea | 277 (18) | 99 (18) | 178 (19) | 0.746 |
| Confusion | 107 (7) | 24 (4) | 83 (9) | 0.002 |
| Characteristics on ICU admission | ||||
| Glasgow Coma Scale, median (Q1; Q3) | 15 (15; 15) | 15 (15; 15) | 15 (14; 15) | <0.001 |
| APACHE-II score, median (Q1; Q3) | 14 (12; 18) | 13 (11; 15) | 15 (12; 21) | <0.001 |
| APACHE-II APS component, median (Q1; Q3) | 8 (6; 12) | 7 (5; 9) | 10 (6; 15) | <0.001 |
| SOFA score, median (Q1; Q3) | 5 (4; 8) | 4 (3; 5) | 7 (4; 8) | <0.001 |
| SOFA hemodynamic component, median (Q1; Q3) | 0 (0; 4) | 0 (0; 0) | 4 (0; 4) | <0.001 |
| SOFA renal component, median (Q1; Q3) | 0 (0, 1) | 0 (0, 0) | 0 (0, 1) | 0.005 |
| Temperature, median (Q1; Q3), °C | 36.5 (36; 37.3) | 36.5 (36; 37.1) | 36.6 (36; 37.5) | 0.020 |
| Respiratory rate, median (Q1; Q3), breaths per min | 25 (20; 30) | 27 (23; 32) | 24 (20; 30) | <0.001 |
| Arterial blood gasses at ICU admission | ||||
| PaO2/FiO2 ratio, median (Q1; Q3) | 107.8 (79; 154.1) | 96 (73.8; 141) | 113.8 (82; 162) | <0.001 |
| PaO2/FiO2 ratio, n (%) | <0.001 | |||
| Severe (<100) | 553 (45) | 202 (54) | 351 (42) | <0.001 |
| Moderate (≥100 - <200) | 504 (41) | 146 (39) | 358 (42) | 0.233 |
| Mild (≥200 - <300) | 126 (10) | 20 (5) | 106 (13) | <0.001 |
| No ARDS (≥300) | 39 (3) | 9 (2) | 30 (4) | 0.285 |
| pH, median (Q1; Q3) | 7.40 (7.33; 7.45) | 7.45 (7.41; 7.47) | 7.36 (7.29; 7.43) | <0.001 |
| PaCO2, median (Q1; Q3), mmHg | 40 (34; 47) | 35.3 (32; 40) | 42.7 (36; 50) | <0.001 |
| Laboratory findings at ICU admission | ||||
| Haemoglobin, median (Q1; Q3), g/dL | 13 (11.6; 14.2) | 13.3 (11.8; 14.3) | 13 (11.5; 14.1) | 0.044 |
| Leucocyte count, median (Q1; Q3), 109/L | 9.5 (6.8; 13.1) | 8.5 (6.1; 11.6) | 10.1 (7.4; 13.9) | <0.001 |
| Lymphocyte count, median (Q1; Q3), 109/L | 0.6 (0.4; 0.88) | 0.62 (0.45; 0.9) | 0.6 (0.4; 0.87) | 0.040 |
| Neutrophil count, median (Q1; Q3), 109/L | 8.2 (5.6; 11.7) | 7.3 (5.1; 10) | 8.8 (6.1; 12.7) | <0.001 |
| Neutrophil-to-lymphocyte ratio, median (Q1; Q3) | 13 (7.8; 22) | 11.1 (6.6; 18) | 14.7 (8.8; 24.8) | <0.001 |
| Monocyte count, median (Q1; Q3), 109/L | 0.37 (0.2; 0.57) | 0.34 (0.2; 0.55) | 0.39 (0.21; 0.59) | 0.096 |
| Platelet count, median (Q1; Q3), 109/L | 224 (172; 291) | 220 (173; 293) | 225 (172; 290) | 0.713 |
| D-dimers, median (Q1; Q3), ng/mL | 1278 (697; 3800) | 1049 (580; 2250) | 1525 (780; 5131) | <0.001 |
| Ferritin, median (Q1; Q3), ng/mL | 1033 (578; 1714) | 977 (528; 1643) | 1095 (620; 1750) | 0.256 |
| C-reactive protein, median (Q1; Q3), mg/L | 138 (69; 230) | 109 (61; 197) | 152 (73; 249) | <0.001 |
| C-reactive protein ≥150 mg/L, n (%) | 652 (46) | 198 (38) | 454 (51) | <0.001 |
| C-reactive protein-to-lymphocyte ratio, median (Q1; Q3) | 213 (92; 395) | 174 (71; 343) | 237 (106; 429) | <0.001 |
| IL-6, median (Q1; Q3), pg/mL | 94.2 (37; 202) | 82 (27.5; 175.8) | 105 (39.3; 222) | 0.069 |
| Serum creatinine, median (Q1; Q3), mg/dL | 0.91 (0.71; 1.2) | 0.86 (0.7; 1.12) | 0.95 (0.73; 1.24) | 0.001 |
| LDH, median (Q1; Q3), U/L | 485 (377; 657) | 424 (342; 554) | 540 (411; 709) | <0.001 |
| Evolution of type of respiratory support, n (%)a | – | |||
| Non-invasive respiratory support at ICU admission & Conventional oxygen therapy at day 3 of ICU admission or end of MV | 15 (1) | 15 (3) | 0 (0) | – |
| Non-invasive respiratory support at ICU admission & Non-invasive respiratory support at day 3 of ICU admission or end of MV | 214 (14) | 214 (41) | 0 (0) | – |
| Non-invasive respiratory support at ICU admission & Invasive MV at day 3 of ICU admission or end of MV | 288 (19) | 288 (56) | 0 (0) | – |
| Invasive MV at ICU admission & Conventional oxygen therapy, Non-invasive respiratory support or Invasive MV at day 3 or end of MV | 971 (65) | 0 (0) | 971 (100) | – |
| Ventilatory setting and pulmonary mechanics at MV start | ||||
| Tidal volume/PBW, median (Q1; Q3), mL/kg | 7.1 (6.4; 7.9) | 6.9 (6.3; 7.8) | 7.1 (6.5; 7.9) | 0.024 |
| Respiratory rate, median (Q1; Q3), breaths per min | 20 (18; 24) | 21 (18; 24) | 20 (18; 24) | 0.862 |
| PEEP, median (Q1; Q3), cmH2O | 12 (10; 14) | 12 (10; 14) | 12 (10; 14) | 0.064 |
| FiO2, median (Q1; Q3),% | 80 (60; 100) | 80 (60; 100) | 80 (60; 100) | 0.291 |
| Peak inspiratory pressure, median (Q1; Q3), cmH2O | 31 (28; 35) | 30 (28; 34) | 31 (28; 35) | 0.392 |
| End-inspiratory plateau pressure, median (Q1; Q3), cmH2O | 24 (21; 28) | 24 (21; 28) | 25 (21; 28) | 0.323 |
| Driving pressure, median (Q1; Q3), cmH2Ob | 12 (10; 15) | 12 (9; 15) | 12 (10; 15) | 0.972 |
| Compliance, median (Q1; Q3), mL/cmH2Oc | 35.7 (28; 46.2) | 35.2 (27.6; 43.3) | 35.7 (28.2; 47.2) | 0.443 |
| Ventilatory ratio, median (Q1; Q3)d | 1.69 (1.38; 2.12) | 1.67 (1.37; 2.03) | 1.7 (1.39; 2.15) | 0.416 |
| Position, n (%) | 0.044 | |||
| Supine | 630 (62) | 182 (87) | 448 (60) | 0.029 |
| Prone | 362 (36) | 83 (31) | 279 (37) | 0.053 |
| Lateral | 12 (1) | 4 (1) | 8 (1) | 0.529 |
| Other | 11 (1) | 0 (0) | 11 (1) | 0.071 |
| Septic shock at ICU admissione | 125 (9) | 6 (1) | 119 (15) | <0.001 |
Abbreviations: ICU indicates intensive care unit; Q1, first quartile; Q3, third quartile; BMI, body mass index; APACHE, acute physiology and chronic health evaluation; APS, acute physiology score; SOFA, sequential organ failure assessment; PaO2, partial pressure of arterial oxygen; FiO2, fraction of inspired oxygen; LDH, lactate dehydrogenase; MV, mechanical ventilation. Percentages calculated on non-missing data. p-values marked in bold indicate numbers that are statistically significant on the 95% confidence limit.
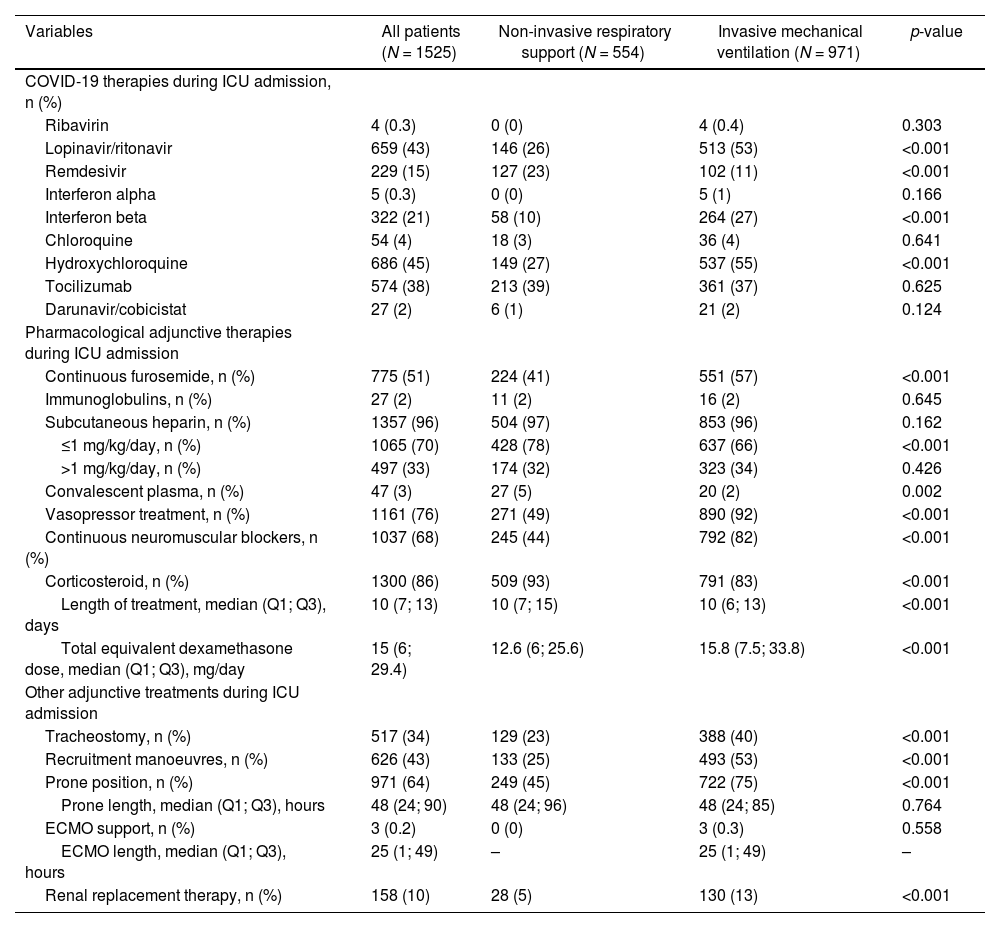
Main interventions and treatments of the study population ≥70 years old by type of respiratory support.a
Abbreviations: ICU indicates intensive care unit; Q1, first quartile; Q3, third quartile; ECMO, extracorporeal membrane oxygenation. Percentages calculated on non-missing data. p-values marked in bold indicate numbers that are statistically significant on the 95% confidence limit.
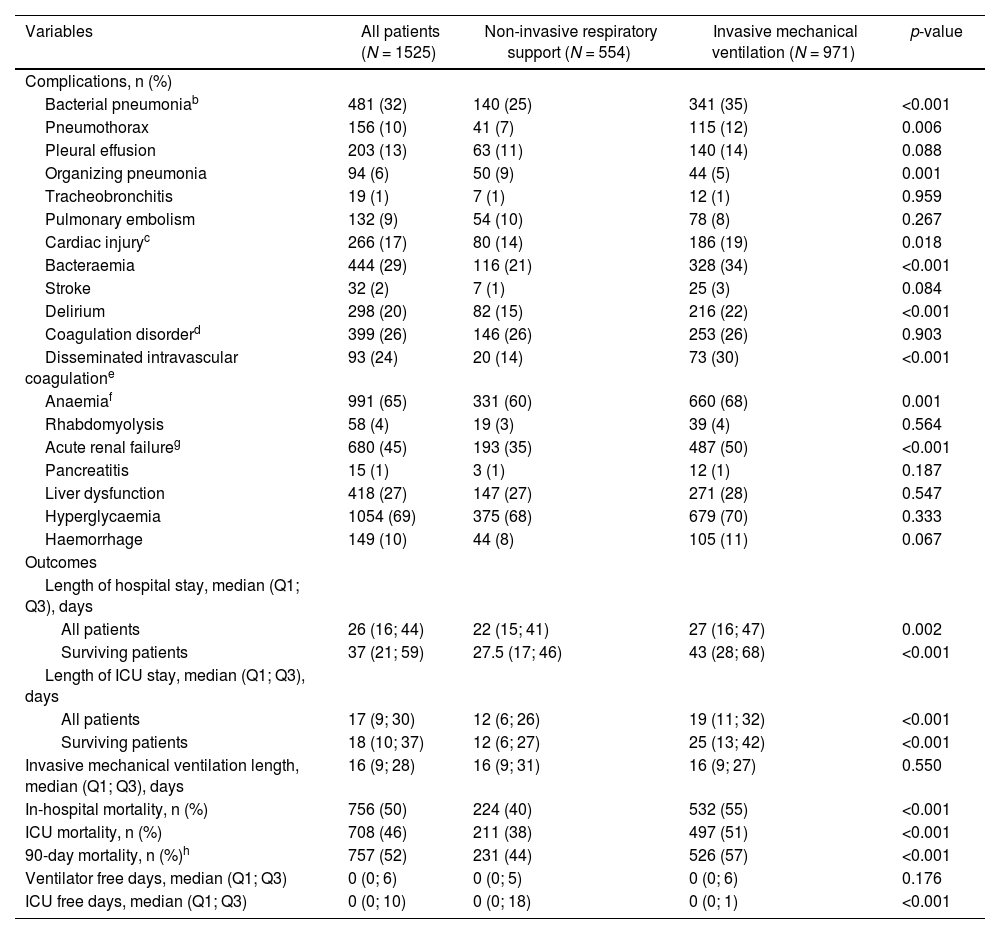
Table 3 shows the complications and outcomes according to the type of MV in patients ≥70 years. Medians for ICU and hospital length of stay were 17 (9; 30) and 26 (16; 44) days for NIRS and IMV respectively. The mortality rate of patients that failed to NIRS and required IMV was 52% (149/288), whereas the mortality rate of patients that only required NIRS was 26% (55/214). ICU, in-hospital and 90-day mortality rates were 46%, 50% and 52% respectively, in all three cases being significantly higher in the IMV subgroup. The main cause of in-hospital mortality in IMV group was multi-organic failure (41%), while, respiratory failure was the main cause of death in NIRS group (51%). The CIF curves for in-hospital mortality and recovery are depicted in Fig. 2A. Furthermore, the CIF curves show that patients with IMV had a higher likelihood of death (p<0.001) than patients with NIRS, and patients with NIRS had a higher likelihood of recovery (p<0.001) than patients with IMV (Fig. 2B).
Complications and outcome variables of the study population ≥70 years old by type of respiratory support.a
| Variables | All patients (N = 1525) | Non-invasive respiratory support (N = 554) | Invasive mechanical ventilation (N = 971) | p-value |
|---|---|---|---|---|
| Complications, n (%) | ||||
| Bacterial pneumoniab | 481 (32) | 140 (25) | 341 (35) | <0.001 |
| Pneumothorax | 156 (10) | 41 (7) | 115 (12) | 0.006 |
| Pleural effusion | 203 (13) | 63 (11) | 140 (14) | 0.088 |
| Organizing pneumonia | 94 (6) | 50 (9) | 44 (5) | 0.001 |
| Tracheobronchitis | 19 (1) | 7 (1) | 12 (1) | 0.959 |
| Pulmonary embolism | 132 (9) | 54 (10) | 78 (8) | 0.267 |
| Cardiac injuryc | 266 (17) | 80 (14) | 186 (19) | 0.018 |
| Bacteraemia | 444 (29) | 116 (21) | 328 (34) | <0.001 |
| Stroke | 32 (2) | 7 (1) | 25 (3) | 0.084 |
| Delirium | 298 (20) | 82 (15) | 216 (22) | <0.001 |
| Coagulation disorderd | 399 (26) | 146 (26) | 253 (26) | 0.903 |
| Disseminated intravascular coagulatione | 93 (24) | 20 (14) | 73 (30) | <0.001 |
| Anaemiaf | 991 (65) | 331 (60) | 660 (68) | 0.001 |
| Rhabdomyolysis | 58 (4) | 19 (3) | 39 (4) | 0.564 |
| Acute renal failureg | 680 (45) | 193 (35) | 487 (50) | <0.001 |
| Pancreatitis | 15 (1) | 3 (1) | 12 (1) | 0.187 |
| Liver dysfunction | 418 (27) | 147 (27) | 271 (28) | 0.547 |
| Hyperglycaemia | 1054 (69) | 375 (68) | 679 (70) | 0.333 |
| Haemorrhage | 149 (10) | 44 (8) | 105 (11) | 0.067 |
| Outcomes | ||||
| Length of hospital stay, median (Q1; Q3), days | ||||
| All patients | 26 (16; 44) | 22 (15; 41) | 27 (16; 47) | 0.002 |
| Surviving patients | 37 (21; 59) | 27.5 (17; 46) | 43 (28; 68) | <0.001 |
| Length of ICU stay, median (Q1; Q3), days | ||||
| All patients | 17 (9; 30) | 12 (6; 26) | 19 (11; 32) | <0.001 |
| Surviving patients | 18 (10; 37) | 12 (6; 27) | 25 (13; 42) | <0.001 |
| Invasive mechanical ventilation length, median (Q1; Q3), days | 16 (9; 28) | 16 (9; 31) | 16 (9; 27) | 0.550 |
| In-hospital mortality, n (%) | 756 (50) | 224 (40) | 532 (55) | <0.001 |
| ICU mortality, n (%) | 708 (46) | 211 (38) | 497 (51) | <0.001 |
| 90-day mortality, n (%)h | 757 (52) | 231 (44) | 526 (57) | <0.001 |
| Ventilator free days, median (Q1; Q3) | 0 (0; 6) | 0 (0; 5) | 0 (0; 6) | 0.176 |
| ICU free days, median (Q1; Q3) | 0 (0; 10) | 0 (0; 18) | 0 (0; 1) | <0.001 |
Abbreviations: ICU indicates intensive care unit; Q1, first quartile; Q3, third quartile. Percentages calculated on non-missing data. p-values marked in bold indicate numbers that are statistically significant on the 95% confidence limit.
Patients who received non-invasive respiratory support but needed intubation were included in the invasive mechanical ventilation group.
Clinically or radiologically diagnosed bacterial pneumonia managed with antimicrobials. Bacteriological confirmation was not required.
Cardiac injury include cardiac arrest, myocardial infarction, endocarditis, myocarditis/pericarditis, cardiomyopathy, heart failure and cardiac ischemia.
Abnormal coagulation was identified by abnormal prothrombin time or activated partial thromboplastin time.
Disseminated intravascular coagulation was defined by thrombocytopenia, prolonged prothrombin time, low fibrinogen, elevated d-dimer and thrombotic microangiopathy.
 (A) and according to type of respiratory support group (B).")
The characteristics of patients aged ≥70 years that survived the index admission vs. those of patients who died are shown in S-Tables 5 to 7. In-hospital mortality significantly increased per 5-year blocks age groups (p<0.001) (Fig. 3A). Meanwhile, there was a decreasing trend in in-hospital mortality across COVID-19 waves (p = 0.006) (Fig. 3B).
Sub-analysis of patients ≥80 years, and during the five COVID-19 pandemic waves (B). Study population ≥70 years old (N = 1525).")
There were 136 patients ≥80 years old, of these 84 (62%) patients received NIRS (28 with initial NIRS, required IMV during hospitalization) and 52 (38%) received IMV. Median APACHE II and SOFA scores were 14 (12; 17) and 4 (4; 7), respectively (S-Table 8). Interestingly, prone position was implemented in 35% of patients and renal replacement therapy was used in 7% of patients (4% in NIRS and 12% in IMV patients; p = 0.085) (S-Table 9). The mortality rate of patients that failed to NIRS and required IMV was 61% (17/28), whereas the mortality rate of patients that only required NIRS was 55% (24/44). Remarkably, ICU, in-hospital and 90-day mortality rates were 51%, 61% and 65% respectively; and respiratory failure (52% in the NIRS group vs. 43% in the IMV group) and multi-organic failure (33% in the NIRS group vs. 24% in the IMV group) were the main causes of in-hospital mortality without differences between groups. Medians for ICU and hospital length of stay were 13 (7; 23) and 29 (17; 45) days, respectively (S-Table 10).
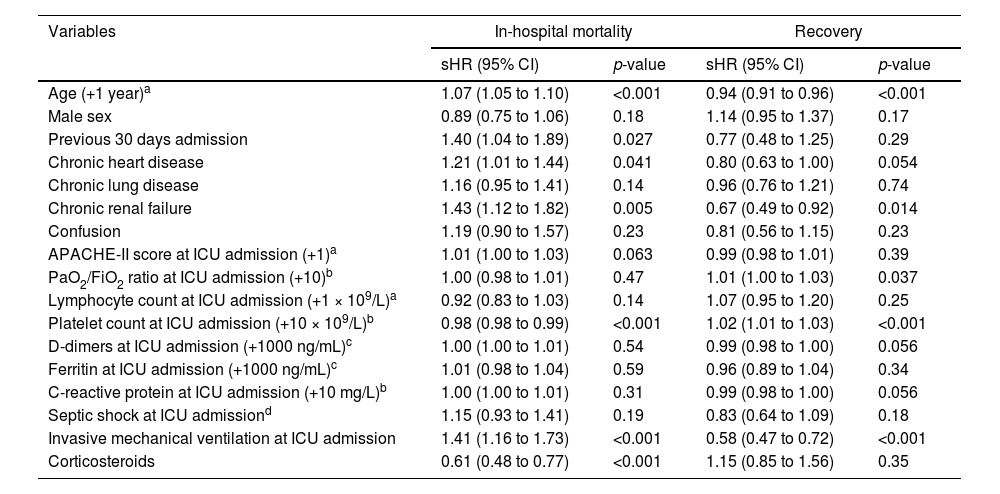
Predictive factors for in-hospital mortality and recovery in patients aged ≥70 yearsResults of the multivariable analysis are reported in Table 4. The following factors were associated with in-hospital mortality: age, previous admission within the last 30 days, chronic heart disease, chronic renal failure, platelet count, MV, and corticosteroids. Firstly, with every year increase in age, the risk of death increased with 7% (sHR 1.07, 95% CI 1.05 to 1.10), and the chances of recovery decreased with 6% (sHR 0.94, 95% CI 0.91 to 0.96). In other words, if in two patients all variables except for age are the same, the patient who is one year older has a 7% higher risk of dying. Furthermore, patients with previous admission within the last 30 days had a 40% increased risk of death (sHR 1.40, 95% CI 1.04 to 1.89). Moreover, patients with chronic heart disease had a 21% increase in risk of death (sHR 1.21, 95% CI 1.01 to 1.44), while patients with chronic renal failure had a 43% increase in risk of death (sHR 1.43, 95% CI 1.12 to 1.82), and 33% decrease in chances of recovery (sHR 0.67, 95% CI 0.49 to 0.92). In terms of arterial blood gasses, a ten-fold increase in APACHE-II score at ICU admission, the risk of death increased 1% (sHR 1.01, 95% CI 1.00 to 1.03). In terms of laboratory parameters, a ten-fold increase in platelet count at ICU admission was associated with a 2% decrease in risk of death (sHR 0.98, 95% CI 0.98 to 0.99), and a 2% increase in chances of recovery (sHR 1.02, 95% CI 1.01 to 1.03). Moreover, patients with IMV at ICU admission had a 41% increase in risk of death (sHR 1.41, 95% CI 1.16 to 1.73), and 42% decrease in chances of recovery (sHR 0.58, 95% CI 0.47 to 0.72). Finally, patients that used corticosteroids had a 39% decrease in the risk of death (sHR 0.61, 95% CI 0.48 to 0.77).
Multivariable model assessing predictors of in-hospital mortality and recovery of the study population ≥70 years old (N = 1525).
| Variables | In-hospital mortality | Recovery | ||
|---|---|---|---|---|
| sHR (95% CI) | p-value | sHR (95% CI) | p-value | |
| Age (+1 year)a | 1.07 (1.05 to 1.10) | <0.001 | 0.94 (0.91 to 0.96) | <0.001 |
| Male sex | 0.89 (0.75 to 1.06) | 0.18 | 1.14 (0.95 to 1.37) | 0.17 |
| Previous 30 days admission | 1.40 (1.04 to 1.89) | 0.027 | 0.77 (0.48 to 1.25) | 0.29 |
| Chronic heart disease | 1.21 (1.01 to 1.44) | 0.041 | 0.80 (0.63 to 1.00) | 0.054 |
| Chronic lung disease | 1.16 (0.95 to 1.41) | 0.14 | 0.96 (0.76 to 1.21) | 0.74 |
| Chronic renal failure | 1.43 (1.12 to 1.82) | 0.005 | 0.67 (0.49 to 0.92) | 0.014 |
| Confusion | 1.19 (0.90 to 1.57) | 0.23 | 0.81 (0.56 to 1.15) | 0.23 |
| APACHE-II score at ICU admission (+1)a | 1.01 (1.00 to 1.03) | 0.063 | 0.99 (0.98 to 1.01) | 0.39 |
| PaO2/FiO2 ratio at ICU admission (+10)b | 1.00 (0.98 to 1.01) | 0.47 | 1.01 (1.00 to 1.03) | 0.037 |
| Lymphocyte count at ICU admission (+1 × 10⁹/L)a | 0.92 (0.83 to 1.03) | 0.14 | 1.07 (0.95 to 1.20) | 0.25 |
| Platelet count at ICU admission (+10 × 109/L)b | 0.98 (0.98 to 0.99) | <0.001 | 1.02 (1.01 to 1.03) | <0.001 |
| D-dimers at ICU admission (+1000 ng/mL)c | 1.00 (1.00 to 1.01) | 0.54 | 0.99 (0.98 to 1.00) | 0.056 |
| Ferritin at ICU admission (+1000 ng/mL)c | 1.01 (0.98 to 1.04) | 0.59 | 0.96 (0.89 to 1.04) | 0.34 |
| C-reactive protein at ICU admission (+10 mg/L)b | 1.00 (1.00 to 1.01) | 0.31 | 0.99 (0.98 to 1.00) | 0.056 |
| Septic shock at ICU admissiond | 1.15 (0.93 to 1.41) | 0.19 | 0.83 (0.64 to 1.09) | 0.18 |
| Invasive mechanical ventilation at ICU admission | 1.41 (1.16 to 1.73) | <0.001 | 0.58 (0.47 to 0.72) | <0.001 |
| Corticosteroids | 0.61 (0.48 to 0.77) | <0.001 | 1.15 (0.85 to 1.56) | 0.35 |
Abbreviations: sHR indicates subdistribution hazard ratio; CI, confidence interval; APACHE, acute physiology and chronic health evaluation; ICU, intensive care unit; PaO2, partial pressure of arterial oxygen; FiO2, fraction of inspired oxygen. Data are shown as estimated HRs (95% CIs) of the explanatory variables in the in-hospital mortality group and the recovery group. Fine-Gray competing risks model stratified on the center variable and adjusted by COVID-19 wave. The p-value is based on the null hypothesis that all HRs relating to an explanatory variable equal unity (no effect).
“+1″ means a one-unit increase on the scale in the predictor variable (i.e., going from 1 to 2, 2 to 3, etc.).
“+10″ means a ten-unit increase on the scale in the predictor variable (i.e., going from 10 to 20, 20 to 30, etc.).
In a cohort of 5090 critically ill patients admitted to 55 Spanish ICUs for severe COVID-19 we found: 1) 30% of the overall cohort were aged ≥70 years old, and this group presented significantly higher rates of in-hospital mortality rates than younger patients; 2) patients aged ≥70 years receiving IMV presented significantly worse outcomes than those receiving NIRS; and 3) risk factors for in-hospital mortality in patients aged ≥70 years included increasing age, previous 30 days admission, chronic cardiovascular disease and chronic renal failure as baseline variables, and platelet count and IMV as ICU-related variables, whereas corticosteroid therapy conferred a beneficial effect on in-hospital mortality.
Mortality of critically-ill patients with COVID-19 varies widely across countries worldwide ranging from 30% to 80%, being highest in ventilated patients.16–20 The high mortality rate observed in our study is consistent with studies from various countries, in which older age and underlying frailty were identified as risk factors strongly associated with severe COVID-19 infection.3,16,21–25 A report on COVID-19-related deaths issued by the CDC showed that the mortality rate in individuals aged ≥65 years was more than 65-fold times higher than that in patients aged 18–29 years.21 Similarly, individuals with underlying medical conditions such as chronic renal or heart failure have increased risk of severe COVID-19 and mortality.26 Nevertheless, the limitation of life-sustaining treatments, which was more frequent in older and more severe patients, may hugely influence this high crude mortality.27 Moreover, meta-analyses had previously found lower platelet counts being associated with an increased risk of in-hospital mortality in overall population.28,29
Several studies have shown that increasing age is associated with a lower likelihood of being intubated in critically-ill COVID-19 elderly patients.23,30–35 Interestingly, a meta-analysis comprising 21 studies with a combined population of 37,359 patients with COVID-19 (5800 receiving IMV) from 7 countries did not find an association between increasing age and the likelihood of receiving IMV, yet in line with our findings decreasing mortality rates amongst ventilated patients across waves were found.33 Another recent posthoc analysis of the PRoVENT-COVID study showed that in a cohort of invasively ventilated critically ill COVID-19 patients, age had no effect on ventilator management. However greater age was associated with more complications and higher mortality.23 It is also worth mentioning that prior studies found much higher mortality rates in ventilated elderly patients. In a recent meta-analysis pooling data from 57,000 COVID-19 patients that required mechanical ventilation, the overall case-fatality rate was 45% (95% CI: 39–52%), which increased according to age group, being 84% (95% CI: 83.3–85.4%) in patients over 80 years.6 Andrei and colleagues found even higher mortality rates in patients very elderly ventilated patients with COVID-19, as in 1666 patients with a median age of 83 years ICU mortality was 78%, reaching 97% amongst those receiving mechanical ventilation.34 In a prospective cohort of 3.719 severe CAP patients (mean age of 70 years old) from Spain previous to the COVID-19 pandemic,35 the authors reported a higher 30-day mortality in mechanical ventilated patients compared with patients received non-invasive ventilation (33% vs. 18%, p<0001). They also reported that IMV was an independently predicted of 30-day mortality in patients with severe CAP. Meanwhile, in-hospital mortality was 61% amongst patients ≥80 years in our study, and although the difference did not reach statistical significance, patients receiving NIRS presented a notably lower mortality rate than those receiving IMV (55% vs. 71%, p = 0.057).
A major strength of our study is the large multicentre nature, the consecutive inclusion of all patients from each center, and the detailed information on ICU-related features provide great value for all healthcare professionals treating COVID-19 in the setting of critically ill patients. On the other hand, our findings are constrained by a lack of sub-analyses assessing the impact of the type of steroid, time of initiation, dosing and length of treatment. Limitations of our study include different waves of the pandemic (S-Table 11), which could have influenced our results. We have however adjusted our multivariable analysis for this confounder. We also do not have data on restrictions of care, and not systematically collected the time point in which patients transitioned from one ventilation modality to another. Finally, as we examined real-world data, limitations associated to the observational nature and missing data should be considered.
In conclusion, patients aged ≥70 years constituted a significant proportion of ventilated patients with COVID-19 across 55 Spanish ICUs, presenting high mortality rates. Age, previous admission within the last 30 days, chronic heart disease, chronic renal failure, platelet count, IMV at ICU admission and systemic steroids (protective) were independent factors associated with in-hospital mortality in critically ill patients aged ≥70 years. Administering systemic steroids could have beneficial effects on in-hospital mortality.
Author contributionsStudy concept and design: CC, AM, AT; data collection: CC, AM, AP, TC, AC statistical analysis: AG; analysis and interpretation of data: CC, AM, JP, TC, AT; drafting of the manuscript: CC, AM, JP, AT; critical revision of the manuscript for important intellectual content: CC, AM, JP, and AT; and study supervision: AT. AT had full access to all the data in the study and takes responsibility for the integrity of the data and the accuracy of the data analysis. All authors read and approved the final manuscript. CiberesUCICOVID consortium participated in data collection.
Availability of data and materialsThe datasets used and/or analysed during the current study are available from the corresponding author on reasonable request.


