


Screening methods have become increasingly important due to the growing number of patients suspected of having obstructive sleep apnea (OSA) being referred to sleep clinics. The Lausanne NoSAS (Neck circumference, Obesity, Snoring, Age, Sex) score test is a simple, efficient, and easily employed tool enabling identification of individuals at risk for the disease. The score ranges from 0 to 17 and the patient has a high probability of OSA if they have a NoSAS score of 8 or higher.
ObjectivesTo evaluate the performance of the NoSAS score as a screening tool for the diagnosis of OSA in a sleep clinic.
MethodsProspectively, for 12 months, we included all the patients referred by primary care physicians to our sleep unit for clinical evaluation who had undergone in-lab polysomnography (PSG) and completed the NoSAS score. This test assigns 4 points for a neck circumference of more than 40cm, 3 points for a body-mass index of 25kg/m2 to less than 30kg/m2 or 5 points for having a body-mass index of 30kg/m2 or more, 2 points for snoring, 4 points for being older than 55 years of age and 2 points for being male.
ResultsOf the 294 patients, 70.7% were male, aged 53.5±12.1 years, with a neck circumference of 41.0±3.6cm and a BMI of 30.8±5.1kg/m2. OSA was present in 84.0% of the patients, 34.8% with moderate OSA and 36.4% severe OSA. Using the NoSAS model for the prediction of all OSA, moderate/severe OSA and severe OSA, the area under the ROC (Receiver Operating Characteristic) was 0.770 (IC95%: (0.703; 0.837), p<0.001), 0.746 (IC95%: (0.691; 0.802), p<0.001) and 0.686 (IC95%: (0.622; 0.749), p<0.001), respectively, thus confirming the diagnostic ability of the NoSAS model.
With a NoSAS score ≥7, the sensitivity and positive predictive value (PPV) were 94.3% and 87.6% for all OSA, 94.9% and 62.8% for moderate/severe OSA and 100% and 33.8% for severe OSA, respectively. With the same cut-off, the negative predictive value (NPV) for moderate/severe and severe OSA were 67.9% and 100%, respectively. Each increase in the NoSAS score was associated with an increase in the probability of OSA, reaching a 97% OSA probability for a score of 17.
ConclusionsThe NoSAS score showed high sensitivity and PPV for OSA with specificity and diagnostic accuracy steadily increasing with higher scores. Furthermore, a low score showed high predictive value for the exclusion of moderate/severe OSA. Overall, our results suggest that, in primary care, this score can be a powerful tool for stratifying and prioritizing patients in the diagnosis of OSA. Nevertheless, more studies are needed to evaluate the efficacy of this score in hospital health care, in younger populations, with a predominance of female and non-obese individuals or in cardiovascular disease.
Obstructive sleep apnea syndrome (OSA) is characterized by obstruction of the upper respiratory tract leading to increased respiratory effort with inadequate ventilation. The obstruction is caused by the collapse of the pharynx due to the decrease of the muscle tone that occurs during sleep; individuals that present risk factors are predisposed to this situation occurring. These episodes are inevitably accompanied by desaturation, increased activity of the sympathetic nervous system with frequent arousals. Snoring and daytime sleepiness are the main complaints and observed apnea is the most specific symptom.
Individuals with hidden disease are at high risk of medical comorbidities and of road accidents due to excessive sleepiness. There is an independent association of OSA with increased morbidity and mortality due to metabolic disorders, neurovascular and cardiovascular disease, and impaired neurocognitive function, even if asymptomatic.1–3
The prevalence of this pathology depends significantly on the population studied and the definition of OSA criteria (study methodology and threshold of apnea hypopnea index (AHI) used).4,5 According to Heinzer et al., the prevalence is about 23.4% in women and 49.7% in men.6 Estimates show that the male/female ratio ranges from 2:1 to 4:1. It can appear in all age groups, however, studies show that women have a higher incidence in the age group above 65 years, prevalence increasing after menopause, while in men it occurs between 45 and 64 years of age.7
Screening methods have become increasingly important due to the growing number of patients suspected of having obstructive sleep apnea being referred to sleep clinics. The difficulty of diagnosis of this pathology is related to the availability and accessibility of cardiorespiratory sleep studies (laboratory diagnosis). Consequently, prioritization and screening methods that appropriately stratify are essential. A simple and reliable method of screening certain populations, namely high-risk groups, is needed. The choice of screening method will depend on its ability to achieve a specific objective: to include patients with OSA for appropriate sleep testing; to detect those with more severe disease facilitating early diagnosis and treatment; and to exclude patients without OSA or without severe OSA, whose evaluation and treatment is less urgent.
Numerous clinical prediction models have been developed based on clinical, demographics and anthropometric variables.8,9 A recently proposed screening method is the Lausanne NoSAS Score test (Appendix A), a simple, efficient, and easily employed tool enabling identification of individuals at risk for the disease.10 This score assess 5 parameters: Neck circumference, Obesity, Snoring, Age, Sex and assigns 4 points for having a neck circumference of more than 40cm, 3 points for having a body-mass index of 25kg/m2 to less than 30kg/m2 or 5 points for having a body-mass index of 30kg/m2 or more, 2 points for snoring, 4 points for being older than 55 years of age and 2 points for being male. The score ranges from 0 to 17 and the patient has a high probability of OSA if they have a NoSAS score of 8 or higher. Thus, it helps to identify individuals at risk for the disease and rule out others without risk, with a negative predictive value (NPV) of 90% and 98% in two ethnically different population-based cohorts.10
MethodsObjectiveThe present study aimed to evaluate the performance of the NoSAS score as a screening tool for the diagnosis of OSA in a respiratory and sleep medicine clinic.
Study designProspective study, 12 months in duration, beginning in January 2017, we considered consecutively all patients with suspicious sleep disorder, referred by primary care physicians to our sleep unit for clinical evaluation and who underwent in-lab polysomnography (PSG).
During the clinical consultation, every patient was asked if they accepted participation in the study, regardless of the reasons for being referred, which included referral for isolated symptoms or clinical suspicion of a specific sleep disorder (e.g. OSA, insomnia, parasomnia).
All patients included were required to complete the NoSAS questionnaire,10 with information concerning neck circumference, body mass index (BMI), snore, age and gender, ultimately collected by a clinician. We also evaluated other parameters namely Epworth's score, tiredness, observed apnea and high blood pressure (blood pressure >140/90mmHg or make treatment for hypertension).
The research staff did not interfere with the interpretation or completion of the questionnaires.
Patients previously diagnosed with OSA, those unable to read and/or write, additional diagnoses obtained throughout the sleep study (like central sleep apnea and obesity/hypoventilation syndrome) and all cases of technical error during data collection, were excluded from the study.
Sleep studies, scoring and diagnosisAt the specialized sleep center, all patients underwent a standard PSG, using the patient's usual bedtime overnight. A standardized setting made up of surface electrodes was used and included: electrocardiogram, electroencephalogram, electrooculogram, submental and lower limb EMG. Besides this data, additional information was collected regarding oronasal airflow (thermistor and pressure sensor), thoracic and abdominal respiratory effort, pulse oximetry, snoring and body position sensoring. A certified PSG technician scored the PSG recordings, ensuring correct assembly, under the supervision of a sleep physician who reviewed and validated the final reports. The sleep physician and technician were both blinded to the study report (both clinical information and NoSAS). The scoring was done manually, following the recommendations of the American Academy of Sleep Medicine.11 Apnea was defined as a decrease of at least 90% of airflow from baseline, lasting 10 second or longer. Hypopnea was defined as a decrease of at least 30% of airflow from baseline, lasting 10 second, associated with either an arousal or a ≥3% O2 saturation decrease. The mean number of apneas and hypopneas per hours of sleep (apnea–hypopnea index [AHI]) was calculated. Both diagnosis and severity of OSA were classified based upon the AHI: >5–15/h – mild, >15–30/h – moderate, and >30/h – severe.11,12
Additional diagnoses obtained throughout the sleep study were defined accordingly to the International Classification of Sleep disorders-third edition.13 However, our study was exclusively focused on OSA, so all other diagnoses were ignored or excluded.
Statistical analysisStatistical analysis was made using the IBM SPSS® statistical program, version 25 (the Statistical Package for the Social Sciences).
The categorical variables were described with frequencies and percentages and the quantitative variables with mean, median, standard deviation, maximum and minimum. All associations between the presence of OSA and each of the possible risk factors were established using logistic regression, which estimated their odds ratios (ORs).
To evaluate the performance of the NoSAS score in predicting OSA, sensitivity, specificity, negative predictive values (NPVs) and positive predictive values (PPVs) were estimated for different AHI cut-offs.
To measure the diagnostic ability of the NoSAS score for different AHI cut-offs, we also determined the area under the receiver operating characteristic (ROC) curve and the value of the score where both sensitivity and specificity maximized.
For the evaluation of the influence of the NoSAS score in the estimation of the probabilities of OSA severity, an ordinal regression model was fitted with the logit link function. The Wald test was considered significant when its p-value did not exceed 0.05.
ResultsOf the 294 patients, 70.7% were male, aged 53.5±12.1 years, with a neck circumference of 41.0±3.6cm and a BMI of 30.8±5.1kg/m2. OSA was present in 84.0% of the patients, 28.8% with mild OSA, 34.8% moderate and 36.4% severe.
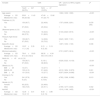
Descriptive summary statistics, NoSAS characteristics and comparison of OSA and non-OSA groups are displayed in Table 1. Although greater in the OSA group, tiredness was the only characteristic which were not significantly different between the OSA and non-OSA group.
Summary statistics of the patient population and comparison of OSA and non OSA group.
| Variable | OSA | OR – yes/no (CI 95%); logistic regression | pa | |
|---|---|---|---|---|
| YesN=247 (84.0%) | NoN=47 (16.0%) | |||
| Age (years) | 1.062 (1.032; 1.093) | <0.001 | ||
| Average±SD | 55.81±11.43 | 47.49±13.06 | ||
| Median(mín; máx) | 56 (20; 82) | 47 (23; 77) | ||
| Tiredness (n) (%) | ||||
| Yes | 150 (60.7) | 22 (46.8) | 1.757 (0.938; 3.291) | 0.078 (NS) |
| No | 97 (39.3) | 25 (53.2) | 1 | |
| Observed apnea (n) (%) | ||||
| Yes | 179 (72.5) | 16 (34.0) | 5.100 (2.623; 9.915) | <0.001 |
| No | 68 (27.5) | 31 (66.0) | 1 | |
| Pessure (high blood) | ||||
| Yes | 150 (60.7) | 14 (29.8) | 3.645 (1.855; 7.161) | <0.001 |
| No | 97 (39.3) | 33 (70.2) | 1 | |
| Epworth's Score | 1.067 (1.004; 1.135) | 0.036 | ||
| Average±SD | 10.97±5.35 | 9.15±5.19 | ||
| Median(mín; máx) | 11 (1; 24) | 8 (2; 20) | ||
| Minimum saturation | 0.731 (0.657; 0.814) | <0.001 | ||
| Average±SD | 78.41±10.63 | 88.30±4.34 | ||
| Median (mín; máx) | 81.0 (0.0; 92.0) | 90.0 (74.0; 95.7) | ||
| Neck circ.>40cm (n) (%) | ||||
| Yes | 150 (60.7) | 9 (19.1) | 6.529 (3.023; 14.104) | <0.001 |
| No | 97 (39.3) | 38 (80.9) | 1 | |
| Obesity (n) (%) | <0.001 | |||
| BMI<25 | 14 (5.7) | 13 (27.7) | 1 | |
| BMI 25–30 | 102 (41.3) | 21 (44.6) | 4.510 (1.854; 10.973) | 0.001 |
| BMI≥30 | 131 (53.0) | 13 (27.7) | 9.357 (3.634; 24.096) | <0.001 |
| Snoring (n) (%) | ||||
| Yes | 241 (97.6) | 42 (89.4) | 4.782 (1.396; 16.380) | 0.013 |
| No | 6 (2.4) | 5 (10.6) | 1 | |
| Gender (n) (%) | ||||
| Female | 63 (25.5) | 23 (48.9) | 1 | |
| Male | 184 (74.5) | 24 (51.1) | 2.799 (1.477; 5.305) | 0.002 |
| NoSAS | 1.310 (1.196; 1.435) | <0.001 | ||
| Average±SD | 12.35±3.51 | 8.43±3.86 | ||
| Median(mín; máx) | 13 (3; 17) | 9 (0; 15) | ||
Using the NoSAS model for the prediction of all OSA, moderate/severe OSA and severe OSA, the area under the ROC curve (AUC) was 0.770 (IC95%: (0.703; 0.837), p<0.001), 0.746 (IC95%: (0.691; 0.802), p<0.001) and 0.686 (IC95%: (0.622; 0.749), p<0.001), respectively, thus confirming the diagnostic ability of the NoSAS model.
The sensitivity, specificity, PPV, and NPV for all OSA, moderate/severe OSA, and severe OSA are summarized in Table 2. With a NoSAS score ≥7, the sensitivity and positive predictive value (PPV) were 94.3% e 87.6% for all OSA, 94.9% and 62.8% for moderate/severe OSA and 100% and 33.8% for severe OSA, respectively. With the same cut-off, the negative predictive value (NPV) for all OSA, moderate/severe OSA and severe OSA were 50%, 67.9% and 100%, respectively. As the score increased from 7 to 12, the specificity and PPV increased continuously from 29.8% to 83% and 87.6% to 94.7% for all OSA, 16.1% to 74.6% and 62.8% to 80% for moderate/severe OSA, and 13.7% to 57.8% and 33.8% to 42.7% for severe OSA, respectively.
Predictive parameters of each NoSAS score cut-offs for different AHI levels (n, number of patients in the AHI group who scored the NoSAS score indicated or higher; percentage out of the 294 patients).
| All OSA (AHI> 5) | |||||
|---|---|---|---|---|---|
| NoSAS score cut-off | N (%) | Sensitivity | Specificity | PPV | NPV |
| ≥1 | 247 (84.0) | 100 | 2.1 | 85.5 | 100 |
| ≥3 | 247 (84.0) | 100 | 10.6 | 85.5 | 100 |
| ≥4 | 246 (83.7) | 99.6 | 10.6 | 85.4 | 83.3 |
| ≥5 | 241 (82.0) | 97.6 | 21.3 | 86.7 | 62.5 |
| ≥6 | 235 (79.9) | 95.1 | 27.7 | 87.4 | 52.0 |
| ≥7 | 233 (79.3) | 94.3 | 29.8 | 87.6 | 50.0 |
| ≥8 | 216 (73.5) | 87.4 | 40.4 | 88.5 | 38.0 |
| ≥9 | 210 (71.4) | 85.0 | 44.7 | 89.0 | 36.2 |
| ≥11 | 190 (64.6) | 76.9 | 55.3 | 90.0 | 31.3 |
| ≥12a | 142 (48.3) | 57.5 | 83.0 | 94.7 | 27.1 |
| ≥13 | 141 (48.0) | 57.1 | 83.0 | 94.6 | 26.9 |
| ≥15 | 91 (31.0) | 36.8 | 95.7 | 97.8 | 22.4 |
| ≥17 | 42 (16.7) | 17.0 | 100 | 100 | 18.7 |
| 18 | 0 (0.0) | 0.0 | 100 | – | 16.0 |
| Moderate/severe OSA (AHI>15) | |||||
|---|---|---|---|---|---|
| NoSAS score cut-off | N (%) | Sensitivity | Specificity | PPV | NPV |
| ≥1 | 176 (59.9) | 100 | 0.8 | 60.0 | 100 |
| ≥3 | 176 (59.9) | 100 | 4.2 | 60.9 | 100 |
| ≥4 | 176 (59.9) | 100 | 5.1 | 61.1 | 100 |
| ≥5 | 173 (58.8) | 98.3 | 11.0 | 62.2 | 81.3 |
| ≥6 | 169 (57.5) | 96.0 | 15.3 | 62.8 | 72.0 |
| ≥7 | 167 (56.8) | 94.9 | 16.1 | 62.8 | 67.9 |
| ≥8 | 158 (53.7) | 89.8 | 27.1 | 64.8 | 64.0 |
| ≥9 | 155 (52.7) | 88.1 | 31.4 | 65.8 | 63.8 |
| ≥11 | 142 (48.3) | 80.7 | 41.5 | 67.3 | 59.0 |
| ≥12 | 120 (40.8) | 68.2 | 74.6 | 80.0 | 61.1 |
| ≥13a | 120 (40.8) | 68.2 | 75.4 | 80.5 | 61.4 |
| ≥15 | 79 (26.9) | 44.9 | 88.1 | 84.9 | 51.7 |
| ≥17 | 41 (13.9) | 23.3 | 99.2 | 97.6 | 46.4 |
| 18 | 0 (0.0) | 0.0 | 100 | – | 40.1 |
| Severe OSA (AHI>30) | |||||
|---|---|---|---|---|---|
| NoSAS score cut-off | N (%) | Sensitivity | Specificity | PPV | NPV |
| ≥1 | 90 (30.6) | 100 | 0.5 | 30.7 | 100 |
| ≥3 | 90 (30.6) | 100 | 2.5 | 31.1 | 100 |
| ≥4 | 90 (30.6) | 100 | 2.9 | 31.3 | 100 |
| ≥5 | 90 (30.6) | 100 | 7.8 | 32.4 | 100 |
| ≥6 | 90 (30.6) | 100 | 12.3 | 33.5 | 100 |
| ≥7 | 90 (30.6) | 100 | 13.7 | 33.8 | 100 |
| ≥8 | 85 (28.9) | 94.4 | 22.1 | 34.8 | 90.0 |
| ≥9 | 85 (28.9) | 94.4 | 26.0 | 36.0 | 91.4 |
| ≥11 | 76 (25.9) | 84.4 | 33.8 | 36.0 | 83.1 |
| ≥12 | 64 (21.8) | 71.1 | 57.8 | 42.7 | 81.9 |
| ≥13a | 64 (21.8) | 71.1 | 58.3 | 43.0 | 82.1 |
| ≥15 | 44 (15.0) | 48.9 | 76.0 | 47.3 | 77.1 |
| ≥17 | 22 (7.5) | 24.4 | 90.2 | 53.4 | 73.0 |
| 18 | 0 (0.0) | 0.0 | 100 | – | 69.4 |
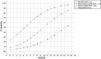
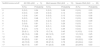
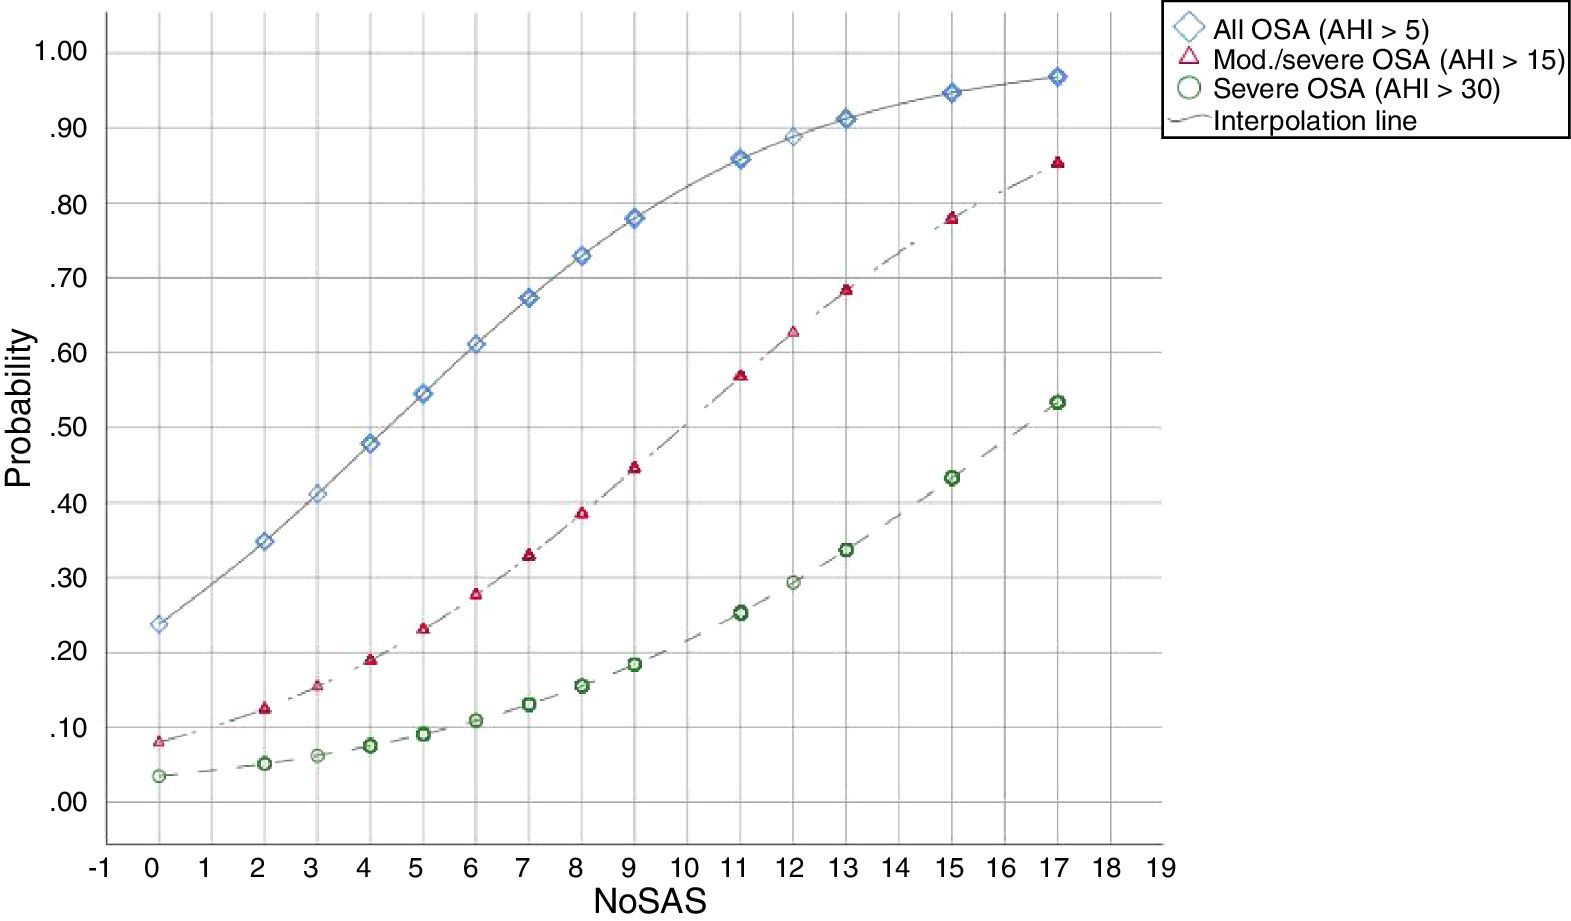
The predicted probabilities of having OSA, moderate/severe OSA, and severe OSA are shown in Table 3. As NoSAS score increased from 2 to 17, the probability of having OSA, moderate/severe OSA, and severe OSA increased continuously from 35% to 97%, 12% to 85% and 5% to 53%, respectively. This trend, present in all groups is illustrated in Fig. 1.
Predicted probabilities of each NoSAS score for different AHI levels (n, number of patients in the AHI group who scored the NoSAS score indicated; percentage out of the 294 patients).
| NoSAS score cut-off | All OSA (AHI>5) | Mod./severe OSA (AHI>15) | Severe OSA (AHI>30) | |||
|---|---|---|---|---|---|---|
| N (%) | Probability | N (%) | Probability | N (%) | Probability | |
| 0 | 0 (0.0) | 0.24 | 0 (0.0) | 0.08 | 0 (0.0) | 0.03 |
| 2 | 0 (0.0) | 0.35 | 0 (0.0) | 0.12 | 0 (0.0) | 0.05 |
| 3 | 1 (0.4) | 0.41 | 0 (0.0) | 0.15 | 0 (0.0) | 0.06 |
| 4 | 5 (2.0) | 0.48 | 3 (1.7) | 0.19 | 0 (0.0) | 0.08 |
| 5 | 6 (2.4) | 0.55 | 4 (2.3) | 0.23 | 0 (0.0) | 0.09 |
| 6 | 2 (0.8) | 0.61 | 2 (1.1) | 0.28 | 0 (0.0) | 0.11 |
| 7 | 17 (6.9) | 0.67 | 9 (5.1) | 0.33 | 5 (5.6) | 0.13 |
| 8 | 6 (2.4) | 0.73 | 3 (1.7) | 0.39 | 0 (0.0) | 0.16 |
| 9 | 20 (8.1) | 0.78 | 13 (7.4) | 0.45 | 9 (10.0) | 0.18 |
| 11 | 48 (19.4) | 0.86 | 22 (12.5) | 0.57 | 12 (13.3) | 0.25 |
| 12 | 1 (0.4) | 0.89 | 0 (0.0) | 0.63 | 0 (0.0) | 0.29 |
| 13 | 50 (20.2) | 0.91 | 41 (23.3) | 0.68 | 20 (22.2) | 0.34 |
| 15 | 49 (19.8) | 0.95 | 38 (21.6) | 0.78 | 22 (24.4) | 0.43 |
| 17 | 42 (17.0) | 0.97 | 41 (23.3) | 0.85 | 22 (24.4) | 0.53 |
Abbreviations: AHI: apnea–hypopnea index; OSA: obstructive sleep apnea.
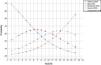
The predicted probabilities of having OSA of a specific severity are illustrated in Fig. 2. With each incremental increase in the score from 0 to 7, the probability of having no sleep apnea diminished, while the probability of having mild, moderate, or severe sleep apnea increased continuously. With any score greater than 7, only the probability of having moderate or severe sleep apnea increased. With a score greater than 13, only the probability of having severe sleep apnea increased.
Discussion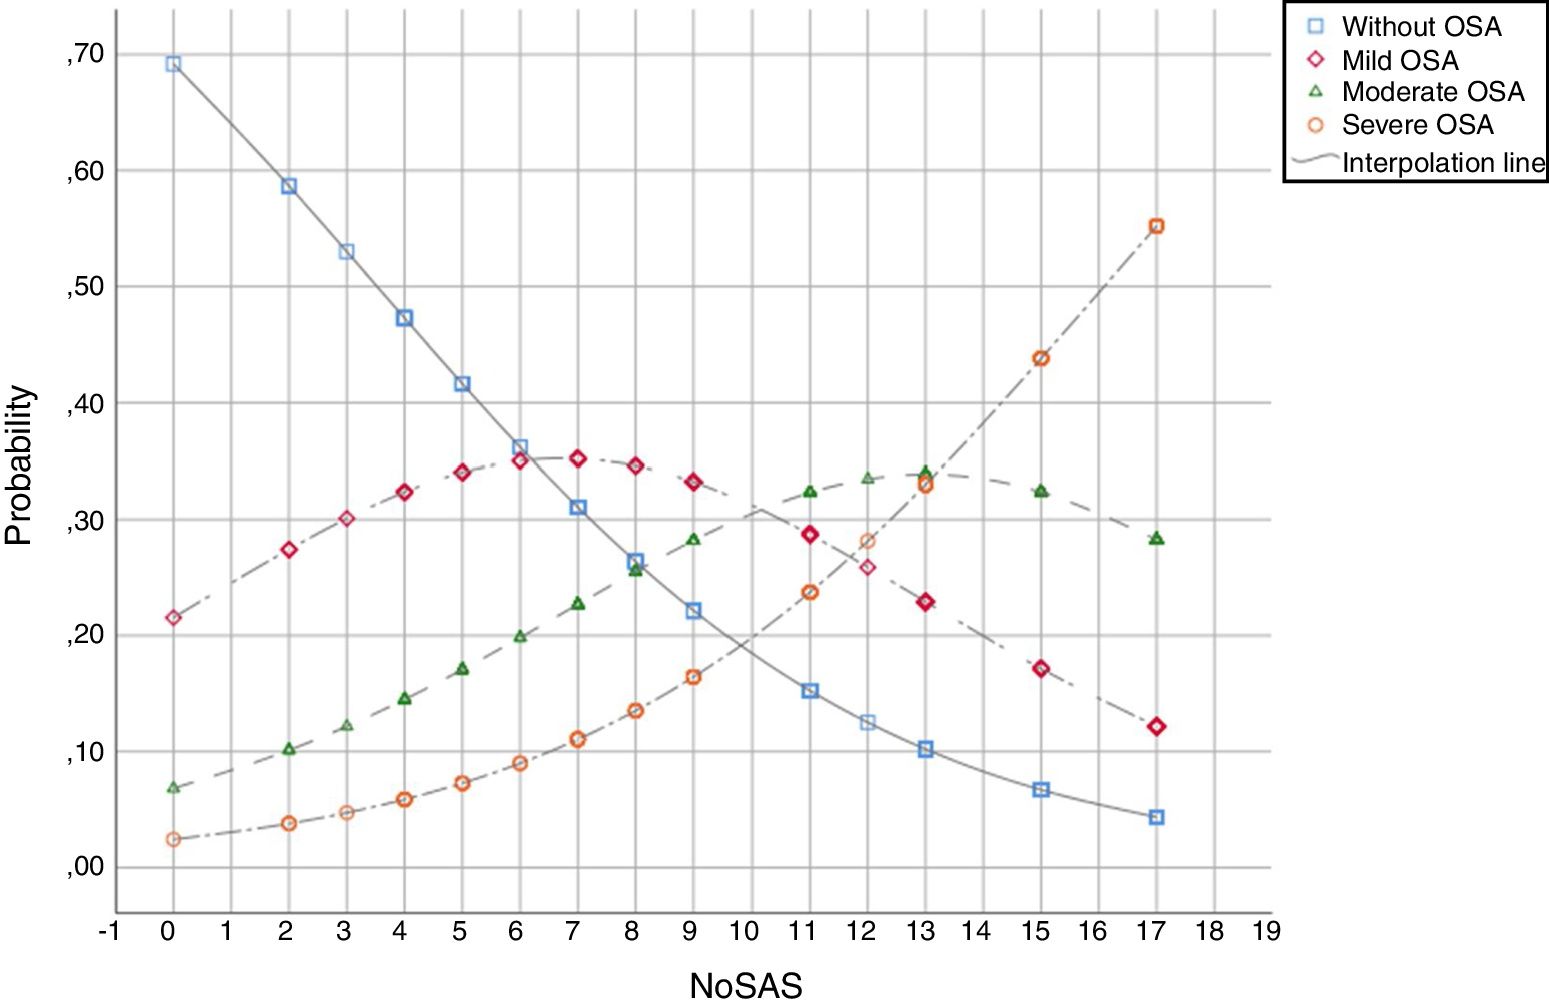
This study shows that, in a population referred to a sleep medicine clinic, a NoSAS score ≥7 has high sensitivity (94.3%) and PPV (87.6%) for the diagnosis of OSA and that the greater the NoSAS score, reflecting a higher cumulative score of known risk factors, the greater the probability of sleep apnea, particularly moderate to severe sleep apnea (Fig. 2). The probability of OSA for a score of 7 is 67% and increases continuously to 73%, 78%, 86%, 91%, 95% and 97% with a stepwise increase of the NoSAS score to 8, 9, 11, 13, 15 and 17. This performance is due to the increasing probability of moderate to severe OSA for each score above 7, reaching a predicted probability of 57%, 68%, 78% and 85% for a score of 11, 13, 15 and 17 (Table 3), respectively. Moreover, a score lower than 7 showed discriminative power to exclude moderate/severe OSA, as reflected by a NPV of 67.9%, 72% and 81.3% for a score of 7, 6 and 5, respectively. The AUC was consistently high confirming the diagnostic ability of the NoSAS model for all OSA severities. Furthermore, tiredness was statistically similar between the OSA and non-OSA groups, although tending to be greater and more prevalent in the OSA group, reflecting tiredness as an equally common complaints among patients with various sleep disorders and diseases of other organs.
Owing to the relatively high prevalence of undiagnosed OSA and its comorbidities, a trustworthy screening tool is needed and mandatory for a prompt prediction of OSA. A quick and reliable screening test can enable clinicians within a clinical context to make more informed diagnostic decisions, particularly when stratifying patients for unrecognized OSA and triage for further diagnostic assessment and treatment. Where they can be used and scored easily, as part of routine daily practice, questionnaires can be appropriate tools for that purpose. Moreover, analysis of the questionnaire performance in specific populations can provide clinicians with a set of predictive parameters for different levels of OSA severity, which can be used as a crucial guide for diagnostic and therapeutic decisions. In our study the present results show that the NoSAS questionnaire, can add great value and be a very useful and powerful tool in primary care. On the basis of its ability to discriminate participants with clinically significant disorder, its PPV, and its NPV, NoSAS score can be a very useful tool for triaging patients depending on their score: score of 0–5 – low probability of OSA, particularly moderate to severe OSA; score ≥7 probable OSA; score ≥12 high probability of OSA, specifically moderate to severe OSA.
Numerous questionnaires and other clinical screening tools for OSA have been analyzed previously. The study of derivation and validation of NoSAS score of Marti-Soler et al., shows 8 as a threshold and the score was defined as positive if it was greater than or equal to 8 points and negative if it was less than 8 points, on the basis of its ability to discriminate participants with clinically significant disorder.10 This study shows an AUC of 0.74, a PPV of 47%, an NPV of 90% and the NoSAS score performed significantly better than did the STOP-Bang (AUC 0.67) and Berlin (AUC 0.63) scores.10 In our cohort, we propose 7 as a threshold and obtained an even higher performance with the AUC 0.770, a PPV of 87.6% and a NPV of 67.9%.
Moreover, there are some papers that evaluated NoSAS that are worth mentioning. According Guichard et al., NoSAS was similar to Berlin and significantly better than STOP-Bang questionnaire (AUC was 0.72 for NoSAS, 0.66 for STOP-Bang and 0.69 for the Berlin score).14 A study of Tan et al., also evaluated NoSAS score and compared its performance to the STOP-Bang and Berlin questionnaires.15 The sensitivity, specificity, and NPV and PPV of the NoSAS score to predict severe sleep disorder breathing (defined as an AHI of ≥30events/h), were 69.2%, 73.1%, 95.2%, and 23.7%, respectively.16 They concluded that its performance was similar to the STOP-Bang and Berlin questionnaires, with AUC values of all three questionnaires clustered around 0.682–0.748.16 According Lye et al., the sensitivity, specificity, and NPV and PPV of the NoSAS score to predict severe OSA (AHI≥30events/h) was 64.3%, 70.0%, 63.8% and 70.4%, respectively.16 The AUC of NoSAS score (0.724) was higher than Epworth Sleepiness Scale (ESS) (0.544).16 They concluded that overall the NoSAS score performed better than the ESS.16 Moreover, according Cicero et al., a high NoSAS score was associated with increased arterial stiffness, reduced renal function and increased mean arterial pressure in a large cohort of healthy individuals.17 Although this study did not evaluate NoSAS accuracy and do not suggest a causal link between OSA and cardiovascular disease, it also showed clinical relevance in using this score to identify individuals who probably have OSA and a higher cardiovascular risk.17
In reference to the validation of a Portuguese version of the STOP-Bang in primary care, by Rebelo-Marques et al., using this model for the prediction of OSA, the diagnostic ability of the STOP-Bang was relatively superior to NoSAS score (the AUC was 0.847).18
In conclusion, our results agree with and support the original data from Marti-Soher et al.,10 and can help to implement and generalize its use in primary care.
However, this study has limitations that must be mentioned. The fact that our sample consisted mainly of obese men with an average age of over 50 years may have conditioned our results.
ConclusionsThe NoSAS score showed high sensitivity and PPV for OSA with specificity and diagnostic accuracy which steadily increased with higher scores. Furthermore, a low score showed high predictive value for the exclusion of moderate/severe OSA. Overall, our results suggest that this score is simple, efficient, and easy to implement, it enables identification of individuals at risk of the disease and can help primary care clinicians to decide which patients to investigate further with a nocturnal recording. So this score can be a powerful tool in primary care for stratifying and prioritizing patients in the diagnosis of OSA, depending on their score: score of 0–5 – low probability of OSA, particularly moderate to severe OSA; score ≥7 probable OSA; score ≥12 high probability of OSA, particularly moderate to severe OSA. Nevertheless, more studies are needed to evaluate the efficacy of this score in hospital health care, in younger populations, with a predominance of female and non-obese individuals or in cardiovascular disease.
Conflicts of interestThe authors have no conflicts of interest to declare.
- 1.
Neck circumference >40 cm – 4 points
- 2.
Obesity
- -
BMI 25 kg/m2 to <30kg/m2 – 3 points
- -
BMI ≥30kg/m2 – 5 points
- -
- 3.
Snoring – 2 points
- 4.
Age >55 years – 4 points
- 5.
Sex: male – 2 points


