


Height is one of the variables used to derive reference values for respiratory function but it is not always available. To fulfil this need, different formulas are described in literature.
AimTo understand which method best estimate height in order to obtain Forced Vital Capacity (FVC) and Forced Expiratory Volume in 1st second (FEV1) reference values.
MethodsThe true stature (TS) and five alternative anthropometric measures that estimate height [arm span using a regression equation (ASR), arm span using a fix correction factor (ASF), half arm span, knee height and ulnar length] were measured for all patients. To assess the differences between the TS versus the estimated heights and the respective reference values of FVC and FEV1, T Student Test and Wilcoxon test were used. Agreement was evaluated by Intraclass Correlation Coefficient and by Bland-Altman plot.
ResultsA total of 160 subjects were recruited but 14 patients were excluded due to skeletal deformities. The predicted FVC and FEV1 using all alternative anthropometric measures were statistically different from those calculated by TS, except for ASF. The limits of agreement were wide for all alternative measures. With the exception of ASF, predicted FVC and FEV1 were overestimated when using all other alternative measures.
ConclusionsFor the purpose of replacing height in order to obtain predicted values of FVC and FEV1, the ASF was shown to be the most accurate and recommendable method. However, we must be aware there is a possible degree of error.
Since the invention of the spirometer by John Hutchinson the impact of the decrease of pulmonary function values on morbidity and mortality has been recognized.1 Nowadays, pulmonary function tests fulfill a pivotal role in respiratory medicine. They are not only used as auxiliary diagnostic tools but also to assess the degree of respiratory incapacity of patients with pulmonary diseases.2,3
Lung function tests are usually interpreted by comparing measured values in an individual with reference values obtained from healthy individuals. To standardize interpretation, in 2012 the Global Lung Function Initiative (GLI) defined prediction equations for spirometric indices based on age, sex, race and height.4 To the best of our knowledge, there are no specific reference equations for the Portuguese population, except for the six-minute walk test and for the incremental shuttle walk test.5,6 However, for the assessment of true stature (TS) demanded by GLI, an individual is required to have no musculoskeletal abnormalities and should be able to stand up straight unaided without constraints. With certain medical conditions this measurement is not reliable, such as, axial skeletal deformities, neuromuscular weakness or extreme debility. In such cases, alternative anthropometric measurements have been proposed to estimate height to fulfill this need.7 These, however, may introduce some degree of error leading to incorrect interpretation of lung function.8
The impact that alternative measures can have in spirometric indices is not yet fully understood. To date, few studies have sought to clarify this impact. Sancho et al. proposed an evaluation of such impact and showed poor agreement between different alternative measures.9
Under such circumstances, arm span (AS) has been chosen as one of the main surrogate measurements for estimating height. It can be calculated either by application of a fixed correction factor or by using regression equations.7,10,11 The half arm span (HS) allows measurement of a single limb and has also been used to estimate height.12 Another surrogate is knee height (KH) which is easy to obtain and may be useful in people with limb amputations. It has traditionally been used in nutrition.13,14 Ulnar length (UL) is another alternative measure already studied in the field of pulmonary function.15 Ulna is an accessible bone and its length is not usually impaired by joint deformities and it is less affected by the aging process.16,17
We hypothesized that substitution of TS by estimated height calculated from alternative anthropometric measures is likely to introduce only a tiny error in the predicted pulmonary function indices in individuals who cannot obtain a reliable measurement of TS.
Material and methodsStudy design and participantsThis is a cross-sectional study conducted in a public hospital in the north of Portugal.
The study was conducted on a sample population of adult subjects aged 18–95 years of either sex, referred to the respiratory laboratory of our hospital for pulmonary function assessment. Study subjects were consecutively recruited by systematic sampling over a 2-month period. In order to be included in the study, all participants signed the informed consent form. The study was approved by the hospital ethics committee.
A brief medical history, physical examination and spirometry were carried out on each person enrolled in the study. Subjects for whom height or alternative anthropometric measures could not be correctly measured were excluded. Exclusion criteria were specifically: neuromuscular diseases, axial or appendicular skeletal deformities, limb amputations, osteoporosis, previous orthopedic surgery, contractions or deformities of the shoulder, elbow or wrist joints, swelling of the knee or ankle and extreme debility that would not allow participant to stand up without constraints. Participants older than 95 years were also excluded because GLI does not define prediction equations for spirometric indices above this age.
Measurement of height and alternative anthropometric measuresAll the measurements were made in the pulmonary function laboratory, using the same anthropometric apparatus. Prior to data collection, researchers were taught about anthropometric measurement techniques in order to obtain a standardization of the process. Anthropometric data used in our analyses were: true stature, arm span, half arm span, knee height and ulna length. Descriptions of the measurement techniques used to collect these data are documented below. All measures were obtained in centimeters to the nearest 0.5 cm. Two other measurements were taken and the median of the three measurements calculated. The three measurements had to be within 1 cm of each other, if not a fourth measure was taken and the median of the three closest values was recorded.
TS was carried out using a stadiometer that was placed on a level even surface and against a wall that was at a 90° angle to the floor. The patient had to be able to stand steady and upright, unaided. Shoes were removed and the patient was asked to look straight ahead with the Frankfort plane horizontal. The arms were relaxed at the sides, legs were close together and feet were flat with the heels together on a hard floor surface. Then a sliding head board was placed on to the vertex of the participant and the stature was read.
AS and HS were measured using a flexible measuring tape. The participants were asked to stand against the wall with their arms outstretched in a horizontal plane in relation to the floor and palms facing outwards. The arms had to create a 90° angle with the participant’s body. To assess AS, the distance between the ends of the middle fingers of both hands was recorded. To measure HS, the distance between the midpoint of the suprasternal notch and the distal phalanx of the left middle finger was measured by passing a flexible, inelastic measuring tape parallel to the clavicle.
KH was measured with the subject in the sitting position and the knee and ankle joints of the left leg at 90° angles. A flexible measuring tape was placed next to the leg in line with lateral malleolus and the head of the fibula. The distance from the plantar surface of the left foot (heel) to the top of the thigh immediately above the condyles of the left femur was measured.
The UL was measured with a flexible metal measuring from the elbow’s tip (olecranon process) to the tip of the styloid process. UL was measured in the left arm of the patient, folded in front of the patient’s chest, with fingers pointing to the opposite shoulder.
EquationsThe alternative anthropometric measurements obtained from data collection were inserted into different equations in order to predict height. The equations were applied accordingly and values were calculated to one decimal place.
Height estimation based on AS was calculated either by application of a fixed correction factor (according to Portuguese Directorate-General of Health (DGS) guidelines) and by using regression equations (recommended by American Thoracic Society/European Respiratory Society (ATS/ERS)).7,10,11 The respective equations were:
DGS:
ATS/ERS:
The equation for estimating height from HS was12:
The equation for estimating height based on KH was13:
To predict height based on UL, a standardized table was used.18
Based on prediction equations defined by GLI4 the predictive values of Forced Vital Capacity (FVC) and Forced Expiratory Volume in one second (FEV1) were calculated. Six sets of values based on TS and others based on height estimated from AS (one obtained by application of a fixed correction factor (ASF) and another by using regression equations (ASR)), HS, KH, and UL were generated for each subject.
Statistical analysisA statistical software program (SPSS version 20; SPSS Inc., Chicago, IL, USA) was used for data analysis. All reported p values are two-tailed, with a p value of 0.05 indicating statistical significance. Sample size was determined based on G*Power (version 3.1.9.3), for a power of 80%.
Categorical variables were presented as frequencies and percentages. Continuous variables were presented as means ± standard deviations, or as medians and interquartile ranges for variables with skewed distributions. The normality of data distribution was assessed with Kolmogorov–Smirnov tests. P-value greater than 0.05 indicates normal distribution of data.
Predicted pulmonary function values obtained from alternative anthropometric measures were compared with those based on TS, with the use of Student’s t-test for paired data or the Wilcoxon test.
The concordance was analyzed by intraclass correlation coefficient (ICC), taking TS as the standard method. ICC estimates and their 95% confident intervals were calculated using SPSS.19 ICC values were interpreted as excellent (>0.90), good (0.75–0.90), moderate (0.50–0.75) or poor (<0.50).
Agreement analysis as described by Bland & Altman20 was used to further investigate how closely the alternative measurements could estimate height, and FVC and FEV1, subsequently. Agreement was assessed by plotting the difference between the two measurements, against the mean of the two measurements, for each individual. The limits of agreement were defined as the mean difference ± 1.96 standard deviation (SD). These limits showed by how much the tested measurement may vary from the standard method.
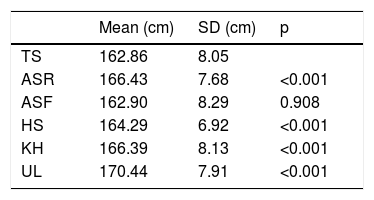
ResultsA total of 160 subjects were recruited. Of these, fourteen individuals were excluded because they had one of the following exclusion criteria: scoliosis (n = 3), osteoporosis (n = 3), neuromuscular disease (n = 2), kyphosis (n = 2), previous spine surgery (n = 2), Madelung deformity (n = 1) and fingers amputation (n = 1). 146 individuals were included in the final analysis, 86 (58.9%) were male. The average age of the sample was 53.2 ± 17.0 years with an age range of 18–91 years (first quartile was 43, median quartile was 55 and third quartile was 66). The mean TS was 162.9 ± 8.1 cm; according to gender was: males 166.9 ± 6.31 cm and females 157.1 ± 6.6 cm.
Means of height estimated from different anthropometric measures were described in Table 1. There were significant differences between the averages of TS and those estimated from ASR, HS, KH and UL. The only exception was that estimated by AS, using a fixed correction factor (ASF).
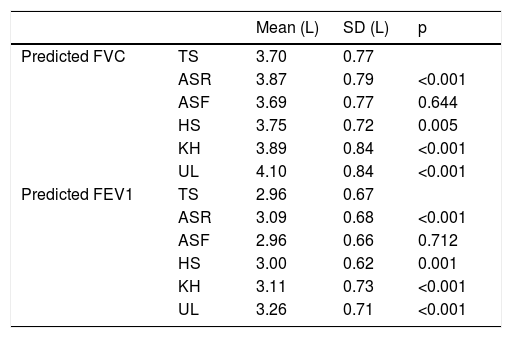
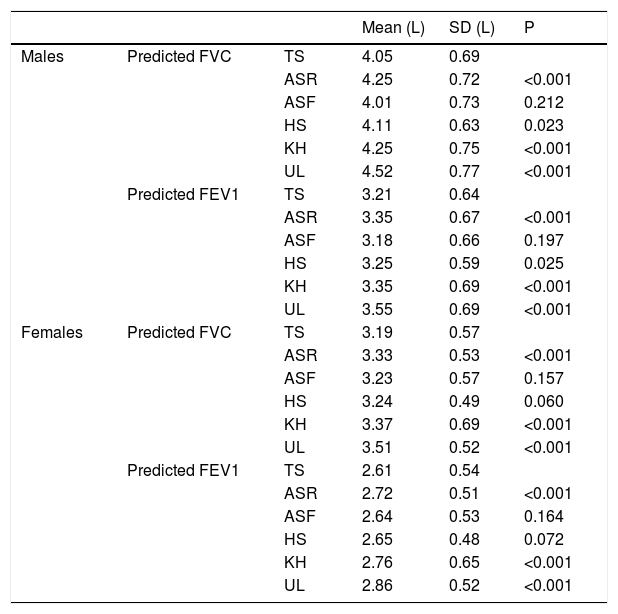
Regarding the predicted values of FVC and FEV1, those calculated from ASF were the only ones without statistically significant difference when compared with those obtained from TS (Table 2). When analyzed by gender, in the subgroup of males ASF remained the only without statistically significant difference. However, in females either predicted values of FVC and FEV1 calculated from ASF as HS showed no statistically differences from those obtained from TS (Table 3).
Comparison of predicted FVC and FEV1 values obtained using TS with those obtained using each alternative anthropometric measure.
| Mean (L) | SD (L) | p | ||
|---|---|---|---|---|
| Predicted FVC | TS | 3.70 | 0.77 | |
| ASR | 3.87 | 0.79 | <0.001 | |
| ASF | 3.69 | 0.77 | 0.644 | |
| HS | 3.75 | 0.72 | 0.005 | |
| KH | 3.89 | 0.84 | <0.001 | |
| UL | 4.10 | 0.84 | <0.001 | |
| Predicted FEV1 | TS | 2.96 | 0.67 | |
| ASR | 3.09 | 0.68 | <0.001 | |
| ASF | 2.96 | 0.66 | 0.712 | |
| HS | 3.00 | 0.62 | 0.001 | |
| KH | 3.11 | 0.73 | <0.001 | |
| UL | 3.26 | 0.71 | <0.001 |
Comparison by gender of predicted FVC and FEV1 values obtained using TS with those obtained using each alternative anthropometric measure.
| Mean (L) | SD (L) | P | |||
|---|---|---|---|---|---|
| Males | Predicted FVC | TS | 4.05 | 0.69 | |
| ASR | 4.25 | 0.72 | <0.001 | ||
| ASF | 4.01 | 0.73 | 0.212 | ||
| HS | 4.11 | 0.63 | 0.023 | ||
| KH | 4.25 | 0.75 | <0.001 | ||
| UL | 4.52 | 0.77 | <0.001 | ||
| Predicted FEV1 | TS | 3.21 | 0.64 | ||
| ASR | 3.35 | 0.67 | <0.001 | ||
| ASF | 3.18 | 0.66 | 0.197 | ||
| HS | 3.25 | 0.59 | 0.025 | ||
| KH | 3.35 | 0.69 | <0.001 | ||
| UL | 3.55 | 0.69 | <0.001 | ||
| Females | Predicted FVC | TS | 3.19 | 0.57 | |
| ASR | 3.33 | 0.53 | <0.001 | ||
| ASF | 3.23 | 0.57 | 0.157 | ||
| HS | 3.24 | 0.49 | 0.060 | ||
| KH | 3.37 | 0.69 | <0.001 | ||
| UL | 3.51 | 0.52 | <0.001 | ||
| Predicted FEV1 | TS | 2.61 | 0.54 | ||
| ASR | 2.72 | 0.51 | <0.001 | ||
| ASF | 2.64 | 0.53 | 0.164 | ||
| HS | 2.65 | 0.48 | 0.072 | ||
| KH | 2.76 | 0.65 | <0.001 | ||
| UL | 2.86 | 0.52 | <0.001 |
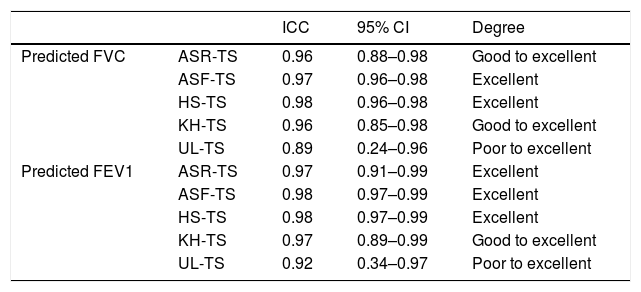
The ICC for predicted FVC and FEV1, taking into account each of the alternative anthropometric measures used, are shown in Table 4. The degree of reliability associated with each ICC is given in the same table.
ICC and degree of reproducibility for predicted FVC and FEV1 for each alternative measure.
| ICC | 95% CI | Degree | ||
|---|---|---|---|---|
| Predicted FVC | ASR-TS | 0.96 | 0.88–0.98 | Good to excellent |
| ASF-TS | 0.97 | 0.96–0.98 | Excellent | |
| HS-TS | 0.98 | 0.96–0.98 | Excellent | |
| KH-TS | 0.96 | 0.85–0.98 | Good to excellent | |
| UL-TS | 0.89 | 0.24–0.96 | Poor to excellent | |
| Predicted FEV1 | ASR-TS | 0.97 | 0.91–0.99 | Excellent |
| ASF-TS | 0.98 | 0.97–0.99 | Excellent | |
| HS-TS | 0.98 | 0.97–0.99 | Excellent | |
| KH-TS | 0.97 | 0.89–0.99 | Good to excellent | |
| UL-TS | 0.92 | 0.34–0.97 | Poor to excellent |
Assuming TS as the standard measurement to compare the estimates against, Bland-Altman analysis of agreement was carried out comparing the FVC predicted using the five surrogate measures with FVC predicted using TS. The limits of agreement were wide with all five surrogate measures. The Fig. 1A shows Bland-Altman analysis comparing predicted FVC using ASF with predicted FVC using TS. Another Bland-Altman analysis was performed comparing, this time, predicted FEV1 using five alternative measures with predicted FEV1 using TS. With the exception of ASF, when used all other alternative measures to estimate height, predicted FVC and FEV1 were overestimated; whereas on average ASF estimates it more closely (mean difference = −0.01 litres for predicted FVC; −0.01 litres for predicted FEV1).
Discussion Difference in predicted FVC between ASF and TS versus mean. (B) Difference in predicted FEV1 between ASF and TS versus mean”.")
GLI identified height as the main determinant of pulmonary function,4 so the correct value must be obtained to minimize the errors in prediction equations for spirometric indices. However, a reliable measurement of height is frequently not available. In order to overcome this limitation, the possibility is to estimate height using alternative anthropometric measures or by constructing reference equations for pulmonary function directly using the alternative measures.8,15
As far as we know, only the study conducted by Sancho-Chust et al.9 proposed evaluating the impact of the use of some alternative anthropometric measures to estimate height for the purpose of predicting pulmonary function. This study was conducted before the publication of GLI equations and Sancho-Chust et al. found that using all alternatives measures the predicted values of FVC and FEV1 were overestimated, introducing a certain degree of error. The KH was the measurement with greatest agreement and so they propose its use in cases where obtaining height is impossible.9
In our study, the authors sought to understand this impact on our population after the introduction of GLI equations and using the most commonly anthropometric measures. Our study showed that the predicted values of FVC and FEV1 obtained using the TS or alternative anthropometric measures only did not show a statistically significant difference for the ASF. When analyzed by gender, our study continued to show that in the subgroup of males ASF is the only one that predicts FVC and FEV1 values with no statistical difference, but in subgroup of females HS also showed no statistical differences. Nevertheless, by Bland-Altman analysis we observed that even using the ASF the limits of agreement are wide. Taking the upper and lower limits of agreement of ASF, predicted FVC may be overestimated by 0.48 litres or underestimated by 0.50 litres, respectively. These values are higher than the limit of 0.15 litres used as repeatability criteria.21 As such, this may have an impact on the spirometric evaluation of patients. In this analysis it was assumed that the differences did not vary in any systematic way over the range of measurements of FVC or FEV1. In fact, when we analyze Fig. 1A and B we find that the scatter plot of the differences remains the same as predicted FVC and FEV1 increase. Therefore, ASF could be used for individuals who are unable to stand but on understanding that the agreement is not optimal.
All the other alternative anthropometric measures tend to overestimate the predicted values of FVC and FEV1, especially UL (mean difference: 0.40 and 0.30 litres, respectively). Taking the upper limits of agreement of UL, predicted FVC may be overestimated by 1.09 litres. Thus, using these alternative measures (ASR, HS, KH and UL), we must be aware that it may lead to interpretation errors. In particular, by classifying more cases as probable restrictive abnormalities or by reclassifying in more severe degrees cases of restrictive or obstructive abnormalities.
Agreement between measurements was excellent as we can see from the ICC results obtained.
A limitation that may be pointed out to this study is that the authors did not provide correction factors for the height estimated by all alternative anthropometric measures. However this should be done in a healthy population. In this study, the authors used a sample population of adults referred to the respiratory laboratory mainly due to suspected respiratory diseases. As such, the creation of correction factors was not feasible.
Despite the widespread use of the GLI 2012 reference values, applying it to specific populations remains controversial. For instance, Fasola et al.22 and Backman et al.23 concluded that the use of GLI reference values in their population could produce a bias on airway obstruction prevalence. This means physicians should be careful to test reference values prior to their use in a local area. In fact, the authors did not test the applicability of GLI 2012 reference values to the Portuguese population prior to this study. This could be another possible weakness of this study.
The study did not include individuals under 18 years-old. In most cases, these patients were not accompanied by their parents to the pulmonary function laboratory which would have made it more difficult to obtain the informed consent form. Another potential limitation is the use of measuring tapes that can overestimate the results by 1.03 cm.9
To sum up, our study emphasizes the importance of using appropriate anthropometric measures in order to obtain the predicted values of FVC and FEV1 of individuals for whom it is not possible to measure height. For this purpose, the ASF was shown to be the most accurate and the most recommendable method. Nevertheless, we must be aware of the possible degree of error introduced in predicting pulmonary function values.
Conflicts of interestThe authors have no conflicts of interest to declare.
Author contributionsMiguel Guimarães and Daniel Vaz conceived the idea. Nuno China, Daniel Vaz, Cristiana Martins and Joana Gomes collected the data. Nuno China wrote the manuscript and did the statistical analysis. All the authors have reviewed and edited the final version.


