


Patients with pulmonary arterial hypertension (PAH) require risk assessments for prognosis and appropriate therapy. These assessments need to be improved by incorporating clinical and laboratory data such as the analysis of the right ventricle. We aim to establish echocardiographic morphometric data of the right ventricle and its relationship with the left ventricle, to estimate the hemodynamic severity of precapillary pulmonary hypertension (PHprecapillary).
MethodsThis cohort, prospective, observational, and cross-sectional study included 41 consecutive patients with PHprecapillary using echocardiographic study and cardiac catheterization.
ResultsPatients’ mean age was 44.0±16.4 years, and 37 were women (90.2%). Idiopathic PAH was diagnosed in 18 patients (43.9%). The World Health Organization/New York Association functional class was III or IV in 31 patients (75.6%). The ratio of the right to left ventricles (RV/LV) echocardiographic diastolic diameters was associated with pulmonary arterial pressures in cardiac catheterization, with the best cutoff per receiver operating characteristic curve being 0.8 for systolic pressure (sensitivity 90.0%, specificity 78.3%, area under the curve [AUC] 0.882) and mean pressure (sensitivity 60.0%, specificity 95.7%, AUC 0.823). Spearman's correlation (R) of RV/LV echocardiographic ratio and the hemodynamic variables was significant for systolic pressure (R = 0.7015, p < 0.0001), mean pressure (R = 0.6332, p < 0.0001), transpulmonary pressure gradient (R = 0.6524, p < 0.0001), pulmonary vascular resistance (R = 0.6076, p = 0.0021), and pulmonary vascular resistance index (R = 0.6229, p = 0.0014).
ConclusionThe ratio of RV/LV echocardiographic diastolic diameters contribute to the estimates the hemodynamic severity of precapillary pulmonary hypertension. The best cutoff for this assessment was RV/LV of 0.8.
AUC Area under the curve Brain natriuretic peptide hemodynamic cardiac index hemodynamic cardiac output Chronic thromboembolic pulmonary hypertension dynas.s−1.cm−5 dynas.s−1.cm−5/m2 Echocardiography thickness of the interventricle septum Left ventricle Pulmonary artery mean pressure Pulmonary arterial hypertension Pulmonary capillary wedge pressure Pulmonary hypertension Precapillary pulmonary hypertension Pulmonary vascular resistance Pulmonary vascular resistance index six-minute walk test Pulmonary artery systolic pressure Echocardiography pulmonary artery systolic pressure Receiver operating characteristic Echocardiography diastolic diameter right to left ventricles ratio Echocadiography diastolic diameter of the right ventricle Transpulmonary pressure gradient
Pulmonary hypertension (PH) is a common clinical condition with a pathophysiological classification for therapeutic guidance.1,2 This classification divides PH into group 1, with pulmonary arterial hypertension (PAH); group 2, with left heart disease; group 3, with chronic lung disease or hypoxia; group 4, with chronic thromboembolic pulmonary hypertension (CTEPH) and other pulmonary arterial obstructions; and group 5, with ill-defined clinical conditions or multifactorial mechanisms.1,2 However, PH has a hemodynamic classification, it being divided into precapillary (PHprecapillary) and postcapillary PH, in addition to combined conditions.3 The PHprecapillary is characterized by increased pulmonary vascular resistance (PVR) and pulmonary arterial pressure, but normal pulmonary capillary pressure. In postcapillary PH, pulmonary arterial and capillary pressures are increased, but PVR is normal.3 When the classifications are added together, PHprecapillary corresponds to groups 1, 3, 4, and 5, while postcapillary PH corresponds to group 2.3
Echocardiography is a screening examination to diagnose PH confirmed by right cardiac catheterization.2 In PAH cases, the concept of severity is important, as treatment recommendations are based on the patient's risk obtained from clinical, laboratory, and hemodynamic data.4
Echocardiogram data are rarely referred to in risk estimates. Further, pericardial effusion and right atrium enlargement are late findings. The right ventricle (RV), the heart chamber directly affected by PH, is rarely mentioned in severity classifications, and echocardiography easily provides data about the same. However, there is no gold standard for evaluating the RV in echocardiographic studies.5 In PH, the echocardiographic anatomical behavior of the RV is usually not considered by the attending physician, with reliable and constant data being missed, especially when compared to the tricuspid valve regurgitation velocity.
The objective of the study is to establish RV echocardiographic morphometric data to estimate the hemodynamic severity of PHprecapillary in cardiac catheterization, improve its interpretation by valuing unusual objective data, and to avoid the analysis of parameters with significant variability between examiners. It is also noteworthy that the echocardiogram is non-invasive, presents no risks, and has widespread clinical use and a relatively low cost.
Material and methodsThis is a cohort, prospective, observational, and cross-sectional study approved by the Human Research Ethics Committee of the Hospital de Clínicas Complex of the Federal University of Paraná, Curitiba, Brazil (CHC-UFPR) and was registered under number 2015019289. All study participants were aware of the research and agreed to participate by signing an informed consent form. They participated in the elaboration of recruitment strategies with an explanation of the procedures they would undergo. All the results were presented individually, with information on the influence on their treatment.
The study included consecutive patients with a presumptive diagnosis of PH referred to the CHC-UFPR Laboratory of Hemodynamics. All patients came from the Pulmonary Hypertension Outpatient Clinic of CHC-UFPR. The indication for catheterization was based on the following three criteria: clinical condition compatible with a diagnosis of PH, echocardiogram showing pulmonary artery systolic pressure (sPAPecho) ≥36 mmHg, and high clinical probability of PHprecapillary (groups 1, 3, 4, and 5).6 This study included no patients with advanced PH due to classic signs of echocardiographic severity: presence of pericardial effusion, tricuspid valve insufficiency (reflux), and enlarged right atrium (volume above 26.3 mL/m2 for women and 32.4 mL/m2 for men in the Brazilian population).7,8
The procedures were conducted between July 2017 and 2018. A total of 70 patients were referred and 41 (58.6%) of these were included after meeting the hemodynamic criteria of PHprecapillary during right cardiac catheterization at rest: pulmonary artery mean pressure (mPAP) ≥25 mmHg, PVR ≥240 dynas.s−1.cm−5 (dyna) (3 Wood Units), and pulmonary capillary wedge pressure (PCWP) ≤15 mmHg.2,3 Twenty-nine patients were excluded for presenting isolated or combined postcapillary PH (PCWP >15 mmHg) (11 patients) or for not confirming the clinical diagnosis of PH (normal hemodynamic study) (18 patients).2,3 Of the patients with normal hemodynamic study, two had an mPAP of 21 mmHg and PVR <240 dyna, and the others had mPAP ≤20 mmHg. All patients underwent standardized clinical evaluation with blood tests, chest imaging, pulmonary function tests, and six-minute walk test (6MWT).
Transthoracic echocardiography was performed according to the recommendations of the American Society of Echocardiography and the European Association of Cardiovascular Imaging.8 The sPAPecho was calculated by the tricuspid valve regurgitation velocity and the use of the simplified Bernoulli equation in mmHg. The sizes of the cardiac structures were obtained in a parasternal longitudinal window in mm, by evaluating the mean diastolic diameter of the RV (RVecho), interventricular septal thickness (IVSecho), left atrial diameter (LAecho), diastolic diameter of the left ventricle (LVecho), and systolic diameter of the left ventricle (sLVecho). Left ventricle (LV) fractional shortening, LV ejection fraction calculated using Simpson's modified formula, and LV mass in grams per square meter of body surface (g/m2) were also obtained. Finally, the ratio of the mean diastolic diameters of the right and left ventricles (RV/LVecho) was calculated. Patients were divided as RVecho (26 mm), RV/LVecho (0.7, 0.8, and 0.9), and IVSecho (11 mm).
The hemodynamic study included simultaneous right and left cardiac catheterization by femoral vein and artery puncture. Blood samples were collected for arterial blood gas analysis (aorta), mixed venous analysis (pulmonary trunk), and hemoglobin index. The right atrial mean pressure (mRAP), right ventricle systolic pressure (sRVP), right ventricle diastolic pressure (dRVP), pulmonary artery systolic pressure (sPAP), pulmonary artery diastolic pressure (dPAP), mPAP, PCWP, transpulmonary pressure gradient (TPG), and left ventricular end-diastolic pressure (LVEDP) were measured in mmHg. The direct Fick principle was used to calculate cardiac output (CO) in L/min, cardiac index (CI) in L/min/m2, PVR in dyna, and the pulmonary vascular resistance index (PVRI) in dyna/m2.
Statistical analysisMean, median, standard deviation, and amplitude (minimum and maximum) were calculated for continuous variables, and absolute (N) and relative frequency (%) were calculated for categorical variables. The Shapiro–Wilk test was used to assess the normality of continuous variables. The variable RV/LVecho was categorized into 0.7, 0.8, and 0.9 cuts in the generation of the receiver operating characteristic (ROC) curve for cutoff points of the sPAP and mPAP variables.9 Sensitivity, specificity, and area under the curve (AUC) were calculated on the ROC curves. The correlation between the continuous echocardiographic variables sPAPecho and RV/LVecho and the hemodynamic variables sPAP, mPAP, TPG, CI, PVR, and PVRI was performed using Spearman's correlation coefficient (R). The difference between groups was assessed by Student's t-test when the variables were normal and, if otherwise, it was assessed with the Mann–Whitney test. P-values <0.05 indicated statistical significance. Data analysis was performed using the R statistical software version 4.0.3 (R Core Team, 2020).10
ResultsThe studied population consisted of 37 women (90.2%) and 10 men (9.8%), with a mean age of 44.0±16.4 years (Table 1). The World Health Organization/New York Association (WHO/NYHA) functional class III or IV was assigned to 31 patients (75.6%).11.12 Patients with PAH (group 1) were the most prevalent, with 29 cases (70.7%). The most common clinical diagnoses were idiopathic PAH in 18 patients (43.9%) (Table 1). The RV/LVecho was 0.55±0.20 in patients at low risk, 0.70±0.26 in patients at intermediate risk (p = 0.4066 compared with the low risk group) and 0.97±0.25 in patients at high risk (p = 0.0125 compared with the low risk group and p = 0.0057 compared with the intermediate risk) (Table 1).2
Epidemiological and clinical characteristics of the studied population.
| N | % | ||
|---|---|---|---|
| Patients (total) | 41 | 100.0 | |
| Female gender | 37 | 90.2 | |
| Mean | SD | Limit | |
| Age (years) | 44.0 | 16.4 | 16.0-77.0 |
| Body weight (Kg) | 64.5 | 16.8 | 35.9-102.0 |
| Body height (cm) | 157.6 | 8.1 | 145.0-177.0 |
| Body surface area (cm2) | 163.4 | 20.3 | 127.5-204.0 |
| Haemoglobin (g/dL) | 13.9 | 2.1 | 9.2-19.4 |
| WHO/NYHA FUNCTIONAL CLASS* | |||
| N | % | ||
| I | 0 | 0.0 | |
| II | 10 | 24.4 | |
| III | 22 | 53.6 | |
| IV | 9 | 22.0 | |
| RISK ASSESSMENT (estimated 1-year mortality)⁎⁎ | |||
| N | % | ||
| Low (< 5%) | 3 | 7.3 | |
| Intermediate (5-10%) | 26 | 63.4 | |
| High (>10%) | 12 | 29.3 | |
| RISK ASSESSMENT and RV/LVecho | |||
| Mean# | SD | Limit | |
| Low | 0.55 | 0.20 | 0.42-0.78 |
| Intermediate | 0.70 | 0.26 | 0.30-1.58 |
| High | 0.97 | 0.25 | 0.60-1.40 |
| CLASSIFICATION OF PHprecapillary† | |||
| N | % | ||
| Group 1 (PAH) | 29 | 70.7 | |
| Group 3 (Lung disease and/or hypoxia) | 6 | 14.6 | |
| Group 4 (CTEPH) | 5 | 12.2 | |
| Group 5 (uncertain mechanism) | 1 | 2.5 | |
| ETIOLOGY OF PHprecapillary | |||
| N | % | ||
| Group 1: Idiopathic | 18 | 43.9 | |
| Group 1: Collagenosis‡ | 7 | 17.1 | |
| Group 1: Eisenmenger Syndrome | 4 | 9.7 | |
| Group 3: COPD | 2 | 4.9 | |
| Group 3: ILD | 2 | 4.9 | |
| Group 3: OSA | 2 | 4.9 | |
| Group 4: CTEPH | 5 | 12.2 | |
| Group 5: Gaucher disease | 1 | 2.4 | |
SD: Standard deviation.
RV/LVecho: echocardiography diastolic diameter right to left ventricles ratio.
PHprecapillary: Precapillary pulmonary hypertension.
PAH: Pulmonary arterial hypertension.
COPD: Chronic obstructive pulmonary disease.
ILD: Lung interstitial disease.
OSA: Obstructive sleep apnea.
CTEPH: Chronic thromboembolic pulmonary hypertension.
Galiè N, et al. Eur Heart J 2016; 37: 67-119. Parameters: clinical signs of right heart failure, progression of symptoms, syncope, WHO functional class*, six-minute walk test (6MWT), cardiopulmonary exercise testing, brain natriuretic peptide (BNP) or its NT fraction (NT-proBNP) plasma levels, imaging (echocardiography, cardiac magnetic resonance imaging) and haemodynamics2.
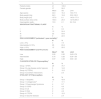
In the echocardiographic study, 26 patients (63.4%) had RV/LVecho above 0.8. The mean sPAPecho was 79.0±30.4 mmHg, RVecho was 29.5±7.8 mm, IVSecho was 9.8±1.7 mm, and RV/LVecho was 0.7±0.3 (0.3 to 1.6) (Table 2).
Echocardiographic and hemodynamic parameters of the studied population.
sPAPecho = echocardiography pulmonary artery systolic pressure.
RVecho = echocadiography diastolic diameter of the right ventricle.
IVSecho = echocardiography thickness of the interventricle septum.
LAecho = echocardiography diameter of the left atrium.
LVecho = echocardiography diastolic diameter of the left ventricle
sLVecho = echocardiography systolic diameter of the left ventricle.
LV = left ventricle.
RV/LVecho = echocardiography diastolic diameter right to left ventricles ratio.
mRAP = right atrial mean pressure.
sRVP = right ventricle systolic pressure.
dRVP = right ventricle diastolic pressurre.
sPAP = pulmonary artery systolic pressure.
dPAP = pulmonary artery diastolic pressure.
mPAP = pulmonary artery mean pressure.
PCWP = pulmonary capillary wedge pressure.
TPG = transpulmonary pressure gradient.
LVEDP = left ventricle end-diastolic pressure.
CO = cardiac output.
CI = cardiac index.
PVR = pulmonary vascular resistance.
PVRI = pulmonary vascular resistance index.
dyna = dynas.s−1.cm−5.
dyna/m2 = dynas.s−1.cm−5/m2.
SD = standard deviation.
Hemodynamic evaluation showed sPAP means of 84.2±33.5 mmHg, mPAP of 52.9±22.8 mmHg, and TPG of 41.0±23.2 mmHg (16.0 to 97.0 mmHg). The mean CI was 2.6±1.0 L/min/m2. Finally, the mean PVR was 885.8±825.1 dyna and PVRI was 1422.5±1326.3 dyna/m2 (Table 2).
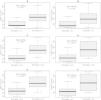
The RV/LVecho was used as a marker of echocardiographic RV morphometry indicative of hemodynamic severity of PHprecapillary. RV/LVecho ratios of 0.7, 0.8, and 0.9 were significantly associated with sPAP and mPAP (Fig. 1).
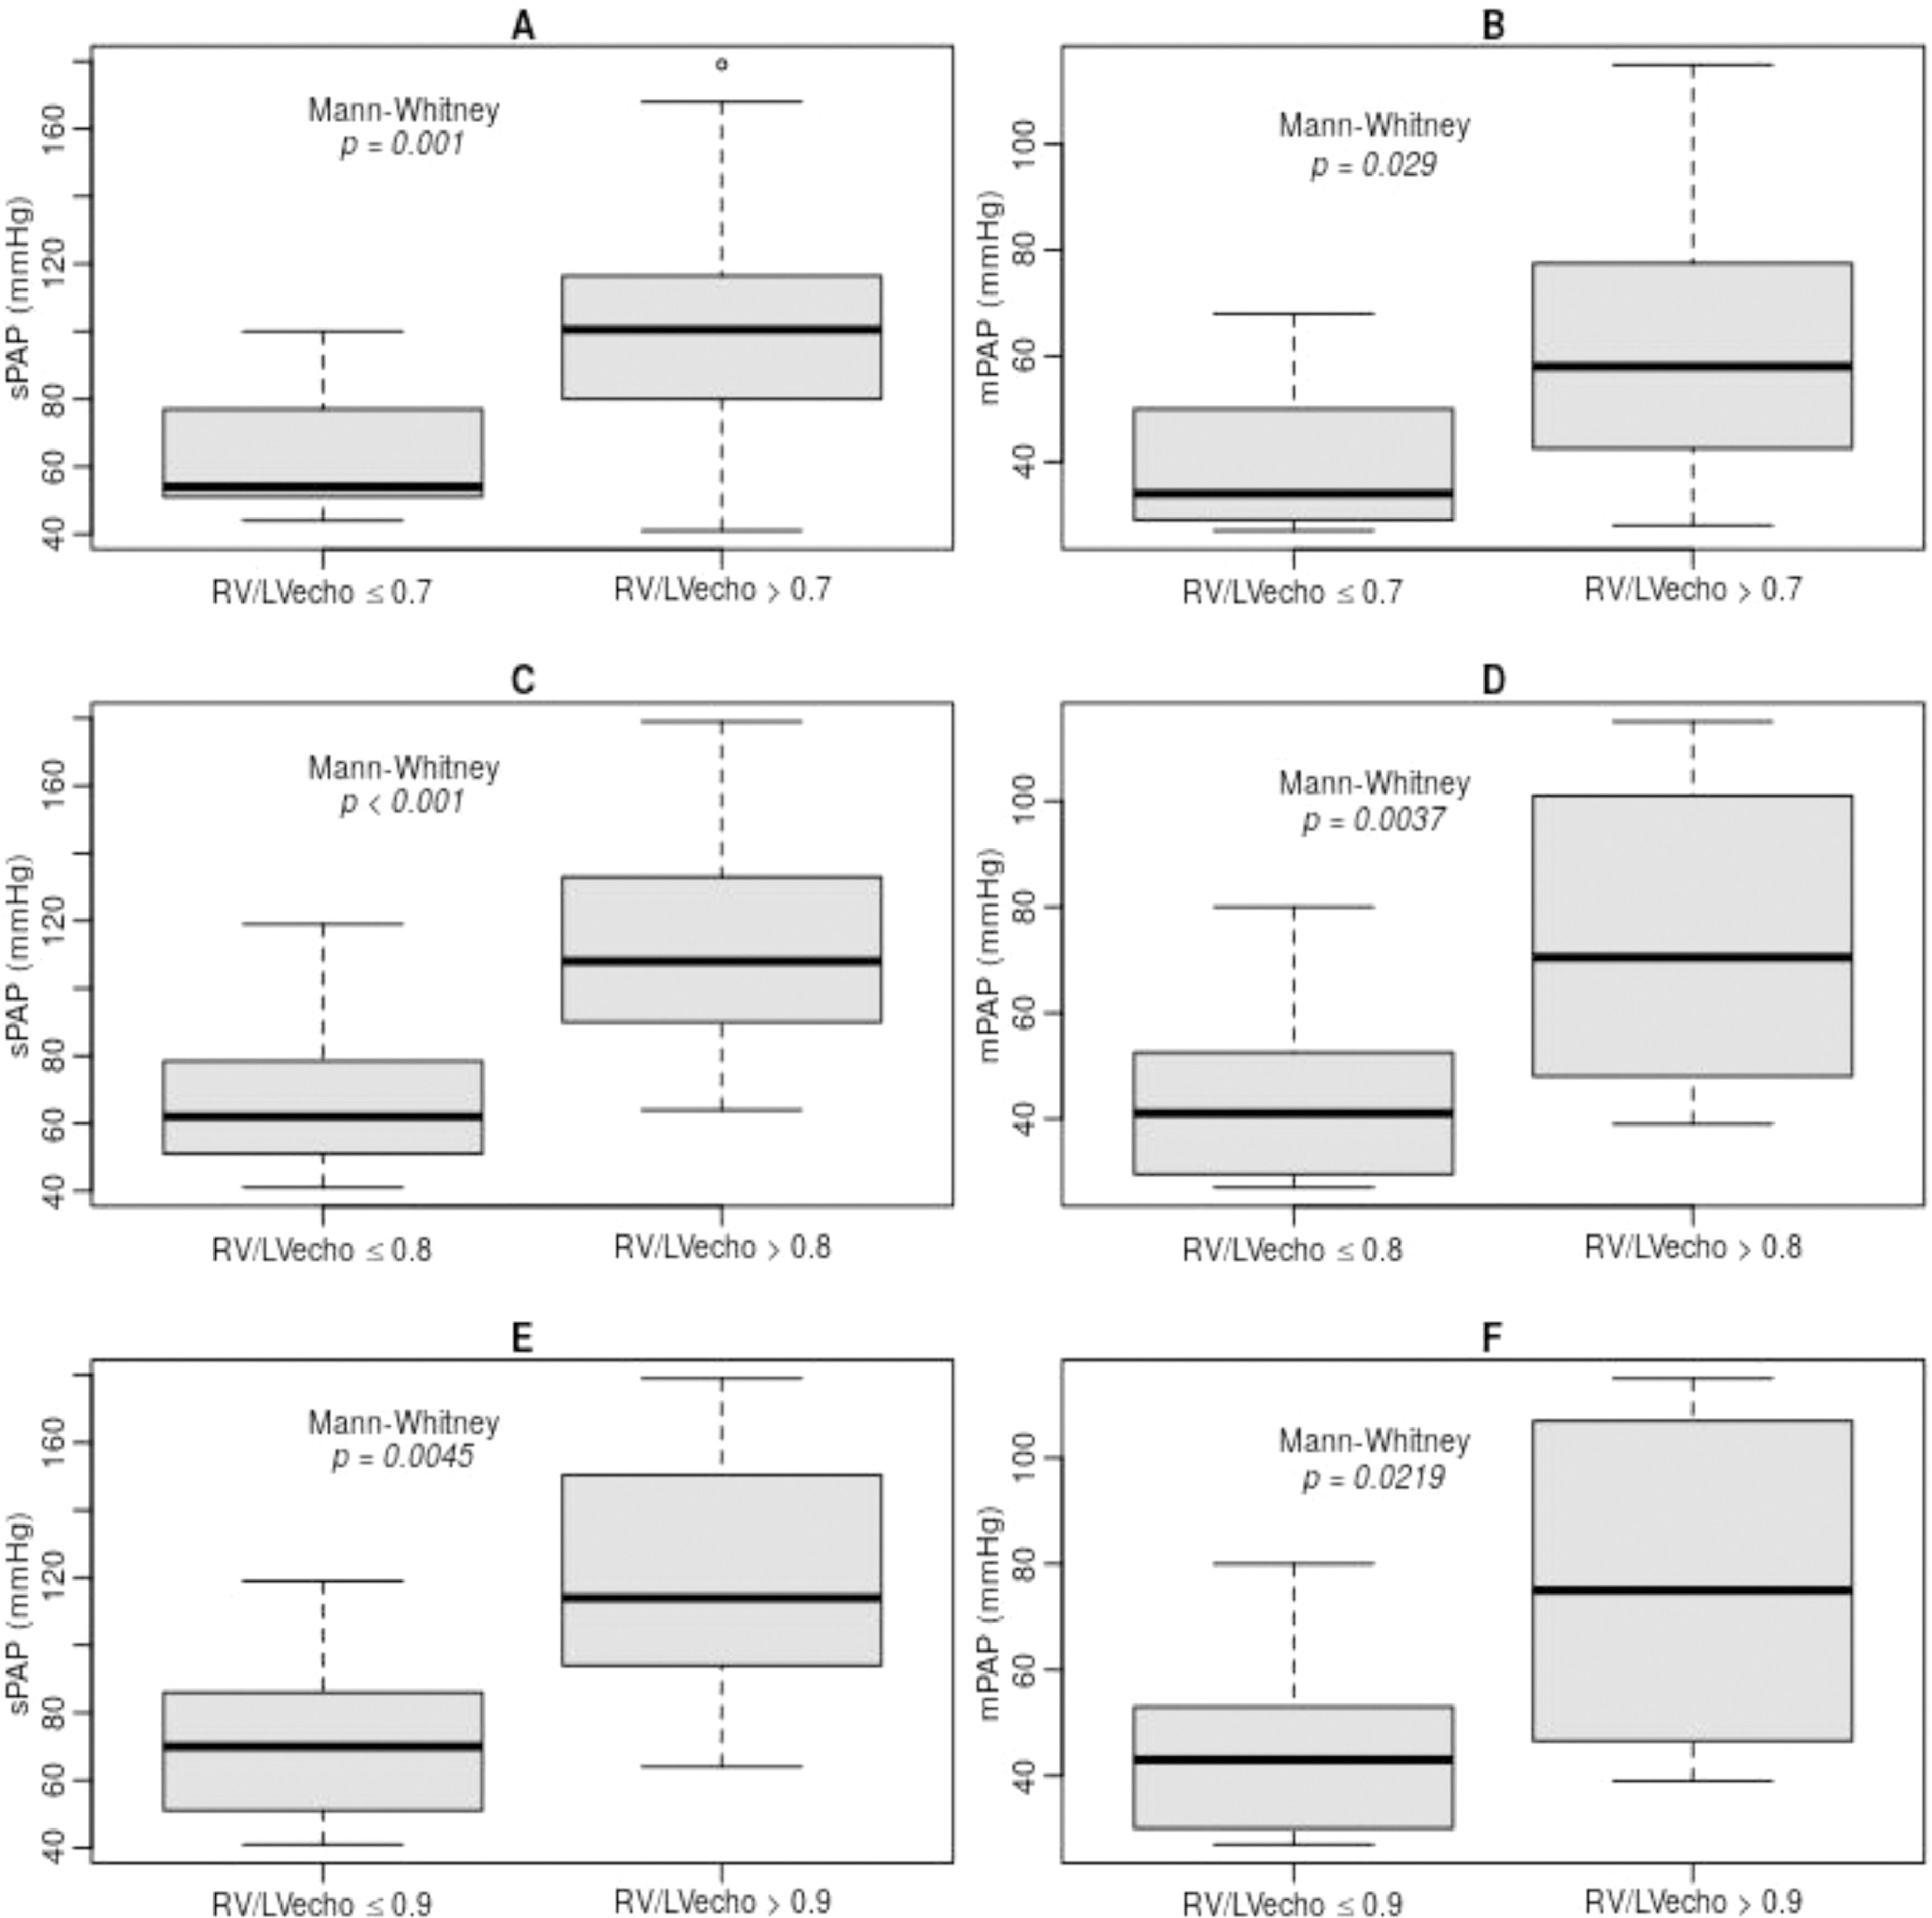
In RD/LV ratios <0.7, the sPAP was 63.5±17.5 mmHg and if ≥0.7, the sPAP was 101.9±36.8 mmHg (p = 0.001) (Fig. 1, A). When <0.8, the sPAP was 68.0±21.7 mmHg and if ≥0.8, the sPAP was 114.7±36.2 mmHg (p < 0.001) (Fig. 1, C). If <0.9, the sPAP was 71.7±23.2 mmHg and if ≥0.9, the sPAP was 120.9±41.8 mmHg (p = 0.0045) (Fig. 1, E).
In RD/LV ratios <0.7, mPAP was 39.5±12.1 mmHg and if ≥0.7, mPAP was 64.6±26.8 mmHg (p = 0.029) (Fig. 1, B). When <0.8, the mPAP was 42.6±14.5 mmHg and if ≥0.8, the mPAP was 72.5±28.7 mmHg (p = 0.0037) (Fig. 1, D). If <0.9, the mPAP was 45.0±15.6 mmHg and if ≥0.9, the mPAP was 76.6±33.4 mmHg (p = 0.0219) (Fig. 1, F).
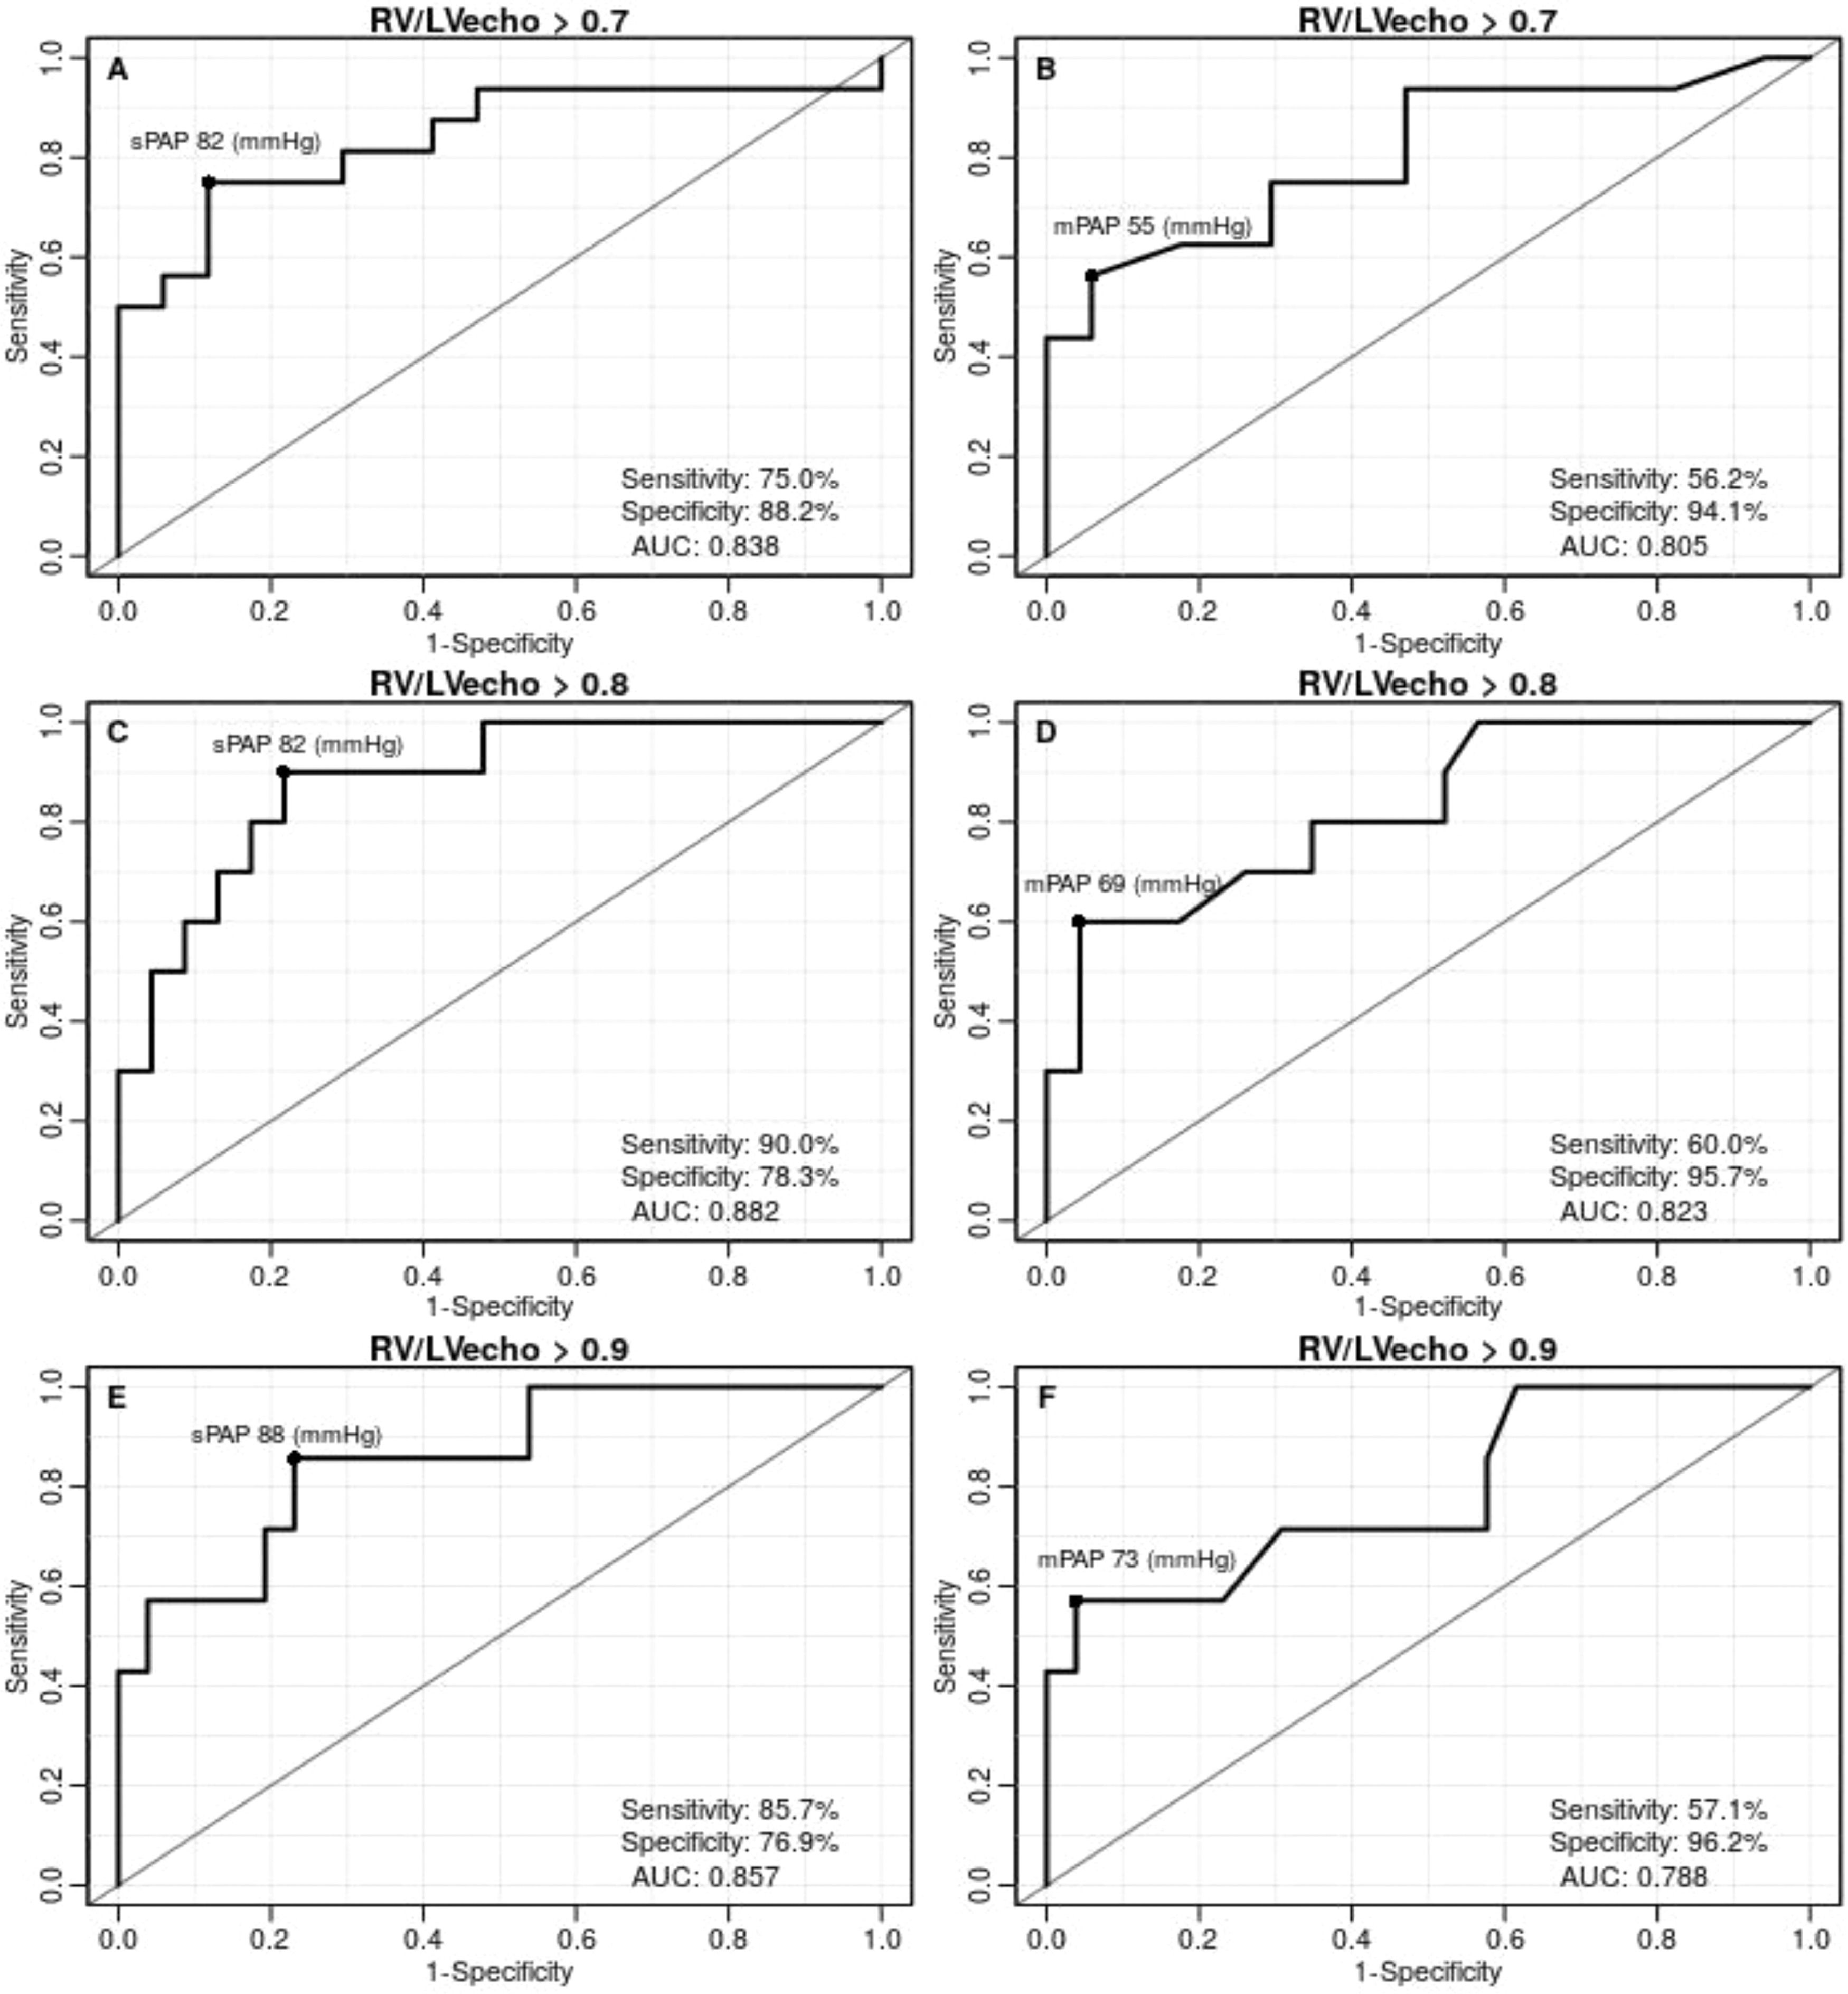
The ROC curves were generated to identify the best RV/LV ratio in estimating the hemodynamic severity of PHprecapillary by sPAP and mPAP. The studied RV/LV ratio varied between 0.7 and 1.0. There were no statistical differences between 0.9 and 1.0, since they were practically identical. Cutoff points for distinction, sensitivity, specificity, and AUC were obtained for each curve (Fig. 2).
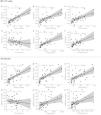
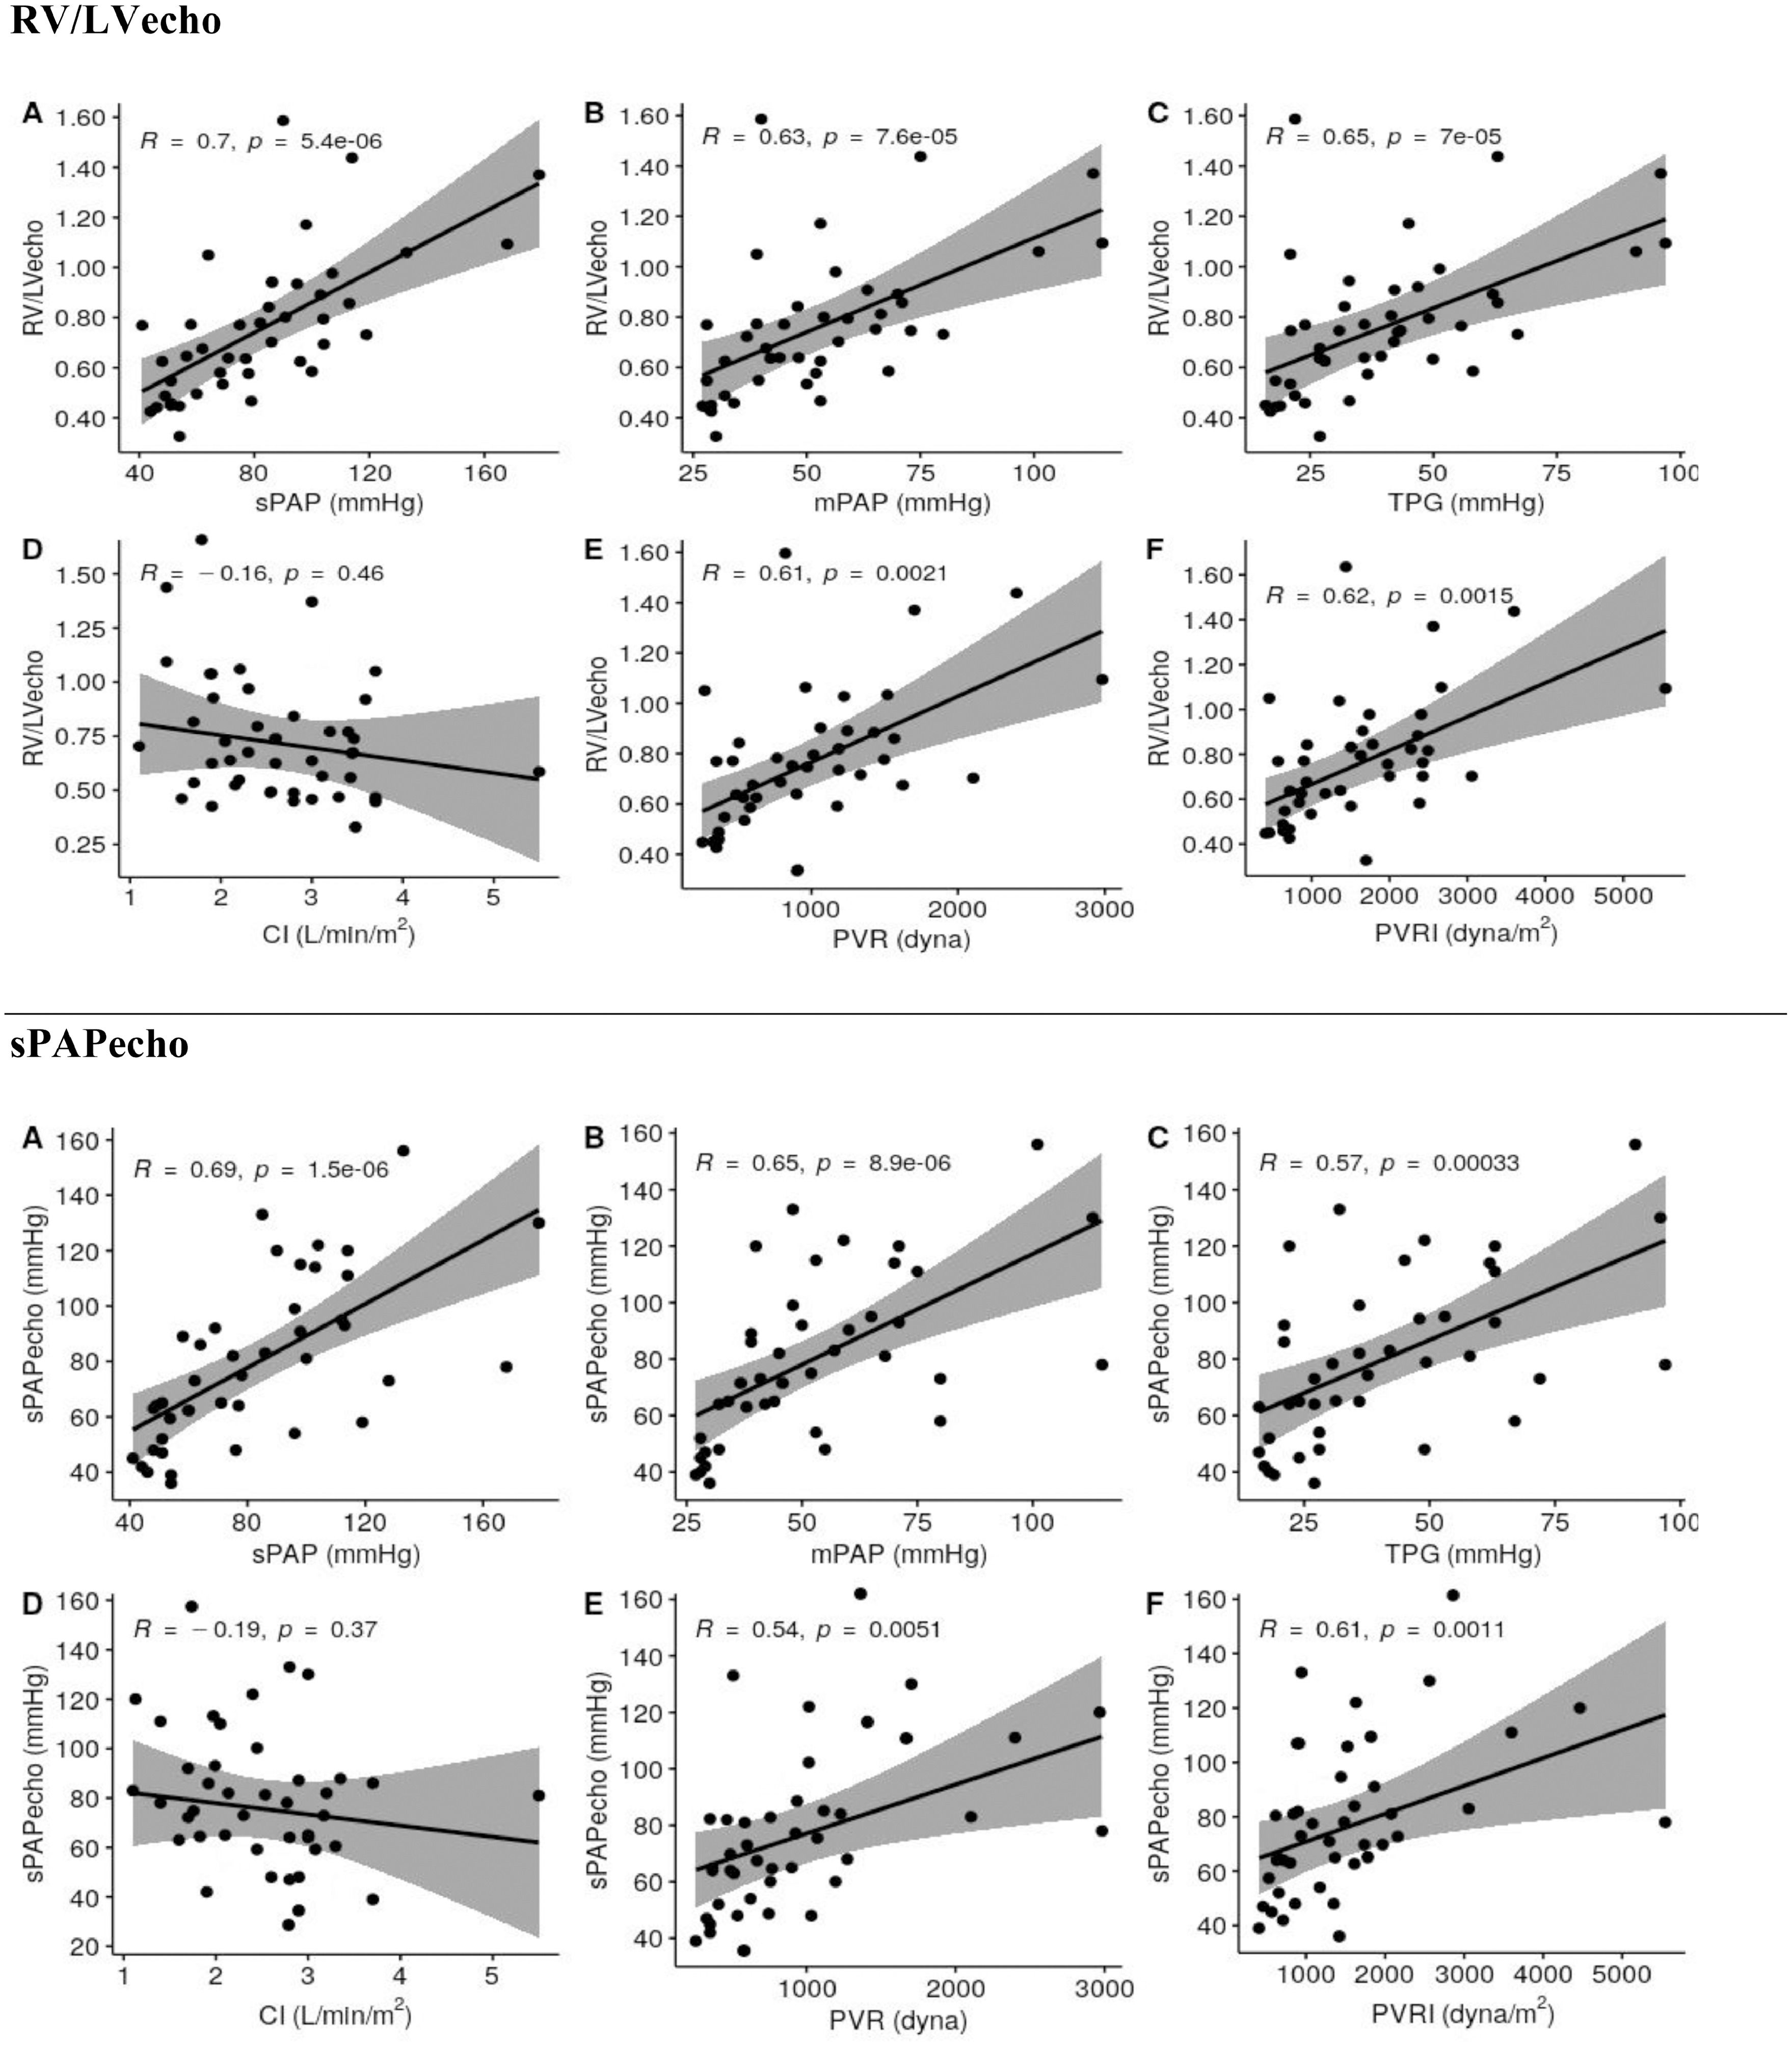
Spearman's correlation analysis between RV/LVecho and hemodynamic variables (Fig. 3) showed a significant correlation with sPAP (R = 0.7015, p < 0.0001), mPAP (R = 0.6332, p < 0.0001), TPG (R = 0.6524, p < 0.0001), PVR (R = 0.6076, p = 0.0021), and PVRI (R = 0.6229, p = 0.0015) (Fig. 2). There was no correlation with the CI (p = 0.4605) (Fig. 3).
Spearman's correlations (R) between the echocardiographic diastolic diameter right to left ventricles ratios (RV/LVecho) and the echocardiographic pulmonary artery systolic pressure (sPAPecho) with hemodynamic parameters.*
CI = cardiac index
mPAP = pulmonary artery mean pressure
PVR = pulmonary vascular resistance
PVRI = pulmonary vascular resistance index
sPAP = pulmonary artery systolic pressure
TPG = transpulmonary pressure gradient
*R with p < 0.05: correlation with statistical significance
Spearman's correlation was used between sPAPecho and hemodynamic parameters (Fig. 3). There was a significant correlation with sPAP (R = 0.6915, p < 0.0001), mPAP (R = 0.6529, p < 0.0001), TPG (R = 0.5654, p < 0.0003), PVR (R = 0.5424, p = 0.0050), and PVRI (R = 0.6120, p = 0.0011) (Fig. 3). There was no correlation with the CI (p = 0.3737) (Fig. 3).
DiscussionThe PH by definition has the presence of mPAP ≥25 mmHg in the hemodynamic study.2 There are discussions to consider the diagnosis >20 mmHg, as studies showed that the normal population had a mPAP of 14 mmHg with a standard deviation of 3.3 mmHg and possible to set 20 mmHg as the upper limit of normality.3.6 In the present study, of the 70 patients initially evaluated, only two had an sPAPecho of 21 mmHg (2.8%), similar to the already reported value in 2% to 6% of catheterizations performed for PH.3 However, these two patients had normal PVR and their RV/LVecho were 0.5 and 0.6. The mPAP of 25 mmHg obtained in cardiac catheterization corresponded to an approximate sPAPecho measure of 36 mmHg in the echocardiographic study. This measure is criticized for its lack of accuracy, but it is commonly used in clinical practice.2,8
Generally, sPAPecho at rest has no prognostic value and little clinical relevance in therapeutic decisions for patients with PHprecapillary.13-15 The increased sPAPecho does not necessarily reflect disease progression and its decrease does not mean clinical improvement either.2 This is due to the fact that the sPAP is directly proportional to RV CO and its variations can impact sPAPecho measurement, resulting in a conflicting interpretation.
Echocardiography to estimate PH severity needs to be further studied. This has become even more important since the last global guidelines define treatment based on the patient's risk for worse progression and increased morbidity.6 Currently, this risk is graded as low, intermediate, and high.2,6 Intermediate and high risks demand the association of pulmonary arterial vasodilators of different pharmacological classes, with two or three drugs.4 Therefore, risk assessment is crucial in the initial consultations by the clinician with parameters such as signs of right heart failure, progressive worsening of symptoms, syncope, and WHO/NYHA functional class.2,11,12 Complementary tests are also used, such as the 6MWT, cardiopulmonary exercise test, serum levels of brain natriuretic peptide (BNP) or its NT fraction (NT-proBNP), in addition to hemodynamic parameters during cardiac catheterization.2 The echocardiographic variables cited in the guidelines are the right atrium area and the presence of pericardial effusion.2 These markers are late findings in disease progression, being inadequate due to the current concepts of early diagnosis in less symptomatic patients.6 Some services experience isolated parameters in the echocardiographic assessment of severity and in right atrium and/or RV descriptions, intensity of tricuspid valve regurgitation, and RV contractility, which can be determined by RV systolic strain, by RV ejection fraction, by the TEI index (sum of the RV relaxation and isovolumetric contraction times divided by its ejection time), and by the tricuspid annular plane systolic excursion, among many others (TAPSE).3,16-21
Although the RV is recognized as a determining factor in exercise capacity and in long-term prognosis in PHprecapillary patients, no data related to it are observed in the current severity assessment guidelines.2,4 The RV initially adapts to the increased PVR with hypertrophy and remodeling, and dysfunction will occur when pressure overload is maintained for a prolonged period.17,22 RV dilation becomes increasingly significant, leading to volume and pressure overloads, in addition to tricuspid insufficiency. The interventricular septum presents progressive changes, with thickening, straightening, and displacement to the left, compromising LV filling and, consequently, its CO. Increased RV intramural pressure associated with low CO compromises RV coronary perfusion, resulting in a cycle of CO dysfunction and worsening, leading to progressive RV failure with related morbidity and mortality.23-28 An experimental study in a PHprecapillary model in rats showed RV dilatation and hypertrophy on necropsy, with myofilament fibrosis and destruction in the T-tubules and in the sarcoplasmic reticulum of RV muscle cells under electron microscopy.29 Some studies have analyzed anatomical and other functional parameters of this cardiac chamber, with the clear objective of defining their relationship with PAH severity.16-20 Greater attention should be paid to the RV, as it is the cardiac structure most affected by increased PVR, and its constitutional characteristics show RV adaptation and remodeling with increased PAP.28 This adaptation is evident after lung transplantation in PAH patients, with rapid readjustment to the new physiology and significant RV diameter reduction in the postoperative. However, the complex RV geometry means that no isolated echocardiographic variable can adequately describe its degree of impairment and consequent dysfunction.28 Experienced professionals that can interpret several pieces of echocardiographic information often provide better interpretations than the analysis of isolated RV variables.
This study consisted of a typical PAH population, with a predominance of women and mean age of 44 years, due to the higher incidence of idiopathic and associated with collagenosis. The patients were referred by a PH referral outpatient clinic experienced in the indication of right cardiac catheterization. All patients were symptomatic and mostly were in the WHO/NYHA III functional class, and this functional predominance corroborated most published clinical studies.11-15,18 This functional clinical pattern needs to be changed for an earlier diagnosis, either in class I in at-risk populations or in class II with mild non-disabling symptoms, as it directly interferes in disease progression with appropriate treatment in its early stages.6
Most patients had RVecho >26 mm and the mean IVSecho thickening was of 9.8 mm. These patterns were expected due to the hypothesis of this study, in which the RV began to remodel with dilation and hypertrophy with increased PVR. Progressive RV dilations and continuous interventricular septum thickening are expected changes for the understanding of the pathophysiology of pulmonary vascular diseases.22-24,26,28 It is noteworthy that this is a group of patients without LV disease, as seen in their diameters, mass, and functional data, showing that interventricular septal changes are due to the RV disease.
Cardiac catheterization confirmed a great variation in the hemodynamic severity of pulmonary vascular disease, strengthening the statistical correlation study.10 The patients were predominantly in the WHO/NYHA functional class III, and there was a great variation in PVR, noting with reservations a possible association of these functional classes with the hemodynamic severity of PHprecapillary and, thus, highlighting the need to include other non-invasive parameters in the evaluation of these patients.12
The RV measurement as a marker of hemodynamic severity was the objective of this study since the RV could be easily measured even with the use of other imaging techniques and on account of reproducibility of results with minor variation between observers, which was 5% in our echocardiography center.
Analyzed by the obtained ROC curves, the best cutoff point was 0.8 for the hemodynamic severity of sPAP, with an AUC of 0.882, and of mPAP, with AUC of 0.823. The sPAP presented the highest sensitivity (90.0%) for hemodynamic severity with RV/LV ratio >0.8 (cutoff of 82 mmHg and AUC of 0.882). The mPAP had highest specificity (95.7%) for hemodynamic severity with RV/LV >0.8 (cutoff of 69 mmHg and AUC of 0.823).
The RV/LVecho value to be used is still a matter of debate in echocardiography and tomography, with published studies reporting values ranging from 0.8 to 1.2 and its more frequent use in the diagnosis of PH; however, its relationship with hemodynamic severity is not yet clearly defined.2,8,30,31 A study demonstrated that a RV/LV ratio of 0.84 or greater was related to the severity of idiopathic PAH and may be an independent predictor of prognosis in these patients.31 This ratio is being used in other diagnostic imaging tests, and more rarely as a marker of severity, but we believe that the initial analysis should be echocardiographic, despite the increasing contribution of magnetic resonance imaging of the heart.32 This present study showed a significant association between RV/LVecho from 0.7 to 0.9 with the hemodynamic variables sPAP and mPAP; however, the most robust distinction cutoff was 0.8.
There was a significant correlation between RV/LVecho and pulmonary pressure and PVR hemodynamic parameters, which can be defined as moderate.10 This correlation was previously demonstrated and was expected because the increased PVR is the basic mechanism of PHprecapillary, with consequently increased pressures and RV overload.31,33 The only variable without correlation was CI, demonstrating that the size of the RV is not directly associated with the preservation of its contractile function when not very dilated. The same correlation study with the sPAPecho measurement was performed for comparison, with better correlations between the RV/LVecho variable and most hemodynamic variables. The RV/LVecho ratio is more robust than the sPAPecho, as it represents more persistent and fixed RV changes due to an increased PVR, values a comparative analysis with the LV, and has no technical influence related to adequate tricuspid valve regurgitation velocity measurements or to the estimation of possible RA pressure on echocardiography.2,8
The limitations of this study are its small sample size, it being a single-center study, and the reduced follow-up time for mortality analysis.
Echocardiographic morphometric RV analysis is an important contribution to severity assessment in a patient with PHprecapillary. The RV/LVecho ratio should be implemented in risk assessment with notions of hemodynamic severity, in addition to the consequent guidance and monitoring of the treatment to be instituted.31,34-36
In conclusion, a RV/LVecho >0.8 is associated with higher sPAP and mPAP in the cardiac catheterism. In addition, the RV/LVecho has a significant positive correlation with the hemodynamic severity of sPAP, mPAP, TPG, PVR, and PVRI.
Conflicts of interestThe authors declare no conflicts of interest in this study.
The authors thank all the patients involved in this research, the Pulmonary Hypertension Outpatient Clinic, the Echocardiography Laboratory, and the Hemodynamics Laboratory of the CHC-UFPR.


